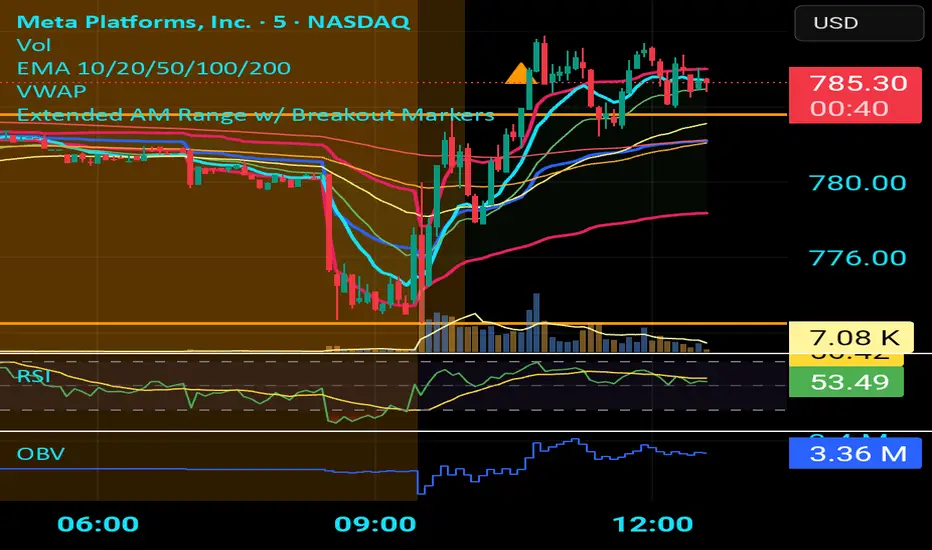
Extended AM Range w/ Breakout Markerscreates a range from market starting till 10 am (half an hour into the market
Bandes et canaux
Indicador Millo SMA20-SMA200-AO-RSI M1This indicator is designed for scalping in 1-minute timeframes on crypto pairs, combining trend direction, momentum, and oscillator confirmation.
Logic:
Trend Filter:
Only BUY signals when price is above the SMA200.
Only SELL signals when price is below the SMA200.
Entry Trigger:
BUY: Price crosses above the SMA20.
SELL: Price crosses below the SMA20.
Confirmation Window:
After the price cross, the Awesome Oscillator (AO) must cross the zero line in the same direction within a maximum of N bars (configurable, default = 4).
RSI must be > 50 for BUY and < 50 for SELL at the moment AO confirms.
Cooldown:
A cooldown period (configurable, default = 10 bars) prevents multiple signals of the same type in a short time, reducing noise in sideways markets.
Features:
Works on any crypto pair and can be used in other markets.
Adjustable confirmation window, RSI threshold, and cooldown.
Alerts ready for BUY and SELL conditions.
Can be converted into a strategy for backtesting with TP/SL.
Suggested Use:
Pair: BTC/USDT M1 or similar high-liquidity asset.
Combine with manual support/resistance or higher timeframe trend analysis.
Recommended to confirm entries visually and with additional confluence before trading live.

Trading Sessionsconst string TZ_TOOLTIP_TEXT = "The session's time zone, specified in either GMT notation (e.g., 'GMT-5') or as an IANA time zone database name (e.g., 'America/New_York')."

FlowScape PredictorFlowScape Predictor is a non-repainting, regime-aware entry qualifier that turns complex market context into two readiness scores (Long & Short, each 0/25/50/75/100) and clean, confirmed-bar signals. It blends three orthogonal pillars so you act only when trend energy, momentum, and location agree:
Regime (energy): ATR-normalized linear-regression slope of a smooth HMA → EMA baseline, gated by ADX to confirm when pressure is meaningful.
Momentum (push): RSI slope alignment so price has directional follow-through, not just drift.
Structure (location): proximity to pivot-confirmed swings, scaled by ATR, so “ready” appears near constructive pullbacks—not mid-trend chases.
A soft ATR cloud wraps the baseline for context. A yellow Predictive Baseline extends beyond the last bar to visualize near-term trajectory. It is visual-only: scores/alerts never use it.
What you see
Baseline line that turns green/red when regime is strong in that direction; gray when weak.
ATR cloud around the baseline (context for stretch and pullbacks).
Scores (Long & Short, 0–100 in steps of 25) and optional “L/S” icons on bar close.
Yellow Predictive Baseline that extends to the right for a few bars (visual trajectory of the smoothed baseline).
The scoring system (simple and transparent)
Each side (Long/Short) sums four binary checks, 25 points each:
Regime aligned: trendStrong is true and LR slope sign favors that side.
Momentum aligned: RSI side (>50 for Long, <50 for Short) and RSI slope confirms direction.
Baseline side: price is above (Long) / below (Short) the baseline.
Location constructive: distance from the last confirmed pivot is healthy (ATR-scaled; not overstretched).
Valid totals are 0, 25, 50, 75, 100.
Best-quality signal: 100/0 (your side/opposite) on bar close.
Good, still valid: 75/0, especially when the missing block is only “location” right as price re-engages the cloud/baseline.
Avoid: 75/25 or any opposition > 0 in a weak (gray) regime.
The Predictive (Kalman) line — what it is and isn’t
The yellow line is a visual forward extension of the smoothed baseline to help you see the current trajectory and time pullback resumptions. It does not predict price and is excluded from scores and alerts.
How it’s built (plain English):
We maintain a one-dimensional Kalman state x as a smoothed estimate of the baseline. Each bar we observe the current baseline z.
The filter adjusts its trust using the Kalman gain K = P / (P + R) and updates:
x := x + K*(z − x), then P := (1 − K)*P + Q.
Q (process noise): Higher Q → expects faster change → tracks turns quicker (less smoothing).
R (measurement noise): Higher R → trusts raw baseline less → smoother, steadier projection.
What you control:
Lead (how many bars forward to draw).
Kalman Q/R (visual smoothness vs. responsiveness).
Toggle the line on/off if you prefer a minimal chart.
Important: The predictive line extends the baseline, not price. It’s a visual timing aid—don’t automate off it.
How to use (step-by-step)
Keep the chart clean and use a standard OHLC/candlestick chart.
Read the regime: Prefer trades with green/red baseline (trendStrong = true).
Check scores on bar close:
Take Long 100 / Short 0 or Long 75 / Short 0 when the chart shows a tidy pullback re-engaging the cloud/baseline.
Mirror the logic for shorts.
Confirm location: If price is > ~1.5 ATR from its reference pivot, let it come back—avoid chasing.
Set alerts: Add an alert on Long Ready or Short Ready; these fire on closed bars only.
Risk management: Use ATR-buffered stops beyond the recent pivot; target fixed-R multiples (e.g., 1.5–3.0R). Manage the trade with the baseline/cloud if you trail.
Best-practice playbook (quick rules)
Green light: 100/0 (best) or 75/0 (good) on bar close in a colored (non-gray) regime.
Location first: Prefer entries near the baseline/cloud right after a pullback, not far above/below it.
Avoid mixed signals: Skip 75/25 and anything with opposition while the baseline is gray.
Use the yellow line with discretion: It helps you see rhythm; it’s not a signal source.
Timeframes & tuning (practical defaults)
Intraday indices/FX (5m–15m): Demand 100/0 in chop; allow 75/0 when ADX is awake and pullback is clean.
Crypto intraday (15m–1h): Prefer 100/0; 75/0 on the first pullback after a regime turn.
Swing (1h–4h/D1): 75/0 is often sufficient; 100/0 is excellent (fewer but cleaner signals).
If choppy: raise ADX threshold, raise the readiness bar (insist on 100/0), or lengthen the RSI slope window.
What makes FlowScape different
Energy-first regime filter: ATR-normalized LR slope + ADX gate yields a consistent read of trend quality across symbols and timeframes.
Location-aware entries: ATR-scaled pivot proximity discourages mid-air chases, encouraging pullback timing.
Separation of concerns: The predictive line is visual-only, while scores/alerts are confirmed on close for non-repainting behavior.
One simple score per side: A single 0–100 readiness figure is easier to tune than juggling multiple indicators.
Transparency & limitations
Scores are coarse by design (25-point blocks). They’re a gatekeeper, not a promise of outcomes.
Pivots confirm after right-side bars, so structure signals appear after swings form (non-repainting by design).
Avoid using non-standard chart types (Heikin Ashi, Renko, Range, etc.) for signals; use a clean, standard chart.
No lookahead, no higher-timeframe requests; alerts fire on closed bars only.

WaveTrend Dynamic (Lazy Bear Style)█ OVERVIEW
The WaveTrend Dynamic indicator (in the style of Lazy Bear) is an advanced tool based on the Exponential Smoothing Average (ESA), which adapts to the volatility and price of a financial instrument. It is more flexible than the classic WaveTrend but shares a similar concept of bands around a main oscillator line.
The indicator uses dynamic bands calculated as distances from the ESA, with their width adjustable via the "level" parameter. This allows it to be tailored to various markets, timeframes, and volatility conditions, making it easier to identify trends, reversal points, and buy/sell signals.
█ CONCEPTS
The WaveTrend Dynamic combines oscillator functions with trend analysis. Below, we explain the key components in a simple way, understandable even for beginner users.
Core Calculations
The indicator relies on the adaptive ESA and a few straightforward steps:
1 — ESA (Adaptive Average): Calculated as a smoothed average of the price (from high, low, and close, or HLC3) using the ESA Length parameter (default: 10). This number determines how many past candles are considered in the calculation. The ESA quickly responds to price changes, helping to track trends.
2 — Deviation (D): Measures how much the price deviates from the ESA, factoring in market volatility. This allows the indicator to adapt to different instruments.
3 — Price Distance Indicator (CI): Shows how far the price is from the ESA relative to market volatility. This forms the basis for the main indicator line, reacting to price movements.
4 — WT1 (WaveTrend 1): The main line, smoothing the Price Distance Indicator (CI) with the Average Length parameter (default: 21). It reflects the direction of price movement and momentum.
5 — WT2 (WaveTrend 2): A signal line that further smooths WT1 (with a period of 4). It helps confirm signals through crossovers with WT1.
6 — Bands (UpperBand and LowerBand): These form a dynamic channel around the ESA. Their width depends on the level parameter (default: 100). Wider bands result in fewer but more reliable signals. In the original WaveTrend, the oscillator bands use lower values, such as 50 or 60. To achieve classic oscillator signals (more frequent WT1/WT2 crossovers outside the bands), set the level to 50–60.
Trend Identification
The indicator identifies two types of trends:
• Major Trend: Determined by the position of WT1 relative to the ESA. When WT1 is above the ESA, it indicates a bullish trend. When below, it signals a bearish trend. Line and fill colors reflect this trend.
• Mini-Trend: Based on WT1 and WT2 crossovers. When the lines cross, they change to the same color, signaling short-term changes or reversal points. This is ideal for quick trading decisions.
Visuals and Effects
• WT1 and WT2 Lines: Scaled to price and displayed on the price chart for easier analysis.
• Fills: Between the bands (UpperBand/LowerBand) and between WT1/WT2, with a "wave" effect that adjusts transparency based on the trend (green for bullish, red for bearish).
• Signals: Three types—return-to-band, WT1/WT2 crossovers outside the bands, and crossovers inside the bands. Signals are displayed as triangles with different colors for buy and sell.
█ FEATURES
Detailed features of the indicator, aligned with the order of settings in the script:
• Basic Parameters: ESA Length — controls ESA smoothing; Average Length — affects WT1 responsiveness; level (WT Level) — adjusts band width for signal filtering.
• Display Elements: Options to show/hide ESA, bands, WT1/WT2; customizable colors for lines, fills, and the wave effect.
• Signals: Three signal groups (return-to-band, crossovers outside bands, crossovers inside bands) with display and color customization options.
█ HOW TO USE
1 — Add the indicator to your TradingView chart and adjust parameters: — Increase ESA Length and Average Length for low-volatility markets (e.g., stocks), or decrease for cryptocurrencies or forex. — Set level to 50–60 for classic WaveTrend signals with WT1/WT2 crossovers outside bands. The default value of 100 creates wider bands and fewer signals.
2 — Analyze trends: — Major trend (WT1 vs. ESA) shows the overall market direction. — Mini-trends (WT1/WT2 crossovers) help time short-term entries.
3 — Use signals: — Return-to-band: Buy at the lower band, sell at the upper band (mean-reversion). — Crossovers outside bands: Indicate strong momentum (with a lower level, e.g., 50). — Crossovers inside bands: Signal weaker trend changes.
4 — Combine with other tools: Use with volume, RSI, or support/resistance for better decisions. Test on historical data to optimize settings.

ABS NR — Fail-Safe Confirm (v4.2.2)
# ABS NR — Fail-Safe Confirm (v4.2.2)
## What it is (quick take)
**ABS NR FS** is a **non-repainting “arm → confirm” entry framework** for intraday and swing execution. It blends:
* **Regime** (EMA stack + 60-min slope),
* **Location** (Keltner basis/edges),
* **Stretch** (session-anchored **VWAP Z-score**),
* **Momentum gating** (TSI cross/slope),
* **Guards** (session window, minimum ATR%, gap filter, optional market alignment).
You’ll see a **small dot** when a setup is **armed** (candidate) and a **triangle** when that setup **confirms** within a user-defined number of bars. A **gray “X”** marks a timeout (candidate canceled).
> Tip: This entry tool works best when paired with a trend context filter and a dedicated exit tool.
---
## How to use it (operational workflow)
1. **Read the regime**
* **Bull trend**: fast > slow > long EMA **and** 60-min slope up.
* **Bear trend**: fast < slow < long EMA **and** 60-min slope down.
* **Range**: neither bull nor bear.
2. **Wait for a candidate (dot)**
Two families:
* **Reclaim (trend-following):** price crosses the **KC basis** with acceptable |Z| (not overstretched) and passes the TSI gate.
* **Fade (range-revert):** price **pokes a KC band**, prints a **reversal wick**, |Z| is stretched, and TSI gate agrees.
3. **Trade the confirmation (triangle)**
The confirm must occur **within N bars** and follow your chosen **Confirm mode** logic (see Inputs). If confirmation doesn’t arrive in time, an **X** cancels the candidate.
4. **Use guards to avoid junk**
Session windows (US focus), minimum ATR%, gap guard, and optional **market alignment** (e.g., SPY above EMA20 for longs).
5. **Manage the position**
* Entries: take **triangles** in the direction of your playbook (reclaims with trend; fades in clean ranges).
* Filters and exits: use your own process or pair with a trend/exit companion.
---
## Visual semantics & alerts
* **Candidate L / S (dot)** → a setup armed on this bar.
* **CONFIRM L / S (triangle)** → actionable signal that met confirm rules within your time window.
* **Cancel L / S (X)** → candidate expired without confirmation; ignore the dot.
**Alerts (stable names for automation):**
* **ABS FS — Confirmed** → fires on confirmed long or short.
* **ABS FS — Candidate Armed** → fires as a candidate arms.
---
## Non-repainting behavior (why signals don’t repaint)
* All HTF requests use **lookahead\_off**.
* With **Strict NR = true**, the 60-min slope uses the **prior completed** 60-min bar and arming/confirming only occurs on confirmed bars.
* Confirmation triangles finalize on bar close.
* If you disable strictness, signals may appear slightly earlier but with more intrabar sensitivity.
---
## Inputs reference (what each control does and the trade-offs)
### A) Behavior / Modes
**Mode** (`Turbo / Aggressive / Balanced / Conservative`)
Changes multiple internal thresholds:
* **Turbo** → most signals; relaxes prior-bar break & VWAP-side checks and time/vol/gap guards. Highest frequency, highest noise.
* **Aggressive** → more signals than Balanced, fewer than Turbo.
* **Balanced** → default; steady trade-off of frequency vs. quality.
* **Conservative** → tightens |Z| and other checks; fewest but cleanest signals.
**Strict NR (bar close + prior HTF 60m)**
* **true** = safer: uses prior 60-min slope; arms/confirms on confirmed bars → **fewer/cleaner** signals.
* **false** = earlier and more reactive; slightly noisier.
---
### B) Keltner Channel (location engine)
* **KC EMA Length (`kcLen`)**
Higher → smoother basis (fewer basis crosses). Lower → snappier basis (more crosses).
* **ATR Length (`atrLen`)**
Higher → steadier band width; Lower → more reactive band width.
* **KC ATR Mult (`kcMult`)**
Higher → wider bands (fewer edge pokes → fewer fades). Lower → narrower (more fades).
---
### C) Trend & HTF slope
* **Trend EMA Fast/Slow/Long (`emaFastLen / emaSlowLen / emaLongLen`)**
Larger = slower regime flips (fewer reclaims); smaller = faster flips (more reclaims).
* **HTF EMA Len (60m) (`htfLen`)**
Larger = steadier HTF slope (fewer signals); smaller = more sensitive (more signals).
---
### D) VWAP Z-Score (stretch / mean-revert logic)
* **VWAP Z-Length (`zLen`)**
Window for Z over session-anchored VWAP distance. Larger = smoother |Z| (fewer fades/re-entries). Smaller = more reactive (more).
* **Range Fade |Z| (base) (`zFadeBase`)**
Minimum |Z| to allow **fades** in ranges. Raise to demand more stretch (fewer fades). Lower to take more fades.
* **Max |Z| Trend Re-entry (base) (`maxZTrendBase`)**
Caps how stretched price can be and still permit **reclaims** with trend. Lower = stricter (avoid chases). Higher = will chase further.
---
### E) TSI Momentum Gate
* **TSI Long/Short/Signal (`tsiLong / tsiShort / tsiSig`)**
Larger = smoother/laggier momentum; smaller = snappier.
* **TSI gate (`CrossOnly / CrossOrSlope / Off`)**
* **CrossOnly**: require TSI cross of its signal (strict).
* **CrossOrSlope**: cross *or* favorable slope (balanced default).
* **Off**: no momentum gate (most signals, most noise).
---
### F) Guards (filters to avoid low-quality tape)
* **US focus 09:35–10:30 & 14:00–15:45 (base) (`useTimeBase`)**
`true` limits to high-quality windows. `false` trades all session.
* **Skip N bars after 09:30 ET (`skipFirst`)**
Skips the open scramble. Larger = skip longer.
* **Min volatility ATR% (base)** = `useVolMinBase` + `atrPctMinBase`
Requires `ATR(10)/Close*100 ≥ atrPctMinBase`. Raise threshold to avoid dead tape; lower to accept quieter sessions.
* **Gap guard (base)** = `gapGuardBase` + `gapMul`
Blocks signals when the opening gap exceeds `gapMul * ATR`. Increase `gapMul` to allow more gapped opens; decrease to be stricter.
---
### G) Visuals & Sides
* **Plot Keltner (`plotKC`)** → show/hide basis & bands.
* **Show Longs / Show Shorts** → enable/disable each side.
---
### H) Fail-Safe Confirmation
* **Confirm mode (`BreakHighOnly / BreakHigh+Hold / TwoBarImpulse`)**
* **BreakHighOnly**: confirm by taking out the armed bar’s extreme. Fastest, most frequent.
* **BreakHigh+Hold**: must **break**, have **body ≥ X·ATR**, **and** hold above/below the basis → higher quality, fewer signals.
* **TwoBarImpulse**: decisive follow-through vs. prior bar with **body ≥ X·ATR** → momentum-biased confirmations.
* **Confirm within N bars (`confirmBars`)**
Confirmation window size. Smaller = faster validation; larger = more patience (can be later).
* **Impulse body ≥ X·ATR (`impulseBodyATR`)**
Raise for stronger confirmations (fewer weak triangles). Lower to accept lighter pushes.
* **Require market alignment (`needMarket`) + `marketTicker`**
When enabled: Longs require **market > EMA20 (5m)**; Shorts require **market < EMA20 (5m)**.
* **Diagnostics: Show debug letters (`debug`)**
Tiny “B/C” audit marks for base/confirm while tuning.
---
## Tuning recipes (quick, practical)
* **If you’re getting chopped:**
* Set **Mode = Conservative**
* **Confirm mode = BreakHigh+Hold**
* Raise **impulseBodyATR** (e.g., 0.45)
* Keep **needMarket = true**
* Keep **Strict NR = true**
* **If you need more signals:**
* **Mode = Aggressive** (or Turbo if you accept more noise)
* **Confirm mode = BreakHighOnly**
* Lower **impulseBodyATR** (0.25–0.30)
* Increase **confirmBars** to 3
* **Range-day focus (fades):**
* Keep session guard on
* Raise **zFadeBase** to demand real stretch
* Keep **maxZTrendBase** moderate (don’t chase)
* **Trend-day focus (reclaims):**
* Slightly **lower `maxZTrendBase`** (avoid chasing excessive stretch)
* Use **CrossOrSlope** TSI gating
* Consider turning **needMarket** on
---
## Best practices & notes
* **Instrument specificity:** Tune Z, TSI, and guards per symbol and timeframe.
* **Session awareness:** Session filter uses **exchange-local** time; adjust for non-US markets.
* **Automation:** Use the two provided alert names; they’re stable.
* **Risk management:** Confirmation improves quality but doesn’t remove risk. Always pre-define stop/size logic.
---
## Suggested starting point (balanced profile)
* **Mode = balanced**
* **Strict NR = true**
* **Confirm mode = BreakHigh+Hold**
* **confirmBars = 2**
* **impulseBodyATR ≈ 0.35**
* **needMarket = off** (turn on for extra confluence)
* Leave Keltner/TSI defaults; then nudge `zFadeBase` and `maxZTrendBase` to match your symbol.
---
*This tool is a signal generator, not a broker or strategy. Validate on your markets/timeframes and integrate with your risk plan.*

All-Time High/Low Levels with Dynamic Price Zones📈 All-Time High/Low Levels with Dynamic Price Zones — AlertBlake
🧠 Overview:
This powerful indicator automatically identifies and draws the All-Time High (AT.H) and All-Time Low (AT.L) on your chart, providing a clear visual framework for price action analysis. It also calculates and displays the Midpoint (50%), Upper Quartile (75%), and Lower Quartile (25%) levels, creating a dynamic grid that helps traders pinpoint key psychological levels, support/resistance zones, and potential breakout or reversal areas.
✨ Features:
Auto-Detection of All-Time High and Low:
Tracks the highest and lowest prices in the full visible historical range of the chart.
Automatically updates as new highs or lows are created.
Dynamic Level Calculation:
Midpoint (50%): Halfway between AT.H and AT.L.
25% Level: 25% between AT.L and AT.H.
75% Level: 75% between AT.L and AT.H.
Each level is clearly labeled with its corresponding value.
Labels are positioned to the right of the price for easy reading.
Color-Coded Lines (customizable)

Queso Heat IndexQueso Heat Index (QHI) — ATR-Adaptive Edge-Pressure Gauge
QHI measures how strongly price is pressing the edges of a rolling consolidation window. It heats up when price repeatedly pushes the window up , cools down when it pushes down , and drifts back toward neutral when price wanders in the middle. Everything is ATR-normalized so it adapts across symbols and timeframes.
Output: a signed score from −100 … +100
> 0 = bullish pressure (hot)
< 0 = bearish pressure (cold)
≈ 0 = neutral (no side dominating)
What you’ll see on the chart
Rolling “box” (Donchian window): top, bottom, and midline.
Optional compact-box shading when the window height is small relative to ATR.
Background “thermals”: tinted red when Heat > Hot threshold, blue when Heat < Cold threshold (intensity scales with the score).
Optional Heat line (−100..+100), optional 0/±80 thresholds, and optional push markers (PU/PD).
Optional table showing the current Heat score, placeable in any corner.
How it works (under the hood)
Consolidation window — Over lookback bars we track highest high (top), lowest low (bottom), and midpoint. The window is called “compact” when box height ≤ ATR × maxRangeATR .
ATR-based push detection — A bar is a push-up if high > prior window high + (epsATR × ATR + tick buffer) . A push-down if low < prior window low − (epsATR × ATR + tick buffer) . We also measure how many ATRs beyond the edge the bar traveled.
Heat gains (symmetric) — Each push adds/subtracts Heat:
base gain + streak bonus × consecutive pushes + magnitude bonus × ATRs beyond edge .
Decay toward neutral — Each bar, Heat decays by a percentage. Decay is:
– higher in the middle band of the box, and
– adaptive : the farther (in ATRs) from the relevant band (top when hot, bottom when cold), the faster it decays; hugging the band slows decay.
Midpoint bias (optional) — Gentle drift toward hot when trading above mid, toward cold when below mid, with a dead-zone near mid so tiny wobbles don’t matter.
Reset on regime flip (optional) — First valid push from the opposite side can snap Heat back to 0 before applying new gains.
How to read it
Rising hot with slow decay → strong upside pressure; pullbacks that hold near the top band often continue.
Flip to cold after being hot → regime change risk; tighten risk or consider the other side.
Compact window + rising hot (or cold) → squeeze-and-go conditions.
Neutral (≈ 0) → edges aren’t being pressured; expect mean-reversion inside the box.
Key inputs (what they do)
Window & ATR
lookback : size of the Donchian window (longer = smoother, slower).
atrLen : ATR period for all volatility-scaled thresholds.
maxRangeATR : defines “compact” windows for optional shading.
topBottomFrac : how thick the top/bottom bands are (used for decay/pressure logic).
Push detection (ATR-based)
epsATR : how many ATRs beyond the prior edge to count as a real push.
tickBuff : fixed extra ticks beyond the ATR epsilon (filters micro-breaches).
Heat gains
gainBase : main fuel per push.
gainPerStreak : rewards consecutive pushes.
gainPer1ATRBrk : adds more for stronger breakouts past the edge.
resetOppSide : snap back to 0 on the first opposite-side push.
Decay
decayPct : baseline % removed each bar.
decayAccelMid : multiplies decay when price is in the middle band.
adaptiveDecay , decayMinMult , decayPerATR , decayMaxMult : scale decay with ATR distance from the nearest “target” band (top if hot, bottom if cold).
Midpoint bias
useMidBias : enable/disable drift above/below midpoint.
midDeadFrac : width of neutral (no-drift) zone around mid.
midBiasPerBar : max drift per bar at the box edge.
Visuals (all default to OFF for a clean chart)
Plot Heat line + Show 0/±80 lines (only shows thresholds if Heat line is on).
Hot/Cold thresholds & transparency floors for background shading.
Push markers (PU/PD).
Heat score table : toggle on; choose any corner.
Tuning quick-starts
Daily trending equities : lookback 40–60; epsATR 0.10–0.25; gainBase 12–18; gainPerStreak 0.5–1.5; gainPer1ATRBrk 1–2; decayPct 3–6; adaptiveDecay ON (decayPerATR 0.5–0.8).
Intraday / noisy : raise epsATR and tickBuff to filter noise; keep decayPct modest so Heat can build.
Weekly swing : longer lookback/atrLen; slightly lower decayPct so regimes persist.
Alerts (included)
New window HIGH (push-up)
New window LOW (push-down)
Heat turned HOT (crosses above your Hot threshold)
Heat turned COLD (crosses below your Cold threshold)
Best practices & notes
Use QHI as a pressure gauge , not a standalone system—combine with your entry/exit plan and risk rules.
On thin symbols, increase epsATR and/or tickBuff to avoid spurious pushes.
Gap days can register large pushes; ATR scaling helps but consider context.
Want the Heat in a separate pane? Use the companion panel version; keep this overlay for background/box visuals.
Pine v6. Warm-up: values appear as soon as one bar of window history exists.
TL;DR
QHI quantifies how hard price is leaning on a consolidation edge.
It’s ATR-adaptive, streak- and magnitude-aware, and cools off intelligently when momentum fades.
Watch for thermals (background), the score (−100..+100), and fresh push alerts to time entries in the direction of pressure.

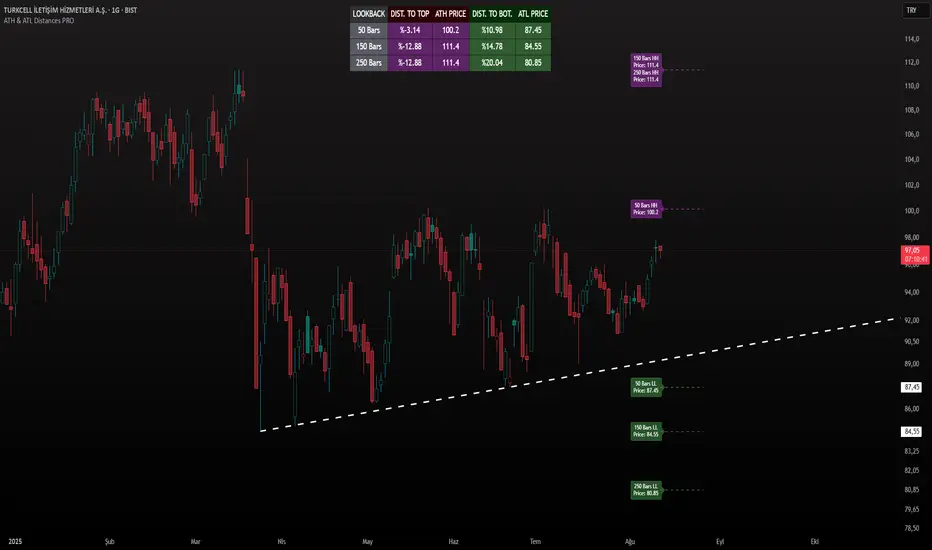
ATH & ATL Distances PROIndicator Description:
ATH & ATL Distances PROThis Pine Script indicator, built on version 6, helps traders visualize and monitor the percentage distances from the current closing price to the rolling All-Time High (ATH) and All-Time Low (ATL) over customizable lookback periods.
It's designed for overlay on your TradingView charts, providing a clear table display and optional horizontal lines with labels for quick reference.
This tool is ideal for assessing market pullbacks, rallies, or potential reversal points based on recent price extremes.
Key Features:
Customizable Lookbacks: Three adjustable periods (default: 50, 150, 250 bars) to calculate short-, medium-, and long-term highs/lows.
Percentage Distances: Shows how far the current price is from ATH (negative percentage if below) and ATL (positive if above).
Visual Aids: Optional dashed lines for ATH/ATL levels extending a set number of bars, with grouped labels to avoid clutter if levels overlap.
Info Table: A persistent table summarizing lookbacks, distances, and prices, with color-coded cells for easy reading (red for ATH/dist to top, green for ATL/dist to bottom).
User Controls: Toggle rows, lines, table position, and colors via inputs for a personalized experience.
How It Works (Logic Explained):
The script uses TradingView's built-in functions like ta.highest() and ta.lowest() to find the highest high and lowest low within each lookback period (capped at available bars to handle early chart data). It then computes:Distance to ATH: ((close - ATH) / ATH) * 100 – Negative values indicate the price is below the high.
Distance to ATL: ((close - ATL) / ATL) * 100 – Positive values show the price is above the low.
Unique ATH/ATL prices across lookbacks are grouped into arrays to prevent duplicate lines/labels; if prices match, labels concatenate details (e.g., "50 Bars HH 150 Bars HH").
Drawings (lines and labels) are efficiently managed by redrawing only on the latest bar to optimize performance. The table updates in real-time on every bar close.How to Use:Add the indicator to your chart via TradingView's "Indicators" menu (search for "ATH & ATL Distances PRO").
Customize inputs:
Adjust lookback periods (1-1000 bars) for your timeframe (e.g., shorter for intraday, longer for daily/weekly).
Enable/disable lines, rows, or change colors/table position to suit your setup.
Interpret the table:
"DIST. TO TOP" (red): Percentage drop needed to reach ATH – useful for spotting overbought conditions.
"DIST. TO BOT." (green): Percentage rise from ATL – helpful for identifying support levels.
If lines are enabled, hover over labels for details on which lookbacks share the level.
Best on any symbol/timeframe; combine with other indicators like RSI or moving averages for confluence.
This script is open-source and free to use/modify. No external dependencies – it runs natively on TradingView. Feedback welcome; if you find it useful, a like or comment helps!
Enhanced 4H Candle Countdown & High/Low IndicatorBy profitgang
This Pine Script indicator provides real-time tracking of 4-hour timeframe levels with an integrated countdown timer, designed to help traders monitor key support and resistance zones.
Key Features
📊 Visual Elements
4H High/Low Lines: Clear visualization of previous 4-hour candle high and low levels
Range Fill: Subtle background fill between high and low for better context
Mid-Level Line: Shows the middle point of the 4H range
Position Indicator: Visual cue showing current price position within the range
⏰ Countdown Timer
Real-time countdown to next 4H candle close
Customizable table position (9 different locations)
Adjustable text size (6 size options from Tiny to Huge)
Distance calculations showing percentage distance from key levels
🎯 Signal Generation
Long signals when price crosses above 4H low
Short signals when price crosses below 4H high
RSI confluence filter to reduce false signals
Background highlighting for active signals
TradingView alerts compatible
⚙️ Customization Options
Toggle all features on/off independently
Custom colors for all elements
Table positioning (top/middle/bottom + left/center/right)
Text size selection for optimal readability
Alert notifications for level breaks and updates
How It Works
The indicator fetches the previous 4-hour candle's high and low values and displays them as horizontal lines on your current timeframe chart. It continuously calculates the time remaining until the current 4H candle closes and presents this information in a clean, customizable table.
Use Cases
Swing Trading: Identify key 4H support and resistance levels
Intraday Trading: Monitor when new 4H levels will be established
Risk Management: Calculate distance from key levels for position sizing
Multi-timeframe Analysis: Combine with lower timeframe setups
Educational Purpose
This indicator is designed for educational and analytical purposes to help traders understand price action relative to higher timeframe levels. It provides clear visual feedback about market structure and timing.
Settings Groups
Display Settings: Toggle features, positioning, and sizing
Colors: Customize all visual elements
Signal Settings: Configure alert conditions and confluence filters
Compatibility
Works on all timeframes (recommended for 1m to 1H charts)
Compatible with all instruments
Includes proper alert functionality for automated notifications
Optimized for both light and dark themes
This indicator does not provide financial advice. Always conduct your own research and risk management before making trading decisions.

Previous Day High/Low Levels [OWI]📘 How to Use the “Previous Day High/Low Levels ” Indicator
This TradingView indicator automatically tracks and displays the previous day's high and low during the Regular Trading Hours (RTH) session. It’s perfect for traders who want to visualize key support/resistance levels from the prior day in futures like CME_MINI:NQ1! and COMEX:GC1! .
🛠 Setup Instructions
1. Customize RTH Session Times
- In the Settings panel, adjust the following under the Levels group:
- RTH Start Hour and RTH Start Minute: Default is 9:30 AM (New York time).
- RTH End Hour and RTH End Minute: Default is 4:15 PM.
- These define the active trading session used to calculate the day’s high and low.
2. Toggle Labels
- Use the Show PDH/PDL Labels checkbox to display or hide the “PDH” and “PDL” labels on the chart.
- Labels appear after the session ends and follow price dynamically.
📊 What the Indicator Does
- During the RTH session:
- Tracks the highest and lowest price of the day.
- After the session ends:
- Draws horizontal lines at the previous day’s high (green) and low (red).
- Optionally displays labels ("PDH" and "PDL") at those levels.
- Lines extend into the current day to help identify potential support/resistance zones.
✅ Best Practices
- Use this indicator on intraday timeframes (e.g., 5m, 15m, 1h) for best results.
- Combine with volume or price action analysis to confirm reactions at PDH/PDL levels.
- Adjust session times if trading non-US markets or custom hours.

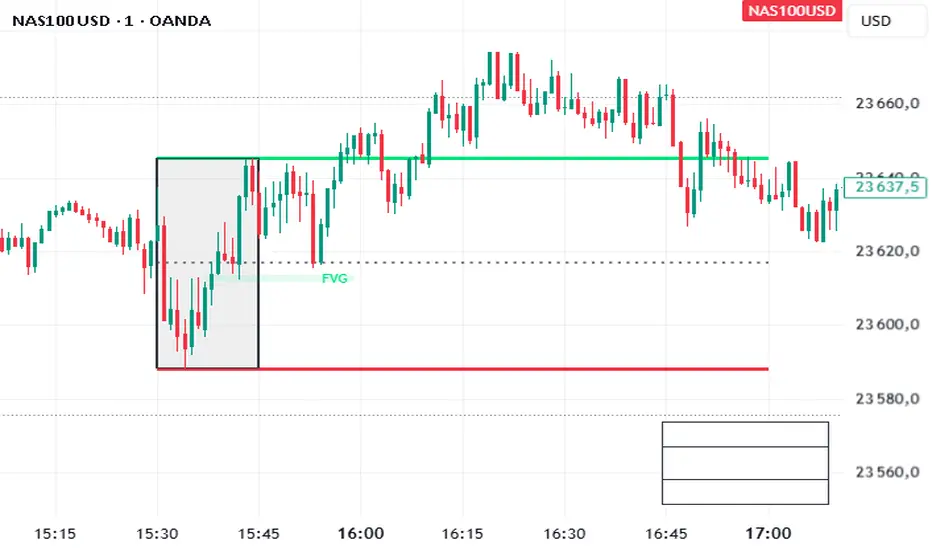
OPR — DAX or USEnglish
This indicator automatically plots the Opening Price Range (OPR) for different indices, with customizable start and end times for each instrument.
For the DAX, it draws the high (green), low (red), and midline (grey dotted) for the specified range, defaulting to 09:00–09:15, and extends the lines until the selected end time (default 11:00).
For US indices (Dow Jones, Nasdaq, S&P500), it applies the same logic for the default 15:30–15:45 range, with two vertical black bars marking the start and end of the time window.
Each symbol only displays its own relevant lines (e.g., viewing DAX will only show DAX markers).
Parameters allow adjusting times and visibility for each market.
Two Dot Closed 5ma VarianceThe concept behind this indicator is I have worked with a 5 simple moving average for a very long time. More significantly I changed the mode of the ma from a line to a DOT format. While price action moves upward the 5 MA stretches its values between bars, doing the same as it moves down. This becomes so much more obvious in DOT format. It is the turning points of direction where the variance between the DOTS of the 5 MA closes. Flattening the DOTS!
I created this indicator for XAUUSD 30 minute chart. Do with as you see fit. The indicator has a function that you can assign a MAX and MIN variance of the 5 MA right down to 0.10 cents. If closing value of 5 MA is within your set amount an ALERT is given. The actual variance is given in the leading flag and is of the prior 2 closed values.
