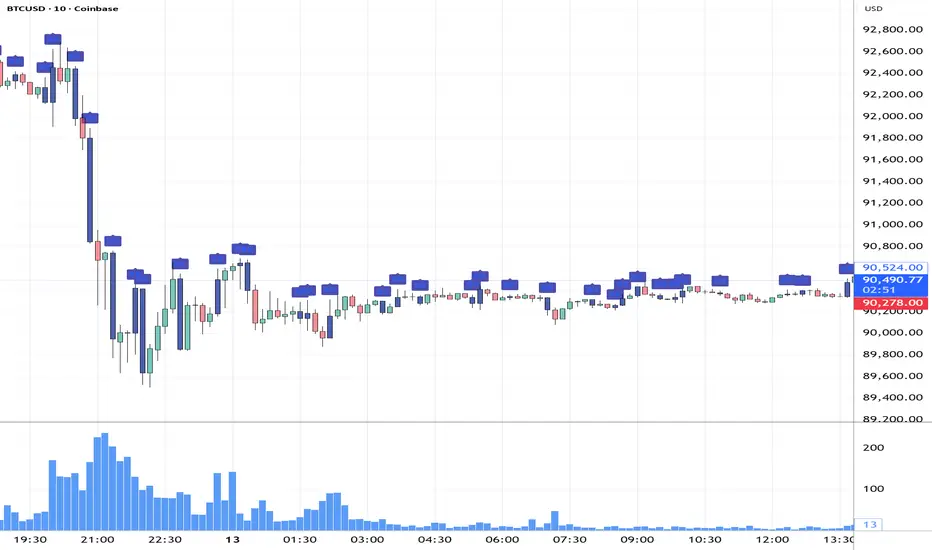
Impulse %Impulse % — Liquidation Cascade Detector (BTC · 1H)
Impulse % identifies sharp impulsive price moves and liquidation cascades by measuring how much a candle’s range deviates from its historical average in percent.
How it works
Calculates the candle range (in %) relative to price and compares it to the average over N periods.
When the range exceeds the upper band, an Impulse is detected.
Inside each 1H candle, the indicator checks lower timeframes (1m / 5m) to classify the impulse phases:
PANIC — the first minutes of a violent move (forced liquidations, stop hunts).
CAUTION (Cascade) — continuation and “cleanup” phase with elevated risk.
Determines whether the impulse is against the trend using EMA 50 / EMA 200 — the most dangerous scenario.
Highlights risk zones to protect positions and filter new entries.
What it’s for
Avoid entering during liquidation cascades.
Exit at break-even or partially take profit during risky phases.
Recommended Settings — BTC (1H)
Calculation
Calculation TF: (empty = current)
Average Mode: By N bars
N (bars): 100
Range Type: High–Low
Bands
Upper Band (% of average): 130
Lower Band: Auto (same %)
Cascade (First Minutes)
Enable Cascade Filter: ON
When to trigger safety: Only against trend
PANIC (minutes): 3
CAUTION (minutes after PANIC): 15
Trend (EMA)
Use EMA Trend: ON
Fast EMA: 50
Slow EMA: 200
Lower TF Detection
Lower TF: 1m (or 5m if you prefer smoother signals)
Visualization
Style: Columns
Show Bands: ON
Show Band Lines & Mean: ON
How to read it (BTC · 1H)
Purple (PANIC): first minutes of liquidation — do not enter.
Yellow (CAUTION): cascade phase — high risk, manage/exit.
Normal color: no active cascade — strategy allowed.
Best practice:
1m/5m → real-time cascade detection
1H → decision level
4H → market context
Candlestick analysis

Trend zooming boxThis script clearly find trend.
You will be able to find areas where you get large impulsive moves in history easily. Not too much to describe.

Victor aimstar past strategy -v1Introducing the ultimate all-in-one DIY strategy builder indicator, With over 30+ famous indicators (some with custom configuration/settings) indicators included, you now have the power to mix and match to create your own custom strategy for shorter time or longer time frames depending on your trading style. Say goodbye to cluttered charts and manual/visual confirmation of multiple indicators and hello to endless possibilities with this indicator.
What it does
==================
This indicator basically help users to do 2 things:
1) Strategy Builder
With more than 30 indicators available, you can select any combination you prefer and the indicator will generate buy and sell signals accordingly. Alternative to the time-consuming process of manually confirming signals from multiple indicators! This indicator streamlines the process by automatically printing buy and sell signals based on your chosen combination of indicators. No more staring at the screen for hours on end, simply set up alerts and let the indicator do the work for you.

Nooner's Heikin-Ashi/Bull-Bear CandlesCandles are colored red and green when Heikin-Ashi and Bull/Bear indicator agree. They are colored yellow when they disagree.

Scalping EMA + Pinbar Strategy (London & NY only, BE @ 1R)The scalping trading system uses two types of indicators:
EMA 10, EMA 21, EMA 50
Pinbar Indicator
Rules for entering a buy order:
If the closing price is above the EMA 50, the trend is uptrend and only buy orders should be considered.
The EMA 10 and EMA 21 lines must simultaneously be above the EMA 50.
The price must correct down at least 50% of the area created by the EMA 10 and EMA 21, or correct further down.
A Type 1 Pinbar candle (marked by the Pinbar indicator) must appear; this Pinbar candle must react to at least one of the three EMA lines (EMA 10, EMA 21, EMA 50) and close above the EMA 50.
This Pinbar candle must have a Pinbar strength value (marked by the Pinbar indicator) less than 2 to be considered valid. Check if the closing price of this pinbar candle is higher than the 50-day EMA and if the 10-day and 21-day EMAs are also higher than the 50-day EMA. If so, the conditions have been met and you can begin trading.
Place a buy stop order 0.1 pip higher than the highest price of the pinbar candle, and a stop loss order 0.1 pip lower than the lowest price of the pinbar candle. Set the take profit at 3R.
If the price moves past the previously set stop loss, cancel the pending order.
When the price moves 1R, move the stop loss back to the entry point.
The next trade can only be executed after the previous trade has moved the stop loss back to the entry point.
Rules for placing sell orders:
If the closing price is below the 50-day EMA, the trend is bearish, and only sell orders should be considered. The 10-day and 21-day EMAs must both be below the 50-day EMA.
The price must correct downwards by at least 50% of the area formed by the 10-day and 21-day EMAs, or even further.
A Type 1 pinbar candle (marked by the Pinbar indicator) must appear. This pinbar candle must react to at least one of the three EMAs (EMA 10, EMA 21, EMA 50) and close below the EMA 50.
This pinbar is valid if its strength (indicated by the Pinbar indicator) is less than 2. Verify that the closing price of this pinbar candle is below the EMA 50 and that both the EMA 10 and EMA 21 are below the EMA 50. If all conditions are met, the trade can be executed.
(This appears to be a separate entry rule and not part of the previous text.) Place a sell stop order 0.1 pip below the lowest point of the pinbar candle, and a stop loss order 0.1 pip above the highest point of the pinbar candle. Set the take profit point at 3R.
If the price moves past the previously set stop-loss point, cancel the pending order.
When the price moves 1R, move the stop-loss point back to the entry point.
The next trade can only be executed after the previous trade has moved the stop-loss point back to the entry point.

ICT Macro Tracker - Study Version (Original by toodegrees)This indicator is a modified study version of the ICT Algorithmic Macro Tracker by toodegrees, based on the original open-source script available at The original indicator plots ICT Macro windows on the chart, corresponding to specific time [ periods when the Interbank Price Delivery Algorithm undergoes checks/instructions (aka "macros") for the price engine to reprice to an area of liquidity or inefficiency.
This study version adds functionality to hide bars outside macro periods. When enabled, the indicator draws boxes that cover the full chart height during non-macro periods, obscuring those bars so only macro periods are visible. This helps focus on macro-only price action. The feature is configurable, allowing users to enable or disable it and customize the box color. All original functionality remains intact.


NQ 300+ Point Day Checklist (Bias + Alerts + Markers)This indicator helps identify high-range (≥300-point) days on Nasdaq-100 futures (NQ / MNQ) using a clear, rule-based checklist.
It evaluates volatility, compression, price displacement, prior-day structure, and overnight activity to generate a daily expansion score (0–6). Higher scores signal an increased likelihood of a strong trending or expansion day.
The script also provides:
Expansion probability levels (Normal / Watch / High-Prob)
Bullish, bearish, or neutral bias
On-chart markers and background highlights
Optional alerts for early awareness
Best used on the Daily timeframe to help traders focus on high-opportunity days and avoid overtrading during consolidation.
This is a context and probability tool — not a trade signal.

E-MasterE-Master v2.5.2 is an internal development build created for structural testing and layout consistency experiments.
This script was not designed for practical trading use and is currently maintained only to observe how different visual components behave under various chart conditions. The calculations, filters, and outputs are incomplete, unoptimized, and may change without notice.
The indicator may produce irregular visuals, unclear states, or seemingly redundant information. Interpretation is intentionally non-intuitive and may not align with standard technical analysis practices.
E-Master does not generate actionable signals, trade recommendations, or reliable confirmations. Any apparent patterns or reactions should be considered coincidental and unsuitable for decision-making.
Due to its experimental nature, this tool may behave inconsistently across symbols, timeframes, or market environments. Users are strongly discouraged from relying on it for analysis, execution, or strategy development.
This script exists solely for testing, debugging, and exploratory purposes during ongoing development.

CHOP-O-METER - Multi-Factor Choppiness DetectorA composite indicator that quantifies market choppiness using four independent measurements, helping you identify when to trade trends vs. when to sit out or fade moves.
━━━━━━━━━━━━━━━━━━━━━━━━━━━━━━━━━━━━━━━━
HOW IT WORKS
The Chop-O-Meter combines four normalized components (each scaled 0-100) into a single weighted score:
1. Price Efficiency (Kaufman-style)
Measures how efficiently price moved from point A to B. If price travels far but nets little distance, efficiency is low = high chop.
2. Direction Change Frequency
Counts how often price direction flips within the lookback period. More flips = more chop.
3. Mean Reversion Intensity
Tracks how often price crosses its moving average. Frequent crosses indicate a ranging, choppy market.
4. ATR Expansion Ratio
Compares the sum of individual bar ranges to the total period range. High ratio means lots of movement within a tight overall range = chop.
━━━━━━━━━━━━━━━━━━━━━━━━━━━━━━━━━━━━━━━━
READING THE INDICATOR
Above 65 (Red Zone): High chop — avoid trend-following, consider mean-reversion or staying flat
Below 35 (Green Zone): Trending — momentum strategies more likely to succeed
35-65 (Orange): Transitional/uncertain regime
━━━━━━━━━━━━━━━━━━━━━━━━━━━━━━━━━━━━━━━━
SIGNALS
🔻 Green triangle (top): Chop breaking down — potential trend starting
🔺 Red triangle (bottom): Trend exhausting — chop may be returning
━━━━━━━━━━━━━━━━━━━━━━━━━━━━━━━━━━━━━━━━
SETTINGS
Lookback Period: Number of bars to analyze (default 20)
Component Weights: Adjust influence of each factor
Thresholds: Customize high/low chop boundaries
Show Components: Toggle individual factor plots for debugging
━━━━━━━━━━━━━━━━━━━━━━━━━━━━━━━━━━━━━━━━
USE CASES
Filter out trend trades when chop score is high
Reduce position size in choppy regimes
Switch between mean-reversion and momentum strategies
Identify regime transitions early
━━━━━━━━━━━━━━━━━━━━━━━━━━━━━━━━━━━━━━━━
ALERTS INCLUDED
Entering High Chop
Entering Trend
Chop Breaking Down

Ahmed Gold Signals - 5M LIVE (Frequent)📈 Gold (XAUUSD) Trading Signals – Precision-Based Strategy
Our Gold signals are built on pure price action, not random indicators or guesswork.
🔍 How our signals are generated
We focus on:
🧲 Liquidity Sweeps
Identifying when price grabs stop-losses above highs or below lows and then reverses
📊 Clear trend direction using EMA 50 & EMA 200
✅ Strong confirmation candles after the sweep
🎯 Entries only in the direction of the trend to increase accuracy
🔵 BUY Signals
Bullish market structure
Price sweeps liquidity below recent lows
Strong bullish confirmation candle closes
➡️ High-probability BUY setup
🔴 SELL Signals
Bearish market structure
Price sweeps liquidity above recent highs
Strong bearish confirmation candle closes
➡️ High-probability SELL setup
⏱️ Timeframe
5-minute chart (5M)
Fast, precise signals ideal for scalping Gold
🛡️ Risk Management
Stop loss placed beyond the liquidity sweep
Clear take-profit targets
Risk-to-reward typically 1:2 or better
⚠️ Important Notes
We do not trade every move
We wait for confirmation
Quality over quantity — always

Al Brooks - Bar CountIndicator Purpose:
This indicator displays bar counts on the chart to help traders identify important time nodes and cycle transitions
Features smart session filtering with automatic futures/stock detection and appropriate trading session counting
Core Features:
Smart asset detection: Auto-detect futures and stocks
Session filter toggle: Choose all-day or session-specific counting
Auto timezone handling: Chicago time for futures, NY time for stocks
Flexible display control: Customizable display frequency and label size
Session Settings:
8:30-15:15 (CT) / Futures mode: Chicago time 8:30-15:15 (CT)
9:30-16:00 (ET) / Stock mode: New York time 9:30-16:00 (ET)
All-day mode: Count from first bar of the day
Timeframe Correspondence:
Multiples of 3: Correspond to 15-minute chart update cycles
Multiples of 12: Correspond to 1-hour chart update cycles
18: Key nodes, important time turning points

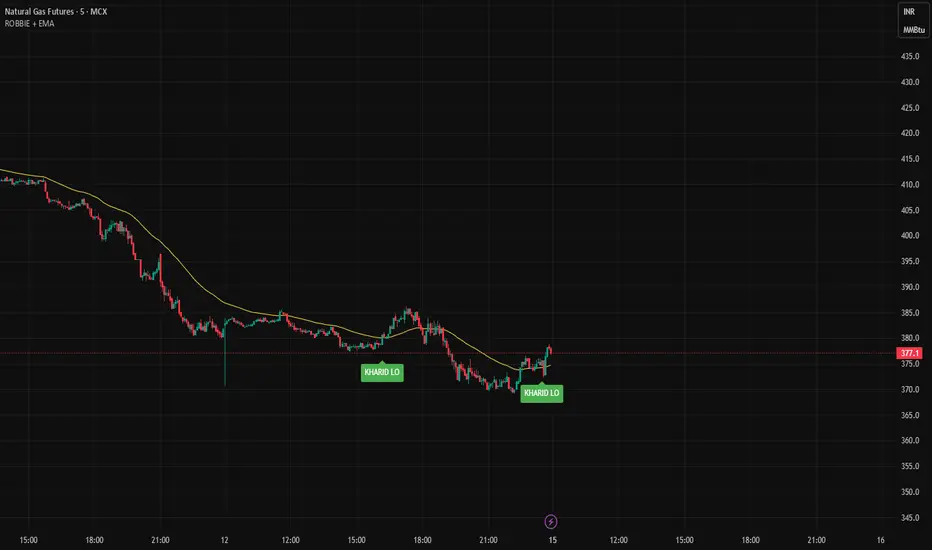
ROBBIE + EMA1️⃣ Purpose
This indicator identifies Knoxville Divergence signals (Rob Booker method) while filtering trades according to trend using an EMA.
Bullish signal: Price shows divergence and is above EMA → buy bias.
Bearish signal: Price shows divergence and is below EMA → sell bias.
It combines price pivots, RSI divergence, momentum, and EMA trend for higher-probability signals.
2️⃣ Key Components
a) Inputs
rsiLength → Period for RSI (default 14)
momLength → Period for Momentum (default 10)
pivotLen → Lookback for pivot detection (default 5)
emaLength → EMA period for trend filter (default 50)
b) Pivot Detection
ta.pivotlow() → detects price and RSI lows
ta.pivothigh() → detects price and RSI highs
Only pivots confirmed after pivotLen bars are used for divergence logic.
c) Knoxville Divergence Logic
Bullish Divergence:
Price forms a lower low
RSI forms a higher low
Momentum > 0
Price above EMA (trend confirmation)
Bearish Divergence:
Price forms a higher high
RSI forms a lower high
Momentum < 0
Price below EMA (trend confirmation)
Robbie BhaiyaMy first indicator. I would like to create something which gives you realtime buy and sell signal.

EMA Market Regime & Real-Time Candle Projection System📌 EMA Market Regime & Real-Time Candle Projection System
EMA Market Regime & Parabolic Projection is a real-time market structure system designed to anticipate candle behavior before it fully forms, by dynamically projecting price levels based on trend strength, acceleration, and market expansion.
Unlike traditional indicators that react after the candle closes, this system continuously adapts to live price data to provide early insight into bullish, bearish, parabolic, and exhaustion phases.
🔍 Core Concept
The system operates on four key dimensions:
Market Structure
Uses a fast and a slow EMA to determine the dominant market regime (bullish or bearish).
Directional Momentum
Measures EMA slope to confirm directional commitment.
Acceleration & Parabolic Detection
Identifies true parabolic movements through acceleration analysis, filtering out weak or range-bound price action.
Expansion Validation
Confirms that movements are supported by genuine market expansion, reducing false signals.
By combining these elements, the indicator projects a dynamic price level in real time, effectively drawing a forward-looking guide that adapts as each candle evolves.
🧠 Real-Time Candle Projection
The projected line represents a dynamic equilibrium level derived from EMA structure and acceleration.
This allows traders to:
Anticipate continuation vs exhaustion
Visualize momentum shifts before candle close
Read potential candle direction and strength in real time
The projection is non-repainting and updates tick-by-tick during the candle’s formation.
🎯 Market Regime Classification
The system automatically classifies the market into distinct states:
Bullish Trend – Positive structure with controlled momentum
Bearish Trend – Negative structure with controlled momentum
Parabolic Expansion – Accelerated trend with strong continuation potential
Parabolic Exhaustion – Loss of acceleration signaling potential reversal or pullback
Neutral / Range – Low momentum and low expansion (no-trade zone)
Each state is visually encoded using subtle, professional coloring, ensuring price candles always remain the primary focus.
🛡️ Professional-Grade Filters
Anti-range and anti-fake breakout filtering
Cooldown logic to prevent repetitive signals
Slope normalization relative to volatility
Designed to remain readable on M1–M5 scalping and higher timeframes
⚙️ Designed For
Scalping & Intraday Trading
Real-time decision-making
Trend continuation & exhaustion timing
Prop-firm and professional trading environments
This system is intended as a market structure and timing tool, not a signal spam indicator.
⚠️ Disclaimer
This indicator does not predict the future and does not provide guaranteed results. It is designed to assist discretionary traders by improving real-time market reading and execution timing.

Daily Upper Wick 0.5 (Date Range)Appearance settings modified: Extend lines OFF, level color, Date Range filter, line thickness, Prices labeled and resized tiny, plot lines OFF.
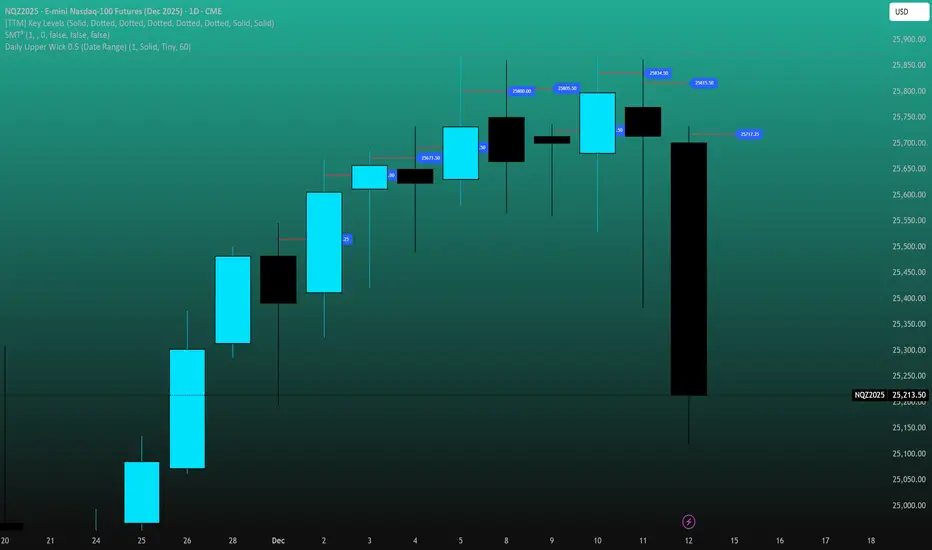
Daily Lower Wick 0.5 (Date Range)Appearance settings modified: Extend lines OFF, level color, Date Range filter, line thickness, Prices labeled and resized tiny, plot lines OFF.

Opening Range Breakout with VWAP & RSI ConfirmationThis indicator identifies breakout trading opportunities based on the Opening Range Breakout (ORB) strategy combined with intraday VWAP and higher timeframe RSI confirmation.
Opening Range: Calculates the high, low, and midpoint of the first 15 or 30 minutes (configurable) after your specified market open time.
Intraday VWAP: A volume-weighted average price calculated manually and reset daily, tracking price action throughout the trading day.
RSI Confirmation: Uses RSI from a user-selected higher timeframe (1H, 4H, or Daily) to confirm signals.
Buy Signal: Triggered when VWAP breaks above the Opening Range High AND the RSI is below or equal to the buy threshold (default 30).
Sell Signal: Triggered when VWAP breaks below the Opening Range Low AND the RSI is above or equal to the sell threshold (default 70).
Visuals: Plots Opening Range levels and VWAP on the chart with clear buy/sell markers and optional labels showing RSI values.
Alerts: Provides alert conditions for buy and sell signals to facilitate timely trading decisions.
This tool helps traders capture momentum breakouts while filtering trades based on momentum strength indicated by RSI.

Ichimoku + VWAP + OBV + ATR Full System (NQ Daytrade)Extended Indicator Description
Ichimoku + VWAP + OBV + ATR Full System is a rule-based intraday trading indicator designed specifically for NQ day trading, focusing on trend alignment, participation confirmation, and volatility-aware execution.
This indicator does not rely on a single signal or crossover. Instead, it integrates multiple market dimensions into one structured framework to help traders identify high-probability trend continuation scenarios while avoiding low-quality, range-bound conditions.
System Philosophy
The core idea of this system is simple:
trade only when trend, price location, volume, and volatility are aligned.
Each component plays a specific role and is not meant to be used in isolation. The indicator works best when all conditions reinforce the same directional bias.
Component Breakdown
Ichimoku Cloud
Used to define the primary market structure and directional bias. The system favors trades only when price action aligns clearly above or below the cloud, helping filter out indecisive or transitional phases.
VWAP
Acts as a session-based equilibrium reference. Price position and distance relative to VWAP are used to confirm whether the market is trending with intent rather than reverting to the mean.
OBV (On-Balance Volume)
Provides participation and flow confirmation. OBV helps validate whether price movement is supported by volume, reducing the likelihood of false breakouts or weak trend signals.
ATR (Average True Range)
Used as a volatility filter and risk-awareness tool. ATR conditions help the system avoid low-volatility environments and support more realistic expectations for intraday movement.
Trade Logic Overview
The system is designed around trend-following pullbacks, not prediction or counter-trend trading.
When trend structure is established and confirmed by VWAP positioning and OBV behavior, pullback zones within the trend become areas of interest. ATR conditions ensure that trades are taken only when sufficient movement potential exists.
Rather than generating frequent signals, the system prioritizes selectivity and clarity, making it suitable for disciplined day traders who value context over quantity.
Intended Use
This indicator is built for:
NQ intraday and day trading
Trend continuation and pullback strategies
Traders who prefer structured, confirmation-based systems
Lower to mid intraday timeframes such as 3-minute, 5-minute, and 15-minute charts
Important Notes
This is not an automated trading system and does not provide guaranteed results. The indicator is designed as a decision-support tool to assist with market context, directional bias, and trade timing. Risk management, execution, and position sizing remain the responsibility of the user.
롱/숏 삼각형 시그널
동그라미 청산 시그널
VWAP 밴드 기반 방향성
OBV 보조지표
이름 (Name)
BTC Scalping Signal – VWAP + OBV
짧은 설명 (Short Description)
VWAP 밴드와 OBV를 기반으로 방향성, 진입·청산 시그널을 제공하는 스캘핑 지표입니다.
긴 설명 (Long Description)
이 지표는 BTC 단기 스캘핑을 위해 설계된 것으로, 특히 15분봉 환경에 최적화되어 있습니다.
VWAP 밴드의 위치와 추세 판별 로직을 기반으로 롱·숏 진입 신호를 제공합니다.
OBV 모멘텀을 보조 필터로 사용하여 돌파 및 되돌림 가능성을 판단합니다.
시장 변동성이 축소되거나 평균회귀 신호가 감지될 때 청산 시그널을 표시합니다.
삼각형(진입), 원형(청산) 등 직관적 시각 요소를 통해 빠른 의사결정을 지원합니다.

Market + Direction + Entry + Hold + Exit v1.5 FINALIndicator Description
Market + Direction + Entry + Hold + Exit is a rule-based intraday trading indicator designed to identify high-quality trend opportunities while filtering out low-probability market conditions.
Instead of relying on a single signal, this indicator combines market activity, trend direction, momentum, structure, and pullback logic into one unified framework. It is built to support disciplined, rule-driven trading rather than discretionary or predictive approaches.
Core Logic
The indicator operates through a multi-layer confirmation process.
First, it evaluates whether the market is active enough to trade. Market activity is determined by volatility expansion, volume participation, and price displacement from VWAP. When sufficient activity is detected, the indicator allows trades to be considered.
Next, directional bias is defined using exponential moving averages and price positioning. This creates a clear long-only or short-only environment and helps avoid counter-trend trades.
Entry Structure
Entries are based on pullbacks within an established trend rather than breakout chasing.
The first valid pullback is marked as the initial entry. If the trend continues and additional controlled pullbacks occur, re-entry opportunities are identified and labeled sequentially. This structure helps traders scale into trends in a systematic and measured way.
Hold Confirmation
While a position is active, the indicator provides hold confirmation using momentum alignment and candle behavior. This is designed to help traders remain in strong trends and reduce premature exits during normal pullbacks.
Exit Logic
Exit signals appear only when two conditions align: market structure failure and clear trend weakening. This approach avoids exits based on minor price noise and focuses on objective trend invalidation.
Intended Use
This indicator is designed for intraday trading and scalping on indices, futures, and cryptocurrency markets. It performs best on lower to mid timeframes such as 3-minute, 5-minute, and 15-minute charts, where trend continuation and pullback behavior are most visible.
Asset Presets
Built-in presets are provided for NQ, Gold, and BTC. Each preset automatically adjusts internal parameters such as volatility thresholds, structure sensitivity, and trend strength filtering.
Important Notes
This indicator does not predict future price movements. It is a decision-support tool designed to help traders align with market conditions, manage entries systematically, and maintain consistency. Risk management, position sizing, and execution remain the responsibility of the user.
지표 설명
Market + Direction + Entry + Hold + Exit는 시장의 흐름이 명확한 구간에서만 거래 기회를 포착하도록 설계된 규칙 기반 인트라데이 트레이딩 지표입니다.
이 지표는 단일 신호에 의존하지 않고, 시장 활성도, 추세 방향, 모멘텀, 가격 구조, 되돌림 조건을 단계적으로 결합하여 낮은 확률의 구간을 걸러내는 데 초점을 둡니다. 예측보다는 정렬과 필터링을 통해 일관된 의사결정을 돕는 것이 목적입니다.
핵심 개념
지표는 여러 단계의 조건을 순차적으로 통과해야 신호를 생성하는 구조로 설계되어 있습니다.
먼저, 현재 시장이 거래하기에 충분히 활성화되어 있는지를 판단합니다. 변동성, 거래량, VWAP 대비 가격 이탈 정도를 기준으로 시장 상태를 평가하며, 일정 기준 이상일 때만 거래를 고려합니다.
이후, 이동평균과 가격 위치를 기반으로 추세 방향을 정의하여 롱 또는 숏 한 방향만 허용합니다. 이를 통해 역추세 진입을 자연스럽게 차단합니다.
진입 구조
진입은 돌파가 아닌 추세 내 되돌림을 기준으로 설계되어 있습니다.
첫 번째 유효한 되돌림 구간을 초기 진입으로 표시하며, 추세가 유지되는 동안 추가적인 되돌림이 발생할 경우 재진입 기회를 순차적으로 제공합니다. 이러한 구조는 감정적인 물타기가 아닌, 규칙 기반의 분할 진입을 가능하게 합니다.
홀드 신호
포지션 보유 중에는 모멘텀 정렬과 캔들 흐름을 통해 추세 지속 여부를 확인할 수 있습니다. 이를 통해 정상적인 조정 구간에서는 성급한 청산을 줄이고, 추세가 유지되는 동안 포지션을 안정적으로 관리할 수 있도록 돕습니다.
청산 로직
청산 신호는 가격 구조 붕괴와 추세 약화가 동시에 확인될 때만 발생합니다. 단기적인 노이즈에 의한 잦은 청산을 피하고, 추세가 객관적으로 무너지는 구간에 집중하도록 설계되었습니다.
활용 대상
이 지표는 인트라데이 트레이딩과 스캘핑에 적합하며, 지수, 선물, 암호화폐 시장에서 활용할 수 있습니다. 특히 3분, 5분, 15분 차트에서 추세와 되돌림 구조가 명확하게 나타나는 환경에서 효과적입니다.
자산 프리셋
NQ, Gold, BTC에 대해 사전 설정된 프리셋이 제공되며, 각 자산의 변동성과 특성에 맞게 내부 파라미터가 자동으로 조정됩니다.
유의 사항
본 지표는 가격의 미래를 예측하지 않습니다. 시장 환경을 정리하고 거래 판단을 보조하는 도구로서 사용되며, 손절 기준과 포지션 사이즈 관리는 사용자 책임입니다.

Daily contextThis indicator automatically marks the Previous Day’s High and Low, as well as the market’s midnight opening price.
These levels are updated at the start of each new trading day and remain visible throughout the entire session.
By providing key daily reference points, the indicator helps establish a clear market context and allows traders to immediately understand where price is positioned relative to the previous day’s range and the daily open.
