Smart Money Concepts with EMA + RSI - DrSafDescription
This indicator combines LuxAlgo’s Smart Money Concepts (SMC) framework with a trend and momentum confluence system.
Core Features:
Swing & internal BOS / CHoCH
Order blocks, fair value gaps, equal highs/lows
Premium & discount zones
Multi-timeframe high/low levels
Added Filters:
EMA 21 / 50 / 200 trend alignment
Optional RSI 50 momentum filter
Clear long/short signals based on:
Swing CHoCH
Higher-timeframe trend alignment
Momentum confirmation
Signal Logic
Long: Bullish CHoCH + EMA bullish structure + RSI confirmation
Short: Bearish CHoCH + EMA bearish structure + RSI confirmation
Designed for non-repainting execution, clean chart structure or systematic trading.
Indicator plots EMA 21, EMA 50, and EMA 200 to define trend structure and dynamic support/resistance.
EMA 200: overall trend bias
EMA 21 and EMA 50: pullback support for high probability trend entries.
EMA 21/50 crosses highlight momentum shifts but are not intended as standalone entry signals.
License
Based on LuxAlgo Smart Money Concepts
CC BY-NC-SA 4.0 (Non-Commercial)
Motifs graphiques

FNO Signals: EMA 9/21 + VWAP + S/R Break + Bull/BearWhat the script does
Tracks EMA 9 & EMA 21 to define short-term bullish or bearish trend direction.
Uses VWAP as an intraday fair-value line to filter trades in the direction of dominant order flow.
Detects recent swing highs and lows as dynamic support and resistance, then marks breakout candles as potential Smart Money “Break of Structure” zones.
Marks only the first bull or bear candle of a leg, helping to spot the start of momentum moves instead of every single candle.
How to use it
Use on 5‑min or 15‑min F&O charts (index or stock futures).
Focus on:
“BOS BUY” when price breaks above last resistance while EMA 9 > EMA 21 and price is above VWAP.
“BOS SELL” when price breaks below last support while EMA 9 < EMA 21 and price is below VWAP.
“BULL/BEAR” markers to see where a new directional leg starts, then align trades with the dominant EMA+VWAP trend.

Harmonic Patterns [kingthies]Harmonic Patterns
This indicator scans price swings for classic X-A-B-C-D harmonic patterns and plots the structure plus a PRZ (Potential Reversal Zone) to help you frame areas where reactions are statistically more likely. It supports both bullish and bearish setups and can trigger alerts when a new D pivot confirms a pattern.
What it does
Builds a pivot-based swing map (ZigZag-style) using a configurable Pivot Length .
Evaluates the most recent 5 swing points (X, A, B, C, D) against harmonic ratio rules with a user-defined tolerance .
Detects: Gartley, Bat, Butterfly, Crab, Deep Crab, Cypher, Shark (loose) .
Draws the pattern legs (X-A-B-C-D), labels the detection with ratio readouts, and projects a PRZ using 3 target levels (derived from XA/BC logic per pattern).
Offers two rendering modes:
Best only : picks the closest match (lowest score) to reduce clutter.
Show all : plots every valid match (uses filled PRZ boxes to keep object usage under control).
PRZ (Potential Reversal Zone)
PRZ is built from three target levels and expanded into a zone.
Optional padding uses ATR (ATR multiplier) to widen/narrow the zone for volatility.
Display modes: Off, Box, Lines, Both .
Zones can be extended forward by a configurable number of bars to keep the area visible as price develops.
How to use
Start with Confirm only when D pivot forms enabled (recommended) to reduce false positives while patterns are still forming.
Adjust Pivot Length based on timeframe:
Lower values = more swings, more signals, more noise.
Higher values = cleaner structures, fewer signals.
Use Ratio Tolerance to control strictness:
Lower tolerance = fewer, higher-confidence matches.
Higher tolerance = more matches, potentially lower quality.
Treat harmonics as context , not a standalone entry system:
Look for confluence (HTF levels, structure, volume, momentum/RSI divergence, etc.).
Use your own confirmation and risk plan (invalidations beyond PRZ / beyond D).
Settings overview
Swings (Pivot ZigZag)
Pivot Length: pivot sensitivity.
Use Wicks: uses High/Low; if off, uses Close.
Max Stored Swings: limits stored pivots for performance/object control.
Harmonic Detection
Ratio Tolerance (%): allowed deviation around ideal ratios.
Confirm only when D pivot forms: reduces repaint-like behavior.
When multiple match: Best only vs Show all.
Pattern Filters enable/disable each pattern type.
PRZ
PRZ Display: Off / Box / Lines / Both.
PRZ Padding (ATR multiplier): volatility-adjusted zone padding.
PRZ Extend (bars): how far to project the zone.
Visuals
Draw Legs: draws X-A-B-C-D.
Show Pattern Label: prints pattern name, direction, ratios, and score.
Label Offset: shift label forward if you want more space.
Alerts
“Bullish/Bearish Harmonic (Any)” triggers on any detected pattern.
Per-pattern alerts are included for each supported pattern type.
Notes
This indicator is educational and intended to assist with pattern recognition and confluence mapping.
Harmonic patterns do not guarantee reversals—always manage risk and confirm with your own process.

SignalViper Recon [Lite]SignalViper Recon Lite — Confluence-Based Market State Summary
Recon Lite is a streamlined market analysis tool that evaluates momentum and trend conditions to identify alignment between key analytical factors. It provides a real-time dashboard summarizing market state, helping traders quickly assess whether conditions favor directional moves or suggest caution.
Core Concepts & Logic
Recon Lite evaluates two primary analytical dimensions:
Momentum Analysis (RSI-Based)
- Evaluates price momentum strength and direction
- Identifies acceleration, deceleration, and reversal potential
- Detects overbought/oversold extremes
Trend Analysis (ADX/DMI-Based)
- Measures trend strength regardless of direction
- Determines whether bulls or bears control directional movement
- Identifies weak, ranging, or strong trending conditions
When both dimensions align in the same direction, Recon Lite identifies confluence — a state where momentum and trend agree, historically associated with higher-probability directional moves.
Narrative Interpretation Layer
Rather than displaying raw indicator values, Recon Lite translates conditions into contextual descriptions:
- "RISING - Accelerating" — Momentum gaining strength
- "BEARISH - but weakening" — Trend losing steam
- "OVERBOUGHT" / "OVERSOLD" — Extreme conditions detected
- "Trend losing steam" — Warning of potential reversal
Signal Tracking & Target Awareness
When confluence is detected, Recon Lite can track the signal with ATR-based target levels:
- Stop Loss — Risk-defined exit level
- TP1 / TP2 — Reward targets at configurable R:R ratios
The dashboard displays real-time proximity to these levels, including warnings when approaching key thresholds.
Visual Outputs
Summary Dashboard
- Momentum state with directional context
- Trend state with strength assessment
- Active warnings when conditions conflict
- Confluence or tracking status
- Target proximity and outcome tracking
Chart Signals
- Visual markers when full confluence is detected
- Optional TP/SL level lines
How to Use Recon Lite
Recon Lite serves as a market context tool. Traders commonly use it to:
- Identify when momentum and trend align
- Understand current market state at a glance
- Track signal outcomes with defined risk levels
- Avoid entries during conflicting or weak conditions
About the Full SignalViper Suite
Recon Lite demonstrates the confluence-based approach used across the SignalViper indicator suite. The full Recon indicator evaluates seven proprietary analytical dimensions — including volume participation, structural proximity, divergence detection, and multi-timeframe alignment — for comprehensive market state analysis.
This free indicator represents only the most basic example of our patent-pending Recon technology. Experience the full power of multi-factor confluence analysis with the complete SignalViper suite.
Learn more at signalviper.com

Box Theory [Interactive Zones] PyraTimeThis script combines Nicholas Darvas’s "Box Theory" with modern Supply and Demand (Premium/Discount) concepts. It automatically identifies the most recent Swing High and Swing Low to delineate the current trading range.
The purpose of this tool is to visualize market structure and help traders identify when price is relatively expensive (Premium) or cheap (Discount) within a defined range.
Visual Guide: What You Are Seeing
The Box: Represents the active trading range defined by the most recent significant Swing High and Swing Low.
Red Zone (Premium): The top 25% of the range. Mathematically, prices here are considered "expensive" relative to the current structure.
Green Zone (Discount): The bottom 25% of the range. Prices here are considered "cheap" relative to the current structure.
Grey Zone (Equilibrium): The middle 50% of the range. This is the area of fair value where price often consolidates.
Dashed Line (EQ): The exact 50% midpoint of the range.
Tutorial: How to Trade Using This Indicator
Method 1: Mean Reversion (Range Trading) This method applies when the market is moving sideways.
Identify Structure: Wait for a box to form.
Wait for Extremes: Do not trade when price is in the middle (Grey/White area). Wait for price to enter the Red or Green zones.
Entry Trigger:
Shorts: When price enters the Red Zone, look for a rejection (wicks leaving the zone) or a lower timeframe breakdown. Target the EQ (Midline) as your first take profit.
Longs: When price enters the Green Zone, look for support formation. Target the EQ (Midline) as your first take profit.
Method 2: Trend Continuation (Breakouts) This method applies when the market is trending strongly.
Breakout: Monitor the alerts. A close outside the box indicates a potential shift in market structure.
Retest: After a breakout up, the old "Red Zone" (Resistance) often flips to become new Support. Wait for price to pull back to the top of the old box before entering.
Configuration Guide (Settings)
Pivot Left/Right Bars (Sensitivity):
Default (20/20): Best for Swing Trading. It filters out market noise and only draws boxes based on major structural points.
Lower (5/5): Best for Scalping. It will create smaller, more frequent boxes but increases the risk of false signals.
Zone Percentage:
Default (25%): Standard deviation for Supply/Demand zones.
Alternative (15%): Use this for "sniping" entries at the absolute extremes of the range.
Multi-Timeframe (MTF):
Enable "Use Higher Timeframe" to see Daily or Weekly ranges while trading on lower timeframes (like the 15m or 1H). This helps keep your intraday trades aligned with the major trend.
Technical Note on "Lag" This indicator uses Pivots to draw the box. A pivot is only confirmed after a certain number of bars have passed (the "Pivot Right Bars" setting).
Example: If "Pivot Right Bars" is set to 20, the box will update 20 bars after the actual high or low occurred. This is necessary to confirm that the point was indeed a Swing High/Low. Do not treat the box lines as predictive; they are reactive to confirmed structure.

SignalViper Recon LiteSignalViper Recon Lite — Confluence-Based Market State Summary
Recon Lite is a streamlined market analysis tool that evaluates momentum and trend conditions to identify alignment between key analytical factors. It provides a real-time dashboard summarizing market state, helping traders quickly assess whether conditions favor directional moves or suggest caution.
Core Concepts & Logic
Recon Lite evaluates two primary analytical dimensions:
Momentum Analysis (RSI-Based)
- Evaluates price momentum strength and direction
- Identifies acceleration, deceleration, and reversal potential
- Detects overbought/oversold extremes
Trend Analysis (ADX/DMI-Based)
- Measures trend strength regardless of direction
- Determines whether bulls or bears control directional movement
- Identifies weak, ranging, or strong trending conditions
When both dimensions align in the same direction, Recon Lite identifies confluence — a state where momentum and trend agree, historically associated with higher-probability directional moves.
Narrative Interpretation Layer
Rather than displaying raw indicator values, Recon Lite translates conditions into contextual descriptions:
- "RISING - Accelerating" — Momentum gaining strength
- "BEARISH - but weakening" — Trend losing steam
- "OVERBOUGHT" / "OVERSOLD" — Extreme conditions detected
- "Trend losing steam" — Warning of potential reversal
Signal Tracking & Target Awareness
When confluence is detected, Recon Lite can track the signal with ATR-based target levels:
- Stop Loss — Risk-defined exit level
- TP1 / TP2 — Reward targets at configurable R:R ratios
The dashboard displays real-time proximity to these levels, including warnings when approaching key thresholds.
Visual Outputs
Summary Dashboard
- Momentum state with directional context
- Trend state with strength assessment
- Active warnings when conditions conflict
- Confluence or tracking status
- Target proximity and outcome tracking
Chart Signals
- Visual markers when full confluence is detected
- Optional TP/SL level lines
How to Use Recon Lite
Recon Lite serves as a market context tool. Traders commonly use it to:
- Identify when momentum and trend align
- Understand current market state at a glance
- Track signal outcomes with defined risk levels
- Avoid entries during conflicting or weak conditions
About the Full SignalViper Suite
Recon Lite demonstrates the confluence-based approach used across the SignalViper indicator suite. The full Recon indicator evaluates seven proprietary analytical dimensions — including volume participation, structural proximity, divergence detection, and multi-timeframe alignment — for comprehensive market state analysis.
This free indicator represents only the most basic example of our patent-pending Recon technology. Experience the full power of multi-factor confluence analysis with the complete SignalViper suite.
Learn more at signalviper.com


RSI Swing + VWAP + EMA + Camarilla + PDH/PDL+CPRThis script provide the follwing -
1. Daily CPR level
2. Camarilla S3/R3
3. Previous Day High/Low (PDH/PDL)
4. Dynamic VWAP
5. Dynamic EMA 20/200
6. Dynamic RSi Swing
Dec 10
Release Notes
This script provide the follwing -
1. Daily CPR level
2. Camarilla S3/R3
3. Previous Day High/Low (PDH/PDL)
4. Dynamic VWAP
5. Dynamic EMA 20/200/36
6. Dynamic RSi Swing
Which is better: 36 EMA or 36 SMA for Support/Resistance?
✔ 36 EMA (Exponential Moving Average)
Better for intraday, short-term trading, scalping, and momentum trading.
Why?
Reacts faster to price.
Captures trend shifts early.
Works great when market is trending or volatile.
Most traders use EMA for dynamic support/resistance → works better because of crowd behavior.
Ideal for:
NIFTY, BANKNIFTY, FINNIFTY intraday | Options entries | Trend continuation trades.
Why 20 EMA is Important
The 20 EMA is one of the most widely used moving averages for intraday, swing, and positional trading because it captures short-term trend strength and momentum.
📌 20 EMA Works Best For
✔ Intraday trend identification
✔ Momentum continuation entries
✔ Dynamic support/resistance
✔ Quick reversal detection
✔ Options trading (NIFTY/BNF)
✔ Breakout & pullback trades
EMA 200 – Why It’s Extremely Important
The 200 EMA represents the long-term trend and is respected by:
Institutions
Algo systems
Big traders
Swing traders
Index traders
It acts like a major wall of support or resistance.
💡 What EMA 200 Tells You
✔ Long-term trend direction
Price above 200 EMA → Long-term uptrend
Price below 200 EMA → Long-term downtrend
✔ Strong trend reversal signals
When price crosses the 200 EMA on 15m/1h/1D charts → a deeper trend change is possible.
✔ Institutional support/resistance
Very powerful bounce/rejection zones
Many markets reverse exactly at 200 EMA
What is Previous Day High (PDH)?
The highest price the market reached in the previous trading session.
Why PDH is Important?
Acts as strong resistance
Breakout level for uptrend
Sellers often defend this zone
If broken with volume → strong bullish momentum
🔴 What is Previous Day Low (PDL)?
The lowest price the market reached in the previous trading session.
Why PDL is Important?
Acts as strong support
Breakdown level for downtrend
Buyers defend this level
If broken with volume → strong bearish trend
📌 How PDH/PDL Help in Intraday Trading
1️⃣ Range Breakout Trades
If price breaks PDH → bullish breakout (Buy CE)
If price breaks PDL → bearish breakdown (Buy PE)
What is Camarilla R3?
R3 = Resistance Level 3 in the Camarilla Pivot system.
Why R3 is important?
Acts as a major intraday resistance
Price often reverses from R3
If broken with force → strong uptrend starts
Many traders use R3 as a decision zone
Typical Market Behavior at R3
Rejection from R3 → Sell/PE opportunity
Break + Retest above R3 → CE opportunity
🔴 What is Camarilla S3?
S3 = Support Level 3 in the Camarilla Pivot system.
Why S3 is important?
Acts as a major intraday support
Buyers defend this zone
Breakdown of S3 → strong fall
S3 is often a bounce zone in the morning
Typical Market Behavior at S3
Bounce from S3 → Buy/CE opportunity
Break + Retest below S3 → PE opportunity
📌 Trader Logic: R3 & S3 Zones
⭐ 1. Range Reversal Strategy (Most Popular)
At R3 → Sell/PE
At S3 → Buy/CE
What is VWAP?
VWAP = Volume Weighted Average Price
It shows the average price at which most trading has happened during the day, based on both price and volume.
It resets every day at market open.
🔥 Why VWAP Is So Powerful?
VWAP is used by:
Institutions
Algo traders
Scalpers
Intraday traders
Dec 10
Release Notes
This script provide the follwing -
1. Daily CPR level
2. Camarilla S3/R3
3. Previous Day High/Low (PDH/PDL)
4. Dynamic VWAP
5. Dynamic EMA 20/200
6. Dynamic RSi Swing
3 hours ago
Release Notes
This script provide the follwing -
1. Daily CPR level
2. Camarilla S3/R3
3. Previous Day High/Low (PDH/PDL)
4. Dynamic VWAP
5. Dynamic EMA 20/200/36
6. Dynamic RSi Swing
Which is better: 36 EMA or 36 SMA for Support/Resistance?
✔ 36 EMA (Exponential Moving Average)
Better for intraday, short-term trading, scalping, and momentum trading.
Why?
Reacts faster to price.
Captures trend shifts early.
Works great when market is trending or volatile.
Most traders use EMA for dynamic support/resistance → works better because of crowd behavior.
Ideal for:
NIFTY, BANKNIFTY, FINNIFTY intraday | Options entries | Trend continuation trades.
Why 20 EMA is Important
The 20 EMA is one of the most widely used moving averages for intraday, swing, and positional trading because it captures short-term trend strength and momentum.
📌 20 EMA Works Best For
✔ Intraday trend identification
✔ Momentum continuation entries
✔ Dynamic support/resistance
✔ Quick reversal detection
✔ Options trading (NIFTY/BNF)
✔ Breakout & pullback trades
EMA 200 – Why It’s Extremely Important
The 200 EMA represents the long-term trend and is respected by:
Institutions
Algo systems
Big traders
Swing traders
Index traders
It acts like a major wall of support or resistance.
💡 What EMA 200 Tells You
✔ Long-term trend direction
Price above 200 EMA → Long-term uptrend
Price below 200 EMA → Long-term downtrend
✔ Strong trend reversal signals
When price crosses the 200 EMA on 15m/1h/1D charts → a deeper trend change is possible.
✔ Institutional support/resistance
Very powerful bounce/rejection zones
Many markets reverse exactly at 200 EMA
What is Previous Day High (PDH)?
The highest price the market reached in the previous trading session.
Why PDH is Important?
Acts as strong resistance
Breakout level for uptrend
Sellers often defend this zone
If broken with volume → strong bullish momentum
🔴 What is Previous Day Low (PDL)?
The lowest price the market reached in the previous trading session.
Why PDL is Important?
Acts as strong support
Breakdown level for downtrend
Buyers defend this level
If broken with volume → strong bearish trend
📌 How PDH/PDL Help in Intraday Trading
1️⃣ Range Breakout Trades
If price breaks PDH → bullish breakout (Buy CE)
If price breaks PDL → bearish breakdown (Buy PE)
What is Camarilla R3?
R3 = Resistance Level 3 in the Camarilla Pivot system.
Why R3 is important?
Acts as a major intraday resistance
Price often reverses from R3
If broken with force → strong uptrend starts
Many traders use R3 as a decision zone
Typical Market Behavior at R3
Rejection from R3 → Sell/PE opportunity
Break + Retest above R3 → CE opportunity
🔴 What is Camarilla S3?
S3 = Support Level 3 in the Camarilla Pivot system.
Why S3 is important?
Acts as a major intraday support
Buyers defend this zone
Breakdown of S3 → strong fall
S3 is often a bounce zone in the morning
Typical Market Behavior at S3
Bounce from S3 → Buy/CE opportunity
Break + Retest below S3 → PE opportunity
📌 Trader Logic: R3 & S3 Zones
⭐ 1. Range Reversal Strategy (Most Popular)
At R3 → Sell/PE
At S3 → Buy/CE
What is VWAP?
VWAP = Volume Weighted Average Price
It shows the average price at which most trading has happened during the day, based on both price and volume.
It resets every day at market open.
🔥 Why VWAP Is So Powerful?
VWAP is used by:
Institutions
Algo traders
Scalpers
Intraday traders

PyraTime FVG [Pro] | Smart Anchored Price ActionPyraTime FVG is a professional-grade institutional trading suite designed to declutter price action analysis. Unlike standard indicators that flood the chart with infinite zones, this tool uses a proprietary "Velcro" Anchoring Engine that physically snaps Fair Value Gaps (FVGs) and Order Blocks to the exact candle geometry.
This tool replaces 4 separate indicators (FVG, Market Structure, Order Blocks, and Trend Dashboard) with a single, performance-optimized Pine Script v6 script.
🎯 Key Features
1. The "Velcro" FVG Engine Most FVG indicators draw boxes that extend infinitely, making charts messy.
Smart Extension: Zones extend to the right but automatically "snap" and cut off the moment price mitigates (fills) them.
Precision Anchoring: Boxes are drawn from the exact wick/body limits of the originating candles—no floating pixels.
Mitigation Tracking: Mitigated zones are instantly dimmed and archived, keeping your chart clean for current price action.
2. Intelligent Structure Mapping (BOS & CHoCH) The script distinguishes between trend continuation and trend reversals:
BOS (Break of Structure): Marked with Dotted Lines. Signals that the current trend is healthy and continuing.
CHoCH (Change of Character): Marked with Solid Lines. Signals a potential major trend reversal (e.g., the first Lower Low after an uptrend).
3. Multi-Timeframe (MTF) Scanner A non-intrusive dashboard in the bottom-right corner scans the 1H, 4H, and Daily timeframes in real-time.
IN BULL GAP: Price is currently inside a Higher Timeframe Buying Zone.
IN BEAR GAP: Price is currently inside a Higher Timeframe Selling Zone.
CLEAR: No major HTF obstacles nearby.
📚 How to Trade With This Tool (Tutorial)
Step 1: Check the "Big Picture" Look at the MTF Scanner (Bottom Right).
If the 1H and 4H say "IN BEAR GAP" (Gold), you know the higher timeframe bias is Down. You should prioritize selling opportunities.
Step 2: Wait for Price to Visit a Zone On your current chart (e.g., 5m or 15m), wait for price to enter a Gold FVG (Resistance).
Note: The box will be bright gold. Once price touches it, the script will snap the box to that candle, confirming the test.
Step 3: Confirm with Structure Don't sell blindly. Wait for a CHoCH Label (Change of Character) to appear. This confirms that the short-term uptrend has broken and sellers are stepping in.
Step 4: Target the Opposing Zone Aim for the next unmitigated Teal FVG (Bullish Support) or Order Block below.
⚙️ Settings & Customization
Filter Small Gaps: Uses an ATR filter (default 0.5) to ignore insignificant noise. Increase to 1.0 for a cleaner "Swings Only" view.
Show Midpoint: Toggles a dotted 50% equilibrium line inside every active gap.
Visual Style: Fully customizable colors. Default scheme is PyraTime Desert Gold & Oasis Teal.

BK AK-Warfare Formations👑 BK AK-Warfare Formations — Form the pride. Take the high ground. Strike with wisdom. 👑
Built for traders who think like commanders: see the formation, plan the maneuver, execute the strike.
🎖️ Full Credit (Engine + Logic — Trendoscope)
Original foundation (Trendoscope Auto Chart Patterns):
The entire pattern engine (multi-zigzag scanning, pivot logic, trendline-pair validation, geometric classification, drawing framework, overlap handling, and pattern caps) is by Trendoscope—one of the best coders on TradingView and the creator of this indicator’s core.
I’m not rewriting his war machine. I’m upgrading the interface and tactical readability so you can see structure faster and act cleaner.
🧩 BK Enhancements (on top of Trendoscope)
Built for clarity under pressure:
Short-form formation tags so your chart stays readable (AC/DC/RC/RWE/FWE/CT/DT/etc.)
Label transparency controls (text + background), including separate controls for short labels
Hover tooltips (toggle): hover a label to see the full pattern name + bias (Bullish/Bearish/Neutral)
Alerts upgraded with bias + category filtering (Channel / Wedge / Triangle)
Pattern border extension (optional): extends the two boundary lines forward by N bars so the battlefield edges stay visible (not extending random zigzag legs)
Everything else remains Trendoscope’s architecture and detection logic.
🧠 What It Does
Auto-detects and labels:
Channels
AC — Ascending Channel
DC — Descending Channel
RC — Ranging Channel
Wedges
RWE / FWE — Rising/Falling Wedge (Expanding)
RWC / FWC — Rising/Falling Wedge (Contracting)
Triangles
ATC / DTC — Asc/Desc Triangle (Contracting)
ATE / DTE — Asc/Desc Triangle (Expanding)
CT — Converging Triangle
DT — Diverging Triangle
You get clean battlefield tags (short codes) and optional hover briefings (full name + bias) without clutter.
🧭 How It Detects (So You Know It’s Not Random)
Trendoscope’s engine does this in a disciplined sequence:
Multi-Zigzag Sweep
Multiple zigzag levels scan the same market from different swing sensitivities.
Pivot Structure Validation (5 or 6 pivots)
A formation is only valid when pivot sequencing produces a legit trendline pair.
Trendline-Pair Rules
Upper boundary anchors to pivot highs
Lower boundary anchors to pivot lows
Geometry is measured (parallel / converging / diverging) to classify channel vs wedge vs triangle
Optional quality filters reduce warped/low-quality shapes (bar ratio checks, overlap avoidance, max pattern caps)
You’re not getting “art.” You’re getting validated geometry.
⚙️ Core Controls (What You Actually Tune)
Zigzag length/depth per level: swing sensitivity (faster vs cleaner)
Pivots used (5 or 6): tighter vs broader structures
Error/Flat thresholds: tolerance + what qualifies as “flat”
Avoid overlap: prevents stacking junk on top of junk
Max patterns: keeps the chart from becoming noise
Label system: short codes, transparency, tooltips, bias visibility
Border extension: projects the structure edges forward for planning
🗺️ Read the Battlefield (Tactical Translation)
AC (Ascending Channel): trend carry; buy pullbacks to the lower wall, manage risk outside structure
DC (Descending Channel): late down-leg; watch for momentum shift + reclaim = tactical reversal zone
RWE (Rising Wedge): distribution bias; break + failed retest is where weakness shows
CT / DT (Triangles): compression → expansion; plan edges, not the middle
Structure is the map. Bias is the compass. Your risk plan is the sword.
🧑🏫 Mentor A.K. (Respect Where It’s Due)
A.K. is the discipline behind this project.
Patience. Clean execution. No gambling. No chasing.
His standard is in every choice: reduce noise, sharpen structure, force clarity.
This is why the labels are tight, the tooltips are direct, and the features serve execution—not ego.
🤝 Give Forward (The Code of the Camp)
If this indicator sharpens your edge:
Teach one trader how to read structure with discipline (not hype)
Share process, not just screenshots (entries, invalidation, management)
If you build on open work, credit loudly and improve responsibly
A king builds men. A lion builds courage. A camp survives because knowledge moves forward.
👑 King Solomon’s Standard
This is warfare—market warfare—so we move by wisdom, not emotion:
“By wise counsel you will wage your own war, and in a multitude of counselors there is safety.” — Proverbs 24:6
BK AK-Warfare Formations — where formation meets judgment, and judgment meets execution.
Gd bless. 🙏

Strat Structure Engine + Trapped TradersStrat Structure Engine + Trapped Traders – Detailed Description
This script identifies high-probability market structure patterns known as “The Strat” setups, specifically focusing on 3-bar → Failed 2, 2-bar → Failed 2, and Failed 2 → Failed 2 (“Dragon’s Tail”) sequences. It is designed to help traders visualize potential reversals, trapped traders, and exhaustion points directly on the chart, combining price action, volatility, and volume metrics to grade signal strength.
Key Features:
3-Bar → Failed 2 (Tiered Scoring):
Detects a 3-bar structure followed immediately by a strict Failed 2 bar.
Evaluates the setup using four criteria:
3-bar range relative to ATR
Failed 2 close position relative to the 3-bar midpoint
Failed 2 body-to-range ratio
Volume relative to recent average
Assigns a tier (A+, A, B, or —) to indicate reliability, giving traders a graded view of signal strength.
2-Bar → Failed 2 (A+ Only):
Identifies strict 2-bar structures immediately followed by a Failed 2 bar.
Uses a similar evaluation system as 3→F2 but filters only for the strongest A+ setups.
Highlights signals where price shows strong directional rejection and high probability for reversal.
Dragon’s Tail – Failed 2 → Failed 2:
Captures consecutive Failed 2 bars in opposite directions, a classic trapped-trader scenario.
Signals both bullish and bearish sequences on bar close, helping traders spot potential quick reversals.
How It Works:
Uses ATR to contextualize bar ranges and volatility.
Incorporates volume averaging to detect unusually high trading activity that validates the strength of a Failed 2 setup.
Strict bar evaluation ensures only fully-formed, confirmed patterns are labeled, reducing noise and false signals.
Optional labels and alerts allow traders to track these structures in real-time or on bar close.
Practical Trading Use:
Ideal for spotting short-term exhaustion points, trapped traders, and reversal zones.
Can be used alongside liquidity zones, VWAP, and fair value gaps to refine entries and exits.
Traders can focus on high-tier signals (A+ / A) for higher probability trades, while lower-tier signals (B) indicate caution or context setups.
Customization Options:
Toggle visibility for each pattern type (3→F2, 2→F2, F2→F2).
Adjust ATR length and volume average period for different instruments or timeframes.
Alerts are available for all major setups, enabling integration with automated monitoring or manual execution strategies.
Summary:
The Strat Structure Engine + Trapped Traders script combines price action structure, volatility, and volume analysis to visualize high-probability reversal setups. By highlighting both strict pattern confirmations and tiered reliability, it provides traders with actionable insight into potential turning points, trapped trader scenarios, and high-conviction market moves without relying on external scripts or assumptions.

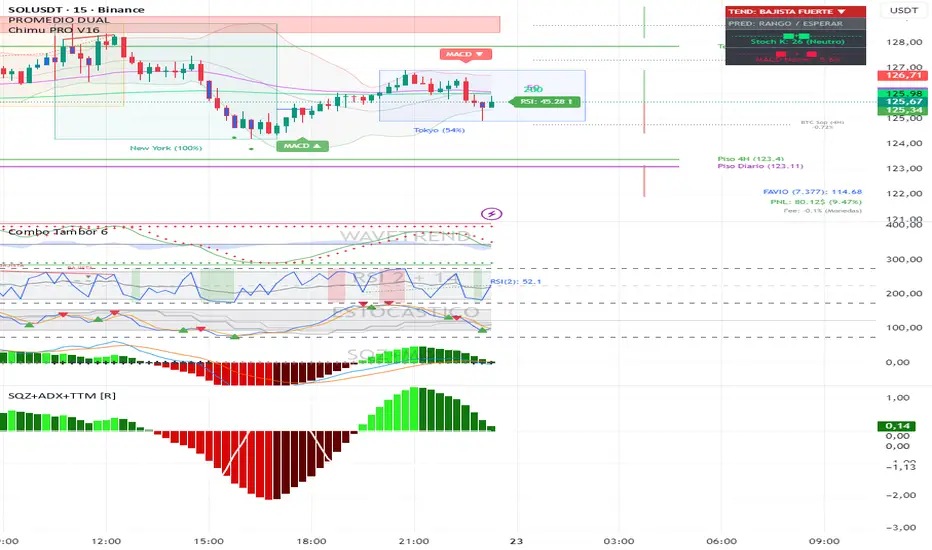
Squeeze + ADX + TTM [V6]Execution speed: The TradingView engine processes v6 scripts much faster.
Stability: By using standard functions like ta.sma or ta.linreg, the indicator is less prone to calculation errors on lower timeframes.
Clarity: I've reorganized the ADX calculation within a function to make it more readable if you decide to modify it later.
Price Range CHoCH Alert🎯 Smart Money Concept (SMC) indicator that monitors a specific price level and alerts only when price touches that level AND
subsequently creates a Change of Character (CHoCH).
Key Features:
• Set a custom price level to monitor
• Detects CHoCH/BOS based on pivot highs/lows
• Alerts ONLY when: Price touches level → CHoCH occurs
• Visual confirmation with level line and status table
• Configurable tolerance for precise level targeting
• Works for both bullish and bearish scenarios
Perfect for:
✓ Institutional level trading
✓ Key support/resistance breakouts
✓ Liquidity grab confirmations
✓ Structure break validation
Simply set your target price level and let the indicator watch for the perfect SMC setup!

The Strat Candle Labels & Color Inc F2D F2UThis script uses TheStrat candle numbers 1, 2D, 2U, 3 and places the text below or above. I have also now added the Failed 2D/2U labels. You can also change the text size. This also allows you to change the colors of the candles with two options for the 1 & 3 so you can color them in the direction they are going. For example a 1 that is green can be green and a 1 that is red can be red.

ICT ORB Killzones by MaxN (15 / 30m)Trading session open/close with first 15/30 min orbs
will just have to adjust time zones to your current time line
GMT +0
I use
Asia 23.00 - 06.00
London 07.00 - 16.00
New York 12.00 - 22.00

Swing HelperThis script, titled "Swing helper", is a multi-metric dashboard designed to provide a comprehensive snapshot of a security's volatility, relative volume, and price action health directly on the chart. It focuses on Average Daily Range (ADR) relationship and key performance indicators to help traders identify setups like volatility contractions or trend strength.
Key Features
Dual-ADR Analysis: Calculates and compares Long-Term (LT) and Short-Term (ST) ADR percentages. The ADR Ratio helps identify when volatility is expanding or contracting relative to historical norms.
Relative Volume (RVol): Compares current volume to a 20-day moving average, highlighting institutional participation.
Dynamic Closing Range: Visualizes where the price is closing relative to the day's true range (the "Closing Range %"), indicating buying or selling pressure.
SMA 50 Distance: A unique metric that measures the price's distance from the 50-day Simple Moving Average in "ADR units," helping to gauge how overextended a stock is.
Automated Price Projections: Dynamically plots -1x and -2x ADR levels from the current price to provide immediate downside targets or support levels.
Custom Bar Coloring: Highlights specific price action patterns:
Inside Days (Blue)
Upside Reversals (Green)
Downside Reversals (Red)
Visual Customization
The script includes a highly flexible Summary Table with customizable positions, sizes, and colors (including borders and headers), allowing it to fit into any dark or light mode chart layout without obstructing price action.
How to Use
Volatility Contraction: Watch for the ADR Ratio to drop, indicating a tightening range before a potential breakout.
Relative Strength: Look for high RVol combined with a high Closing Range % (e.g., >75%) to confirm strong demand.
Mean Reversion: Use the SMA50 Dist metric to identify when a stock is "stretched" too far from its moving average relative to its daily volatility.

BK AK-Flag Formations🏴☠️ BK AK-Flag Formations — Raise the standard. Drive the line. Continue the assault. 🏴☠️
Built for traders who exploit momentum with discipline: flagpoles, flags, and pennants detected, tagged, and briefed—so you press advantage instead of hesitating.
🎖️ Full Credit (Engine + Logic — Trendoscope)
Original foundation (Trendoscope Flags & Pennants):
The entire detection engine—multi-zigzag swing extraction, pivot logic, pattern validation, classification framework, and drawing architecture—is Trendoscope. He’s the architect of the core system.
I’m not claiming the engine. I’m shipping a cleaner, more tactical interface layer on top of his work.
🧩 BK Enhancements (on top of Trendoscope)
Purpose: read continuation faster with less chart noise.
Short-form pattern tags so structure stays obvious without burying price:
BF / BeF / BP / BeP / F / P / UF / DF / RF / FF / AF / DeF
Label transparency controls (text + background), plus separate transparency control for short labels
Hover tooltips (toggle): hover the tag to reveal full pattern name + bias (Bullish / Bearish / Neutral)
Upgraded alert system: filters by Bias (Bullish/Bearish/Neutral) and Type (Flag / Pennant), with clearer alert messages
Pattern border extension (optional): extends the two pattern boundary lines forward by N bars so your levels stay mapped for break/retest planning
Everything else is Trendoscope’s architecture and math.
🧠 What It Does (The Mission)
This script hunts continuation formations that form after a strong impulse move:
Detects the flagpole (impulse)
Validates a consolidation structure (flag or pennant)
Tags it cleanly with short codes
Optional hover-briefing gives the long name + bias exactly when you need it
You get continuation structure in real time, across multiple swing sensitivities.
🧭 How It Detects (So You Know It’s Not Random)
This isn’t “pattern art.” It’s rule-based geometry + swing logic:
1) Multi-Zigzag Sweep (micro → macro)
Runs up to 4 zigzag engines so it catches both tight and larger continuations.
(Default BK tuning uses 4 levels with different swing lengths/depths.)
2) Quality Filters (you control strictness)
Key scanning controls:
Error Threshold: tolerance used during trendline validation
Flat Threshold: what qualifies as “flat” vs sloped
Max Retracement (default 0.618): limits how deep the consolidation can retrace the impulse
Verify Bar Ratio (optional): checks proportion/spacing of pivots, not just price
Avoid Overlap: prevents stacking formations on top of each other
Repaint option: allows refinement if better coordinates form (for real-time users)
3) Classification (Flag vs Pennant)
Once the engine confirms an impulse + valid consolidation, it classifies:
Flag = orderly channel/wedge-style consolidation after the pole
Pennant = tighter triangle-style compression after the pole
Then it labels with bias based on direction and formation context.
🏳️ Read the Continuation (Short Codes that Actually Matter)
BF — Bull Flag: strong pole → controlled pullback; watch for break + continuation expansion
BP — Bull Pennant: thrust → tight compression; expansion confirms carry
BeF — Bear Flag: down impulse → weak rallies; breakdown favors continuation lower
BeP — Bear Pennant: pause beneath resistance; release favors trend continuation
F / P: generic flag / pennant tags when the system can’t (or shouldn’t) over-specify
Standards aren’t decoration—they’re orders.
🧑🏫 Mentor A.K.
A.K. is the discipline behind this release.
No chasing. No gambling. No emotional entries.
He drilled one rule into everything: structure first, then execution—never the reverse.
This indicator exists to make that possible under pressure.
🤝 Give Forward (The Code of the Crew)
If this tool sharpens your edge:
Teach one trader how to read continuation properly (pole → base → trigger → invalidation)
Share process, not just screenshots (entry logic, stop logic, management plan)
If you build on open work: credit loudly and contribute improvements back when you can
Tools multiply force. Character decides the outcome.
👑 Respect to King Solomon (Wisdom > Impulse)
“Plans are established by counsel; by wise guidance wage war.” — Proverbs 20:18
Continuation trading is the same: impulse → formation → execution.
BK AK-Flag Formations — when the standard rises, the line advances.
Gd bless. 🙏

4MA / 4MA[1] Forward Projection with 4 SD Forecast Bands4MA / 4MA Projection + 4 SD Bands + Cross Table is a forward-projection tool built around a simple moving average pair: the 4-period SMA (MA4) and its 1-bar lagged value (MA4 ). It takes a prior MA behavior pattern, projects that structure forward, and wraps the projected mean path with four Standard Deviation (SD) bands to visualize probable future price ranges.
This indicator is designed to help you anticipate:
Where the MA structure is likely to travel next
How wide the “expected” future price corridor may be
Where a future MA4 vs MA4 crossover is most likely to occur
When the real (live) crossover actually prints on the chart
What you see on the chart
1) Live moving averages (current market)
MA4 tracks the short-term mean of price.
MA4 is simply the previous bar’s MA4 value (a 1-bar lag).
Their relationship (MA4 above/below MA4 ) gives a clean, minimal read on trend alignment and directional bias.
2) Projected MA path (forward curve)
A forward “ghost” of the MA structure is drawn ahead of price. This projected curve represents the indicator’s best estimate of how the moving average structure may evolve if the market continues to rhyme with the selected historical behavior window.
3) 4 Standard Deviation bands (predictive future price ranges)
Surrounding the projected mean path are four SD envelopes. Think of these as forecast corridors:
Inner bands = tighter “expected” range
Outer bands = wider “stress / extreme” range
These bands are not a guarantee—rather, they’re a structured way to visualize “how far price can reasonably swing” around the projected mean based on observed volatility.
4) Vertical projection lines (most probable cross zone)
Within the projected region you’ll see vertical lines running through the bands. These lines mark the most probable zone where MA4 and MA4 are expected to cross in the projection.
In plain terms:
The projected MAs are two curves.
When those curves are forecasted to intersect, the script marks the intersection region with a vertical line.
This gives you a forward “timing window” for a potential MA shift.
5) Cross Table (top-right)
The table is your confirmation layer. It reports:
Current MA4 value
Current MA4 value
Whether MA4 is above or below MA4
The most recent BUY / SELL cross event
When a real, live crossover happens on the actual chart:
It registers as BUY (MA4 crosses above MA4 )
Or SELL (MA4 crosses below MA4 )
…and the table updates immediately so you can confirm the event without guessing.
How to use it
Practical workflow
Use the projected SD bands as future range context
If price is projected to sit comfortably inside inner bands, the market is behaving “normally.”
If price reaches outer bands, you’re in a higher-volatility / stretched scenario.
Use vertical lines as a “watch zone”
Vertical lines do not force a trade.
They act like a forward “heads-up”: this is the most likely window for an MA crossover to occur if the projection holds.
Use the table for confirmation
When the crossover happens for real, the table is your confirmation signal.
Combine it with structure (support/resistance, trendlines, market context) rather than trading it in isolation.
Notes and best practices
This is a projection tool: it helps visualize a structured forward hypothesis, not a certainty.
SD bands are best used as forecast corridors (risk framing, range planning, and expectation management).
The table is the execution/confirmation layer: it tells you what the MAs are doing now.

ZERO LANG Nube EMA 18-36 + Volumen EstrictoThis indicator is designed to show market trends using a cloud pattern. When the price retests the cloud and bounces back across it with high volume, it generates a buy signal, and vice versa when the price falls.
It uses the 18-period EMA and the 36-period EMA.

Gaps IdentifierThis indicator identifies up and down Gaps using previous period's close price to the next period's open price. Potentially useful for Gap rebound strategies.
(Will identify gaps 4%–11% by default; can change in settings)


Watchlist Auto Buy/Sell AlertsTrial for the best. This indicator is built to assess the chart and make it easier for traders to identify coins that are available for trading and minimize losses.

ICT ORB Killzones by MaxN (15 / 30m)Trading session London, Asia, New York
orb 15/30 min selectable breakout zones with buy/sell signals
