Thick Wick Highlight - XWiseTradeMake candle wicks pop with customizable thickness and color!
This lightweight overlay draws bold lines over upper and lower wicks on every candle—ideal for:
• Crowded charts with multiple indicators where thin wicks get lost
• Cleaner screenshots and printed analysis
• Making long wicks more visible at a glance
Features:
• Adjustable wick color and thickness (1-10)
• Works on all symbols and timeframes
Note: Due to TradingView's line object limit (~50 lines per script), thick wicks are visible on the most recent ~25 candles.
More premium indicators and strategies coming soon at:
xwisetrade.com
Be Wise. Trade X.
Motifs graphiques

QuantFlow Algo: Institutional Trap & ReversalRetail traders often lose money because they chase "breakouts" that are actually Liquidity Traps set by institutional algorithms. This script is designed to solve that problem.
Unlike standard indicators that clutter your chart with lagging moving averages and noisy clouds, the QuantFlow Algo: Institutional Trap & Reversal runs a high-performance Background Algorithm to detect "Smart Money" activity. It keeps your chart 100% clean and only prints a signal when a high-probability reversal structure is confirmed.
How it Works (The Logic):
The script utilizes a proprietary "Dual-Stage Verification" process to filter out false signals:
1. Liquidity Absorption: It detects specific candle geometries (Shadow-Excursion Ratios) where price aggressively breaks a level but fails to sustain momentum, trapping breakout traders.
2. Volumetric Pressure: It validates these traps using a relative volume anomaly detector to ensure institutions are active in the move.
3. Structural Delta: It analyzes the net order-flow bias of the session (Displacement) to ensure the reversal aligns with the immediate market structure.
Key Premium Features:
🛡️ Institutional Trap Detection Engine:
Automatically identifies high-probability "Smart Money" traps where retail traders get caught. Uses a proprietary Volumetric Pressure Algorithm to detect true liquidity grabs.
★ Sniper Confirmation Mode:
Filters out fake signals by waiting for a "Test Candle." The Gold Star (★) appears only when the market successfully retests the level on low volatility, giving you a precise, lower-risk entry.
❌ Auto-Failure Detection:
Stop guessing if a trade is dead. The script automatically marks invalidated setups with a discrete "X" , saving you from holding onto losing trades.
📊 Institutional Flow Verification:
A smart filter that validates signals using real Capital Injection & Order Flow . Includes a "Zero-Flow Mode" for indices like SPX/NDX, ensuring universal compatibility.
🖥️ Multi-Timeframe (MTF) Context Panel:
A built-in "Heads-Up Display" that monitors the 15m, 1H, 4H, and Daily trends simultaneously. It physically blocks counter-trend signals to keep you aligned with the higher timeframe flow.
🧠 Smart Adaptive Baseline (KAMA):
Uses Kaufman’s Adaptive Moving Average to react faster to market crashes than standard lagging indicators, protecting you from "catching a falling knife" during high volatility.
⚡ Two-Stage Signal System:
Stage 1 (Triangle ⚡): Alert Phase – The Trap is detected. Get ready.
Stage 2 (Star ★): Execution Phase – The Setup is confirmed. Enter the trade.
How to Use (Strategy):
This tool is designed as a "Setup Locator" with a built-in failure protocol. We recommend the 2-Phase Verification Method :
1. Wait for the Signal: Look for a Blue ⚡ (Buy Setup) or Orange ⚡ (Sell Setup).
Do not enter yet. This is the "Alert" phase.
2. Automatic Validation: The script scans for the next candle to close with Diminished Volumetric Pressure (Receding Order Flow). When this specific "test" condition occurs, a Gold Star (★) will appear.
3. Execution Protocols:
For a BUY Signal (Blue ⚡):
a. Standard Entry (The Star ★): If the Gold Star appears, wait for price to break the HIGH of that Star Candle. The trap is confirmed. Enter Long .
b. Failure Flip (The "X"): If a Grey "X" appears instead, the Buy Trap has failed. The institutions have let the support break. Go Short immediately (Reversal Trade).
For a SELL Signal (Orange ⚡):
a. Standard Entry (The Star ★): If the Gold Star appears, wait for price to break the LOW of that Star Candle. The trap is confirmed. Enter Short .
b. Failure Flip (The "X"): If a Grey "X" appears instead, the Sell Trap has failed. The institutions have let resistance break. Go Long immediately (Reversal Trade).
Why use the Failure Flip? A failed institutional trap often results in an explosive move in the opposite direction as trapped traders are forced to cover their positions.
4. Stop Loss: Place just above/below the Star Candle or the recent swing high/low.
Why is this Closed-Source?
This script operates on proprietary algorithms for Institutional Order Flow and Adaptive Smoothing . These internal calculations protect the unique logic used to validate setups and ensure a quantitative edge that standard open-source indicators cannot replicate.
Disclaimer: This tool is for educational analysis purposes only. Past performance does not guarantee future results.
💎 Premium Access & Updates:
For exclusive access, setup tutorials, and the complete "Sniper Strategy" guide, please check the link in my TradingView Profile Bio or the Signature below.

AI Market Barometer ProAI Market Barometer Pro - Professional Trading Indicator
Overview
AI Market Barometer Pro is an advanced multi-timeframe trading system that combines artificial intelligence algorithms with proprietary technical analysis to deliver high-confidence trading signals. This professional-grade indicator analyzes market conditions across multiple timeframes simultaneously, providing traders with clear directional bias and signal strength ratings.
Core Features
🎯 Core AI Barometer System
- Multi-Timeframe Analysis: Monitors different timeframes simultaneously
- AI Confidence Score: Proprietary algorithm calculates signal confidence from 0-100%
- Three-Level Signal Strength: Basic, Medium ★, and Strong ★★ signals
- Dynamic Background Coloring: Visual market sentiment at a glance
- Real-Time Information Panel: Customizable position with live market metrics
⚡ Three AI Accelerator Systems
- Accelerator 1: Original multi-timeframe momentum system with 27 dimensions
- Accelerator 2: Five-star selection algorithm with 32 AI parameters
- Accelerator 3:
- Each accelerator provides independent AI support lines and signal zones
- Highly selective signals ensuring maximum accuracy
📊 Advanced Visualization
- Color-Coded Signals:
- Green zones indicate bullish conditions
- Red zones indicate bearish conditions
- Gray indicates neutral/ranging markets
- Smart Labels: Auto-positioned signal labels displaying confidence percentages
- Background Intensity: Three levels showing signal strength
- Customizable Display: Adjustable panel position and visibility options
Configuration Options
Display Settings
- Panel Position: 9 position options (corners, edges, center)
- Show Labels: Toggle signal labels on/off
- Show Background Color: Toggle background coloring on/off
- Show Info Panel: Toggle real-time information table on/off
- Background Display Days: Control how many days of coloring to display (1-30 days)
Channel Settings
- Enable Channel: Optional channel
- Channel Width: Adjustable deviation multiplier
Accelerator Settings
- Enable Accelerator 1: Original accelerator system
- Enable Accelerator 2: Five-star selection system
- Enable Accelerator 3: Advanced buy filtering system
- Each can be toggled independently
Alert System
Pre-configured alerts include:
- AI Long Signal activation
- AI Short Signal activation
- AI Ranging Signal activation
- Accelerator 1 Bull/Bear zones
- Accelerator 2 Bull/Bear zones
- Accelerator 3 Bull/Bear zones
Information Panel Metrics
Real-time display includes:
- Current Timeframe
- Active Signal (Long/Short/Ranging)
- AI Confidence Percentage
- Current Price
- Change Percentage
- Momentum Status (Bullish/Bearish/Mixed)
- Signal Strength Rating
Recommended Timeframes
- Scalping: 1-minute charts
- Day Trading: 5-minute, 15-minute charts
- Swing Trading: 1-hour, 4-hour, Daily charts
- Position Trading: Daily, Weekly charts
Technical Requirements
- TradingView Pro, Pro+, or Premium account (required for multi-timeframe functionality)
- Compatible with all markets: Forex, Crypto, Stocks, Indices, Commodities
- Works on all timeframes from 1-minute to Monthly
Disclaimer
This indicator is a tool to assist with trading decisions. Past performance does not guarantee future results. Trading involves substantial risk of loss. Always use proper risk management and never risk more than you can afford to lose. The AI algorithms and confidence scores are based on historical price patterns and technical analysis, not predictive guarantees.
What Makes This Different?
Unlike simple trading systems, AI Market Barometer Pro:
- ✅ Analyzes multiple timeframes simultaneously
- ✅ Calculates dynamic confidence scores
- ✅ Provides three-tier signal strength ratings
- ✅ Includes three independent accelerator systems
- ✅ Delivers highly selective, low-noise signals
- ✅ Features professional-grade visualization
- ✅ Adapts to all market conditions
Join thousands of traders using AI-powered analysis to gain their edge in the markets.
🌤️ Perfect Companion Indicator
Enhance your trading with AI Market Weather Forecast Pro
Transform complex market analysis into intuitive weather forecasts. Get instant market temperature readings from -50°C to +50°C and know whether you're trading in a heatwave or a blizzard.
Why use them together:
Barometer → Precise entry/exit signals with AI confidence scores
Weather → Overall market climate and trend temperature
Combined → Complete market picture for optimal timing
👉 Get AI Market Weather Forecast Pro
Know the market climate before you trade. Two indicators, one complete trading system.
© 2024 AI Market Barometer Pro. All rights reserved. Proprietary algorithms and methodologies protected.

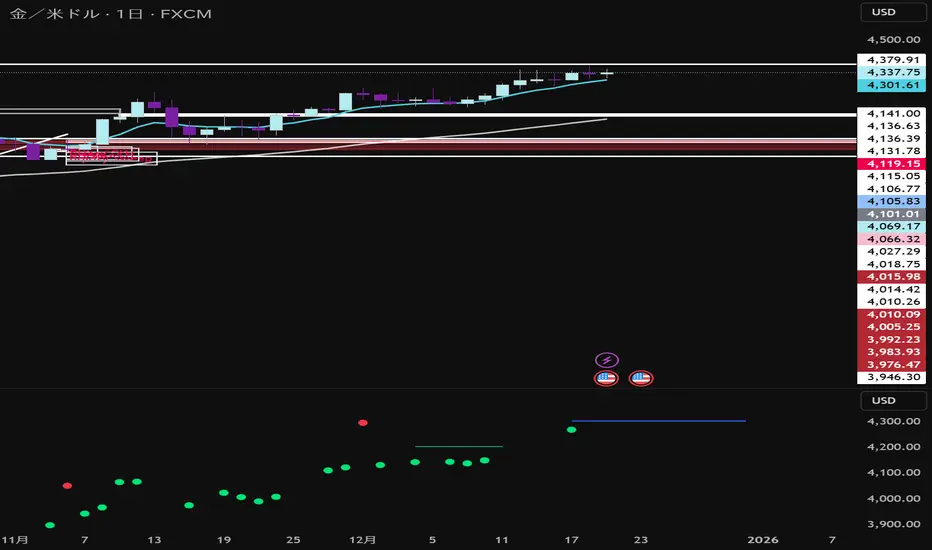
Gann Levels by Acharya JiThis Pine Script indicator is designed to help traders quickly identify **key intraday levels** based on the **first candle of the trading day**. It performs three main functions:
1. **Marks the First Candle’s High and Low**
- Blue circles are plotted at the high and low of the first candle each day.
- These serve as the baseline reference points for calculating targets.
2. **Plots Upside Targets (Green Lines)**
- Six horizontal green lines are drawn above the first candle’s high.
- Each line represents a percentage increment: **+0.09%, +0.18%, +0.36%, +0.72%, +1.44%, +2.88%**.
- These levels act as potential resistance or profit-taking zones.
3. **Plots Downside Targets (Red Lines)**
- Six horizontal red lines are drawn below the first candle’s low.
- Each line represents a percentage decrement: **-0.09%, -0.18%, -0.36%, -0.72%, -1.44%, -2.88%**.
- These levels act as potential support or stop-loss zones.
---
Purpose
- Provides a **structured intraday roadmap** based on the first candle.
- Helps traders visualize **target ladders** both above and below the market.
- Useful for scalpers, intraday traders, and strategy testing around **breakouts or reversals**.
---
👉 Rahul, would you like me to also add **labels (like +0.09%, -0.18%)** directly on the chart next to each line so you can instantly recognize which target level is which without checking the legend?

DENIES KRESNA SANTA FOOTSTEPOne very cold night, Santa was counting the good deeds of the children in each house to give them Christmas presents.
The children in the town were curious about which house would receive the gift. But the children could guess where Santa would deliver the gift based on several indications.
Footstep: Santa was delighted to find a good child's house, jumping high to show his joy, leaving footprints on the roof.
Starlight: The presence of starlight indicated that Santa's jump was so high that it tore through the clouds, allowing light to penetrate the town.
Dwarf: Children in their sleep heard the little noisy voices of the dwarfs, who sometimes came out with Santa.
And the children hoped that one day, Santa would return, leaving the most beautiful Christmas gift, and jump high again, filled with joy...

DENIES KRESNA UFO ENGULFhelping me to choose engulf area
This script help me as snipper indicator to choose where is untouch engulf area yet.

SekakitaMoneyZone本インジケーターは、製作者Sekakitaが実際のトレードで使用している
「相場の波形(Wave Structure)」に基づき、利確候補(TP)を見極めることを目的として開発されました。
相場の流れを視覚的に捉えることで、無駄なエントリーや早すぎる決済を防ぎ、再現性の高いトレード判断を可能にします。
This indicator is developed based on the wave patterns essential to Sekakita’s trading strategy, with the primary goal of identifying potential take-profit (TP) areas.
By visualizing market wave structures in real time, it enables more consistent and disciplined trade management.
ENTRY SL TARGETS]Entry sl target use 3 min time frame intraday use only,long and short trades can do with sl

WaveTrend Strategy [Long + Flex Exit]wavetrend strategy
enter long when oversold.
close position when profit reaches certain value or overbought

EmmTech FVG Instantaneous Mitigation Strategy Only buy once SMA is above rsi and sell when sma is below RSI

ATR + Moving AverageThis indicator shows a manually calculated Average True Range (ATR) along with a moving average of the ATR.
The ATR measures current candle volatility.
The ATR Moving Average shows the average candle size over the selected period.
Both can use different smoothing types (RMA, SMA, EMA, WMA) for flexibility.
It’s useful for seeing when price is stretched, volatility is expanding or contracting, and for higher-timeframe mean-reversion analysis.

Hardwaybets Strat Market Checklist Trading## **Hardwaybets TheStrat Market Checklist Engine**
**A Checklist-Driven TheStrat Trading**
---
### **Overview**
This script is an **informational market context and permission framework** designed to help users **organize structural and liquidity information** in a clear, checklist-based format.
It evaluates **price context only** and displays the results in a table.
It does **not** generate trade signals or trading instructions.
---
### **What This Script Does**
The indicator evaluates and displays:
* Nearest prior **Area of Interest (AOI)**
(Previous Day High/Low or Previous Week High/Low)
* Higher-timeframe structural bias (Daily & Weekly)
* Proximity to liquidity
* Liquidity behavior (acceptance vs rejection)
* **Strat pattern classification only** (12 canonical patterns)
* A final **permission state** based on the above conditions
All information is presented as **contextual reference data**, not execution guidance.
---
### **What This Script Does NOT Do**
* ❌ No buy or sell signals
* ❌ No arrows, markers, or execution prompts
* ❌ No entries, exits, stops, or targets
* ❌ No performance metrics or profitability claims
* ❌ No strategy or backtesting logic
The word **“TRADE”** in the dashboard refers to **permission status only**, not a recommendation to trade.
---
### **Dashboard Modes**
* **Full Mode**: displays AOI price and distance (points & ticks)
* **Compact Mode**: minimal checklist view for reduced screen usage
Both modes are **informational only**.
---
### **Pattern Classification**
The script identifies and labels Strat candle pattern **types only**, including:
* Reversal patterns
* Continuation patterns
* Compression patterns
* Expansion patterns
Pattern labels are **descriptive classifications**, not signals or instructions.
---
### **Intended Use**
This script is intended to be used as a **contextual reference tool** alongside a user’s own analysis, rules, or education.
It may be useful for:
* Market structure study
* Liquidity behavior observation
* Pattern classification review
* Educational purposes
---
### **Technical Notes**
* Pine Script® v6
* Uses completed candles only
* No repainting logic
* No future data access
* Table-based UI only
---
### **Disclaimer**
This indicator is provided **for educational and informational purposes only**.
The author does not provide financial advice, trading recommendations, or execution guidance.
All trading decisions remain the sole responsibility of the user.
---
### **Conceptual Attribution**
This script is inspired by publicly available market structure concepts commonly referred to as “The Strat” methodology.
No proprietary or paid content is included.
---
### **Feedback**
Constructive feedback and suggestions are welcome.
Please note that this script is intentionally **non-signaling by design**.

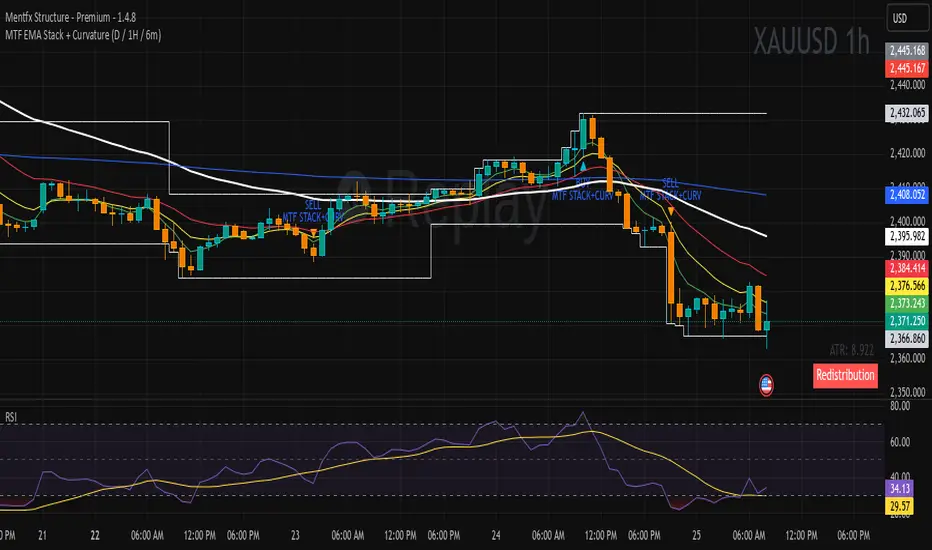
MTF EMA Stack + Curvature (D / 1H / 6m)Purpose of the Indicator
The MTF EMA Stack + Curvature Indicator is a trend-alignment confirmation tool.
Its goal is to identify high-probability trend continuation setups by requiring all of the following to agree:
Trend direction (EMA stacking)
Trend strength / acceleration (EMA curvature)
Multi-timeframe alignment (Daily, 1-Hour, and 6-Minute) with you can change to your preference
Instead of reacting to short-term noise, the indicator only signals when institutional-style trend structure is aligned across time frames.
GODMODE V2.3══════════════════════════════════════════════════════════════
⚡ GODMODE V2.3 PRO ⚡
══════════════════════════════════════════════════════════════
The most visually stunning & powerful trading indicator you'll ever use.
Stop guessing. Start trading with confidence.
══════════════════════════════════════════════════════════════
█▀▀ █▀▀ ▄▀█ ▀█▀ █░█ █▀█ █▀▀ █▀
█▀░ ██▄ █▀█ ░█░ █▄█ █▀▄ ██▄ ▄█
────────────────────────────────
🎯 SMART SIGNAL ENGINE
────────────────────────────────
✦ Multi-Confluence Buy/Sell Signals
Signals only fire when multiple conditions align
✦ RSI Confluence Filter
Eliminates overbought/oversold false signals
✦ Volume Confirmation
Validates signals with volume spikes
✦ Signal Strength Score (0-100%)
Know exactly how strong each setup is
✦ Momentum Detection
Confirms trend direction before entry
────────────────────────────────
🔮 PREDICTION SYSTEM
────────────────────────────────
✦ AI-Powered Prediction Line
Projects price direction with glowing trajectory
✦ Dynamic Target Calculation
Auto-updates with every tick
✦ Confidence Indicators
Visual cues for prediction strength
────────────────────────────────
💎 PREMIUM VISUALS
────────────────────────────────
✦ Neon Glow Moving Averages
5-layer glowing MAs that pulse with the trend
✦ Breathing Gradient Ribbon
Ribbon opacity intensifies with trend strength
✦ Trend Zone Highlighting
Background subtly tints with market direction
✦ Signal Burst Effects
Expanding rings on every buy/sell signal
✦ Price Comet Trail
Fading dots follow price like a shooting star
✦ Trend-Colored Candles
Candles change color based on trend direction
✦ GODMODE Activation Animation
Cinematic startup sequence when loaded
────────────────────────────────
📊 STRUCTURE & LEVELS
────────────────────────────────
✦ Previous Day High/Low (PDH/PDL)
Key institutional levels auto-plotted
✦ Auto Support/Resistance Zones
Algorithm detects and highlights key S/R
✦ Session Highlighting
London • New York • Tokyo sessions marked
with distinct colors
────────────────────────────────
🛡️ RISK MANAGEMENT
────────────────────────────────
✦ Holographic TP/SL Zones
Glowing target and stop loss bands
✦ ATR-Based Calculations
Volatility-adjusted levels for any market
✦ Risk:Reward Display
See your R:R ratio before entering
✦ Customizable Multipliers
Adjust TP/SL to match your style
────────────────────────────────
📈 LIVE DASHBOARD
────────────────────────────────
✦ Real-Time Trend Status
BULLISH / BEARISH / NEUTRAL indicator
✦ Power Gauge
Visual strength meter with percentage
✦ RSI Gauge
Animated RSI bar with value
✦ Volume Status
SPIKE / NORMAL volume indicator
✦ Momentum Tracker
STRONG / RISING / FALLING / WEAK status
✦ Session Display
Shows current active trading session
✦ Signal Direction
LONG / SHORT / WAIT recommendation
✦ Target Price
Live predicted target level
────────────────────────────────
⚙️ TRADING MODES
────────────────────────────────
✦ SCALP MODE
Fast signals with 9/21 MAs
Perfect for 1m-15m timeframes
✦ SWING MODE
Filtered signals with 50/100 MAs
Ideal for 1H-Daily timeframes
────────────────────────────────
🔔 SMART ALERTS
────────────────────────────────
✦ Buy Signal Alert
✦ Sell Signal Alert
✦ High Power Alert (80%+ confluence)
✦ Strong Buy Alert (signal + high power)
✦ Strong Sell Alert (signal + high power)
All alerts include ticker & price.
Compatible with webhooks for automation.
────────────────────────────────
🎨 CUSTOMIZATION
────────────────────────────────
✦ MA Type Selection (EMA/SMA/VWMA)
✦ Adjustable MA Lengths
✦ RSI Threshold Controls
✦ Volume Sensitivity
✦ TP/SL Multipliers
✦ Prediction Range
✦ Toggle Any Visual On/Off
✦ Dashboard Position Selection
✦ Session Time Customization
══════════════════════════════════════════════════════════════
█░█░█ █▀█ █▀█ █▄▀ █▀ █▀█ █▄░█
▀▄▀▄▀ █▄█ █▀▄ █░█ ▄█ █▄█ █░▀█
✓ All Markets (Forex, Crypto, Stocks, Indices)
✓ All Timeframes (1m to Monthly)
✓ TradingView (Desktop & Mobile)
══════════════════════════════════════════════════════════════
█░█░█ █░█ ▄▀█ ▀█▀ ▀ █▀ █ █▄░█ █▀▀ █░░ █░█ █▀▄ █▀▀ █▀▄
▀▄▀▄▀ █▀█ █▀█ ░█░ ░ ▄█ █ █░▀█ █▄▄ █▄▄ █▄█ █▄▀ ██▄ █▄▀
✦ Lifetime access to GODMODE V2.3 PRO
✦ All future updates included
✦ Works on unlimited charts
✦ Full customization options
✦ Priority support via DM
══════════════════════════════════════════════════════════════
█▀▀ ▄▀█ █▀█
█▀░ █▀█ ▀▀█
Q: Does this repaint?
A: Signals are confirmed on bar close. No repainting.
Q: What markets does this work on?
A: All markets — Forex, Crypto, Stocks, Futures, Indices.
Q: What timeframe is best?
A: Scalp Mode for 1m-15m. Swing Mode for 1H+. Works on all.
Q: Do I get updates?
A: Yes, all future updates are included free.
Q: How do I get access?
A: After purchase, send me your TradingView username.
Access granted within 24 hours (usually faster).
══════════════════════════════════════════════════════════════
⚡ GODMODE V2.3 PRO — $50 ⚡
══════════════════════════════════════════════════════════════

DEVASTICits a combination of MACD+RSI+STOCHASTIC. It enhances the oscillation and sublimes the participation of stochastic indicator into the ultimate MACD the king of Indicators. I have used the formulae of 14 period SMA and combined it with other oscillators.

Premarket & PD H/L scannerpremarket scanner for top stock picks
Uses a stock selection of your own choosing that can be adjusted in the script as need be.
Both the premarket low or high is compared and also previous day high or low in order to determine trend and pinpoint which tickers are best suited to trade on a particular day


LockedEye Trading Navigator**LockedEye Trading Navigator — Summary**
This script is a real-time market decision dashboard designed to prevent impulsive trades by forcing structure, context, and confirmation checks into a single glance. It does not generate blind buy/sell signals. It evaluates market conditions, trend alignment, and risk context before allowing a trade bias.
**Core Purpose**
Acts as a pre-trade checklist, not a signal spammer.
Helps traders wait, filter, and align with structure.
Designed for scalping to intraday trading.
Optimized to reduce FOMO entries and late trades.
**Key Features**
**1. Market State Detection**
Classifies the market into TREND ↑, TREND ↓, or COOKING (ranging/compression).
Uses volatility compression and linear regression slope to prevent trading during low-quality conditions.
**2. Multi-Timeframe Moving Average Alignment**
Tracks trend alignment using EMA 6 & 21 (momentum bias), EMA 50 (mid-trend filter), EMA 200 (macro bias), and EMA 70 & 99 on M15 (higher-timeframe confirmation).
Each MA condition is displayed with directional arrows and color-coded backgrounds.
**3. Break of Structure (BOS)**
Detects bullish or bearish structure breaks based on recent range.
Flags BULL, BEAR, or NO.
Used as structural confirmation, not as a standalone signal.
**4. MACD Momentum Bias**
Evaluates MACD line versus signal line.
Outputs BULL, BEAR, or NONE.
Acts as momentum confirmation for trend continuation or exhaustion.
**5. RSI Divergence Detection**
Detects basic bullish and bearish divergence.
Highlights momentum disagreement with price.
Used as a boost factor, not a trigger.
**6. Candlestick Context**
Identifies bullish engulfing, bearish engulfing, and doji candles.
Used to validate entry timing rather than direction alone.
**7. Volume Behavior**
Compares current volume to a 20-period SMA.
Flags INCREASING or DECREASING to confirm whether price movement is supported by participation.
**8. ICT Candle Logic (Correctly Color-Coded)**
Evaluates the current close relative to the previous candle.
INSIDE: Close remains within the previous high/low, indicating consolidation.
OUTSIDE (Green): Close above previous high, indicating bullish expansion.
OUTSIDE (Red): Close below previous low, indicating bearish expansion.
Helps avoid misreading fake breakouts and inside bars.
**9. Price Location Awareness**
Determines whether price is at SUPPORT, at RESISTANCE, or in MID range.
Ensures trades are only considered where risk is logical.
**10. Final Trade Summary Engine**
Outputs one of four states: LONG OK, SHORT OK, WAIT, or NO TRADE.
Requires trend alignment, MACD agreement, structure and location validation, and at least one supporting confirmation.
**Design Philosophy**
No repainting by default.
No emotional signals.
No hindsight bias.
Forces discipline and patience.
Designed as a decision filter, not a prediction tool.
**Best Use Case**
Scalping and intraday trading.
Traders who struggle with overtrading.
Traders who want structure before execution.
Works best when combined with manual price action reading.

Killzones by (Pecurtoo)This indicator highlights key trading sessions on the chart in UTC+1 (Brussels) timezone. It allows traders to visually identify the Asian, London, New York AM, and New York PM sessions with customizable start and end times and colors. The sessions are displayed as shaded backgrounds on the chart, making it easier to spot periods of high market activity and potential volatility. All session times and colors can be fully edited by the user, providing flexibility to match different trading strategies.
It is ideal for traders using ICT Killzone concepts, intraday strategies, or those who want to track session-specific market activity.

Filtered Outside BarPerfect! Let’s create a **TradingView-ready description** with **visual explanations** for your “RSI Filtered Outside Bar” indicator. I’ll include **how it looks on the chart** and **what each feature does** so your post will be professional and clear.
---
# 📊 RSI Filtered Outside Bar – Indicator
**Overlay:** ✅ Yes (Plotted on price chart)
**Purpose:** Detects **bullish and bearish outside bars** filtered by RSI overbought/oversold conditions. Perfect for spotting reversals or continuation setups.
---
## 🔹 Features
| Feature | Description |
| ------------------------- | -------------------------------------------------------------------------------------------------------- |
| **Outside Bar Detection** | Detects consecutive outside bars (user-configurable `Number of Outside Bars`) |
| **RSI Filter** | Only triggers if previous bar RSI is in overbought or oversold zones |
| **Signal Arrows** | Optional bullish (green) and bearish (red) arrows plotted on chart |
| **Signal Lines** | Optional horizontal lines at high/low of the outside bar with configurable length and color |
| **Customizable Inputs** | Users can adjust RSI period, overbought/oversold levels, line color, extension length, arrows visibility |
---
## 🔹 Input Settings
**Outside Bar Settings:**
* Number of Outside Bars
* Show Arrow (✅/❌)
* Show Signal Lines (✅/❌)
* Signal Line Extension Length
* Signal Line Color
**RSI Settings:**
* RSI Length
* RSI Overbought Level
* RSI Oversold Level
---
## 🔹 How It Works (Visual Explanation)
**1️⃣ Bullish Outside Bar Signal**
* Previous bars are bearish
* Current bar is an outside bar (high > previous high, low < previous low)
* RSI of previous bar in overbought/oversold zone
**Chart Example:**
```
High ──────────────●
│
Close ──────────● │
Open ──────────│● │
Low ──────────│ ●
Bullish Arrow ↓ (below bar)
Horizontal line at high & low
```
---
**2️⃣ Bearish Outside Bar Signal**
* Previous bars are bullish
* Current bar is an outside bar
* RSI of previous bar in overbought/oversold zone
**Chart Example:**
```
High ──────────●│
Open ──────────│●│
Close──────────│ │●
Low ──────────●
Bearish Arrow ↑ (above bar)
Horizontal line at high & low
```
---
## 🔹 Notes
* Works on **any timeframe**
* Overlay on price chart, so arrows and lines are visible directly on candles
* Lines extend automatically based on user-defined length
* Arrow color, size, and line color are configurable
---
✅ **Trading Strategy Use Cases:**
* Spot potential **reversals** after RSI extremes
* Identify **high probability breakout bars**
* Combine with support/resistance or trend indicators

Midnight Open Line by PecurtoooMidnight Open line, based on SMT concepts.
This indicator plots the Midnight Open price of the current trading day and draws a horizontal reference line starting exactly at 06:00. The line is created only on intraday timeframes from 5 minutes up to 1 hour and automatically resets at the start of each new day.
The purpose of the indicator is to provide a clear session-based price reference for London and New York trading, allowing traders to observe how price reacts to the midnight open after the Asian session. The line color and width are fully customizable, and the indicator respects the selected timezone to ensure accurate session alignment.
This tool is intended for intraday trading and session analysis, helping identify potential support, resistance, and directional bias relative to the daily midnight open.

optionboss1. Dual-Directional Scalping Intelligence
This optionboss is built to identify high-probability Call (CE) and Put (PE) opportunities in real-time. It eliminates guesswork by providing clear "BUY CE" and "BUY PE" labels directly on the candles when the trend is ready to reverse or extend.
2. Proprietary "Dual Space" Logic
The script uses a specialized "Distance-from-Mean" calculation. It only triggers signals when the price is overextended (far from the baseline), ensuring you aren't trading in the "choppy" middle zone. This significantly reduces false signals compared to standard indicators.
3. Automatic T1 Target Projection
Stop wondering where to take profits. The optionboss automatically draws a T1 Target Line the moment a signal appears.
4. Candlestick "Elimination" Verification
The signal logic is based on institutional price action. A "BUY CE" only triggers when a green candle successfully "takes out" the high of a previous red candle at an extreme level, confirming that buyers have seized control.
5. Clean & Stealth Interface
Designed for professional traders who want a clean chart. The core moving averages are hidden behind generic "Sensitivity" settings to protect the strategy’s secrets. You get clear, non-repainting labels that stay fixed once the candle closes.
6. Fully Customizable for All Markets
While optimized for 5-minute scalping, the "Primary" and "Secondary" sensitivity inputs allow you to tune the engine for Nifty, Bank Nifty, Forex, or Crypto.
How to get access:
"This is a private, Invite-Only script. To maintain the quality of the signals and protect the strategy, access is restricted to authorized users. Please message me directly for subscription details and to have your TradingView username added to the access list."

Mizan v12: The Void Hunter (Ontological Liquidity)Title: Mizan v12: The Void Hunter (Ontological Liquidity Engine)
Overview: Mizan v12 is an advanced market structure tool that identifies Liquidity Voids (Fair Value Gaps) and uses a proprietary L-Score Engine to predict price reversion or continuation. Based on the philosophy of "Ontological Potential," it assumes that unfilled gaps act as magnets, pulling the price toward areas where market orders were not fully realized.
Technical Components:
The L-Score Engine: A composite momentum and volume index using normalized CCI (Velocity), RSI (Saturation), and CMF (Mass). It determines whether a "Displacement" move has enough gravity to sustain its direction.
Void Detection (FVG): The script dynamically identifies voids where a gap exists between the wicks of the 1st and 3rd candle. These are visualized as colored boxes.
Mitigation Logic: To keep the chart clean, the indicator automatically "mitigates" (deletes) void boxes once the price has retraced and filled the gap.
The Magnet Effect: It calculates the nearest active void above and below the current price, providing clear targets for take-profits or entry zones.
Operational Status:
Hunting Void: L-Score confirms momentum toward the nearest unfilled gap.
Reversion Completed: Price has successfully retraced into a void and is showing signs of a bounce.
Displacement: A strong impulse move that is leaving new voids behind, indicating a high-velocity trend.
