[ICT Sebo Lite] FVGVery simple and easy TradingView Indicator
This is a private invite-only indicator.
You may contact me via TradingView messages for additional information.
Description:
This indicator detects and visualizes Fair Value Gaps (FVGs) using a rule-based, ICT-style price imbalance framework with a focus on relevance and practical usability rather than signal quantity.
Unlike basic FVG scripts that mark every three-candle imbalance, this script applies custom filtering conditions, including a minimum imbalance size, strict candle structure requirements, and controlled forward projection to reduce weak or overlapping gaps and keep the chart readable.
Valid bullish and bearish FVGs are displayed as zones and include their 50% equilibrium level, commonly used as a reaction and mitigation reference in discretionary trading models. The indicator is designed to highlight high-quality imbalance areas across both intraday and swing timeframes.
This script is part of the ICT Sebo toolset. All logic and visualization rules were fully developed by the author and are kept closed-source to preserve consistency and protect the specific filtering and presentation logic.
This is a private invite-only indicator.
You may contact me via TradingView messages for additional information.
Fvg

CBDR Strategy (Central Bank Dealer Range)This indicator is designed for traders utilizing the Central Bank Dealer Range (CBDR) and sequential session sweep logic. It focuses on identifying liquidity sweeps of previous session highs and lows to find high-probability entries using Fair Value Gaps (FVGs).
Key Features:
Sequential Session Tracking: Automatically tracks and extends High/Low lines for Tokyo, London, and New York.
Liquidity Sweep Logic: Identifies when the current session sweeps the high or low of the previous session (e.g., London sweeping Tokyo).
Filtered FVG Entries: After a sweep, the script identifies Fair Value Gaps. It includes an ATR Multiplier filter to ignore insignificant "paper-thin" gaps.
Time Window Filter: A built-in time filter allows you to restrict entries to a specific window (e.g., only the first 2 hours of a session) to avoid late-session low-probability moves.
Fully Customizable Visuals:
Independent toggles for Session Names, FVG Labels, and Entry Labels.
Centered session labels for a cleaner chart aesthetic.
Session box border and line extension toggles to suit your chart theme.
Timezone & DST Support: Optimized for Indian Standard Time (GMT+5:30) with a one-click Daylight Savings Time toggle.
How to Use:
Wait for a Sweep: Look for the price to break the High or Low of the preceding session.
Identify FVG: Ensure an FVG forms in the opposite direction of the sweep within the allowed Time Window.
Entry: The script plots a "SELL" line at the bottom of a Bearish FVG or a "BUY" line at the top of a Bullish FVG.

[ICT Sebo] HTF FVGVery simple and easy TradingView Indicator
This is a private invite-only indicator.
You may contact me via TradingView messages for additional information.
Description:
This indicator identifies Higher Timeframe (HTF) Fair Value Gaps (FVGs) and projects them directly onto the current chart to provide clear higher-timeframe context.
Instead of relying on standard request.security() calls, the script internally aggregates higher-timeframe price data and detects bullish and bearish FVGs based on strict multi-candle imbalance conditions. Only gaps that meet a configurable minimum size threshold are displayed, helping to filter out insignificant structures.
Detected HTF FVGs are plotted as zones extending forward in time and include their 50% equilibrium level, which is commonly used as a reaction and mitigation reference. Each zone is clearly labeled with its originating timeframe for better contextual awareness.
This indicator is designed for traders who want to align lower-timeframe execution with higher-timeframe imbalance areas, improving directional bias and trade location across intraday and swing trading environments.
This is a private invite-only indicator.
You may contact me via TradingView messages for additional information.

[ICT Sebo] FVGVery simple and easy TradingView Indicator
This is a private invite-only indicator.
You may contact me via TradingView messages for additional information.
Description:
This indicator detects and visualizes Fair Value Gaps (FVGs) using a rule-based, ICT-style price imbalance framework with a focus on relevance and practical usability rather than signal quantity.
Unlike basic FVG scripts that mark every three-candle imbalance, this script applies custom filtering conditions, including a minimum imbalance size, strict candle structure requirements, and controlled forward projection to reduce weak or overlapping gaps and keep the chart readable.
Valid bullish and bearish FVGs are displayed as zones and include their 50% equilibrium level, commonly used as a reaction and mitigation reference in discretionary trading models. The indicator is designed to highlight high-quality imbalance areas across both intraday and swing timeframes.
This script is part of the ICT Sebo toolset. All logic and visualization rules were fully developed by the author and are kept closed-source to preserve consistency and protect the specific filtering and presentation logic.
This is a private invite-only indicator.
You may contact me via TradingView messages for additional information.

Trader4Telugu TradingThe Trader4Telugu Trading Suite is a technical analysis toolkit designed to consolidate institutional-style trading concepts into a single indicator. This script helps traders visualize market structure, liquidity zones, and pivot points without cluttering the chart with multiple separate indicators.
This suite is composed of four distinct technical modules:
1. Dynamic Camarilla Pivots This module calculates support and resistance levels using the standard Camarilla equation.
Logic: The script fetches the previous period's High, Low, and Close to calculate the R4/S4 (Breakout) and R5/S5 (Reversal) levels.
Auto-Timeframe: It automatically detects your current chart timeframe to provide the most relevant data (e.g., displaying Weekly pivots when viewing a 4-Hour chart, or Monthly pivots when viewing a Daily chart).
2. Imbalance & Structure Detection (SMC) This module identifies areas where price has moved aggressively, leaving inefficient pricing (Fair Value Gaps) or structural pivot points (Order Blocks).
FVG Logic: The script compares the current candle's Low with the High of the candle 2 bars ago (or vice versa). If the gap exceeds a user-defined ATR threshold (default 0.5x Average True Range), it highlights the zone.
Auto-Cleanup: To maintain chart cleanliness, the script uses an algorithm to detect when price has "mitigated" (filled) a gap. Once a zone is tested, it is automatically removed from the chart.
3. Market Structure Highs & Lows
Logic: Using a configurable swing detection length (default: 5 bars), the script identifies Pivot Highs and Pivot Lows.
BOS (Break of Structure): When a candle closes beyond a confirmed Pivot High or Low, the script draws a "BOS" line, indicating a potential trend continuation.
4. Session Killzones (Time-Based) This module highlights specific time windows that often correlate with high volatility in global markets.
Timezone: The logic is hardcoded to New York time (UTC-4) to ensure consistency regardless of user location.
Sessions: It highlights the Asia Range, London Open, and New York AM/PM sessions, allowing traders to visually backtest session-based volatility.
Settings & Customization:
Each module can be toggled on/off individually in the settings.
Colors and transparency are fully customizable to fit dark or light themes.
Disclaimer: This script is for educational technical analysis only. It visualizes historical price action and does not guarantee future performance.

ICT Fair Value Gaps (IFVG + FVG) LTEICT FVG & Inversion Tracker
Streamlined detection of High-Probability Fair Value Gaps and Inversions.
This indicator is designed to keep your charts clean while identifying the most critical internal liquidity levels immediately as they form. It utilizes a smart detection engine to filter noise and highlight only significant price imbalances.
Key Features
Instant Detection: Unlike standard indicators that wait for lagging confirmations, this tool marks FVGs and Inversion FVGs immediately upon the candle close.
Dual Gap Logic:
Standard FVG: Highlights classic imbalances (BISI/SIBI) for trend continuation.
Inversion FVG: Automatically detects when a gap has been invalidated and flips its polarity (e.g., Support becoming Resistance).
Smart Clutter Control: To maintain a pristine chart, boxes are automatically removed when:
Price fully mitigates (touches) the level.
The level expires after a set duration.
Visual Customization: Full control over colors and visibility for seamless integration into your existing chart setup.
Perfect for traders looking for a responsive, non-repainting gap tool without the visual noise.

Malaysian SNR Levels + FVGThis indicator combines the precision of Malaysian SnR levels with Fair Value Gap (FVG) detection, filtering levels to only appear within active FVG zones. This unique combination helps traders focus on the most relevant support and resistance levels where institutional order flow is likely present.
█ WHAT ARE FAIR VALUE GAPS (FVGs)?
A Fair Value Gap is a three-candle pattern where price moves so aggressively that it leaves an unfilled gap between the first and third candle:
Bullish FVG: Occurs when the low of candle 3 is higher than the high of candle 1, creating a gap to the upside.
Bearish FVG: Occurs when the high of candle 3 is lower than the low of candle 1, creating a gap to the downside.
These gaps represent areas of imbalance where price moved too quickly, often due to institutional activity. Price tends to return to these zones to "fill" or "mitigate" the gap before continuing its move.
█ WHAT ARE MALAYSIAN SNR LEVELS?
Malaysian SnR identifies support and resistance not as zones but as precise horizontal levels derived from a line chart perspective:
A-Level: Located at peaks of the line chart (shaped like the letter A)
V-Level: Located at valleys of the line chart (shaped like the letter V)
Gap Level: Located at the Close/Open gap between two consecutive candles of the same color
Levels can be Fresh (solid line) or Unfresh (dashed line):
A level is fresh if it hasn't been tested by a wick
Fresh levels have higher probability of price reaction
A level becomes fresh again if crossed by a candle body
█ THE COMBINATION: SNR LEVELS INSIDE FVGs
This indicator only displays SNR levels that fall within an active (non-invalidated) FVG zone. This filtering mechanism provides several advantages:
Reduced Noise: Instead of showing all nearby levels, only those within institutional imbalance zones are displayed
Higher Confluence: When a precise SNR level sits inside an FVG, it creates a high-probability reaction zone
Dynamic Updates: As FVGs get invalidated, the associated levels disappear, keeping your chart clean
█ FVG INVALIDATION LOGIC
An FVG remains active until price invalidates it:
Bullish FVG: Invalidated when price moves below the bottom of the gap
Bearish FVG: Invalidated when price moves above the top of the gap
You can choose the invalidation method:
Body Close (default): FVG is only invalidated when a candle body closes beyond the zone
Wick: FVG is invalidated as soon as a wick touches beyond the zone
█ MULTI-TIMEFRAME SUPPORT
Both FVGs and SNR levels are calculated on the selected timeframe, allowing you to:
Display Daily FVGs with SNR levels on a 1H chart
Identify higher timeframe institutional zones while trading on lower timeframes
Combine multiple instances for multi-timeframe confluence
█ PARAMETERS
SNR Settings:
Line Color / Width: Appearance of SNR levels
Display gap levels: Show/hide gap-based levels
Display opening gaps: Show the gap box between candle close and next open
Display fresh levels only: Hide unfresh/tested levels
Display number of level breaks: Show how many times a level was broken
Evaluate current bar: Include the current (incomplete) bar in freshness calculation
Bars Lookback: Number of bars to scan for levels
Level Regions: Filter levels relative to current price or current bar's High/Low
Levels Above/Below: Maximum number of levels to display in each direction
Max Level Breaks: Hide levels that have been broken more than this number
FVG Settings:
Bullish/Bearish FVG Color: Colors for the FVG boxes
FVG Border Width: Border thickness of FVG boxes
Show FVG Boxes: Toggle FVG box visibility
FVG Invalidation Method: Choose between Body Close or Wick invalidation
Timeframe:
Timeframe: The timeframe for calculating both FVGs and SNR levels
█ HOW TO TRADE WITH THIS INDICATOR
Identify Active FVGs: Look for FVG boxes on your chosen timeframe - these represent institutional imbalance zones
Watch for SNR Levels: When an SNR level appears inside an FVG, this creates a high-confluence zone
Wait for Price to Approach: As price returns to fill the FVG and reaches the SNR level, watch for reaction
Confirm on Lower Timeframe: Switch to a lower timeframe to look for entry signals (rejection wicks, engulfing patterns, break of structure)
Trade the Reaction: At a Bullish FVG with SNR support look for long entries - at a Bearish FVG with SNR resistance look for short entries
The combination of FVG (institutional footprint) with precise SNR levels (exact reaction points) provides a powerful framework for identifying high-probability trade setups.

ICT Concepts [Kodexius]ICT Concepts is an all in one, chart overlay toolkit that combines several widely used ICT style components into a single, modular workflow. It is designed to help you map higher timeframe context, track directional structure, and refine execution areas with imbalance and liquidity concepts, without turning the chart into a cluttered drawing board.
Instead of plotting everything indefinitely, each module focuses on “live relevance” and chart readability. Zones, lines, and labels are managed with sensible limits so the most recent and most meaningful structures remain visible while older objects are automatically retired.
Because the system is modular, you can run it like a complete toolkit:
- Use multi timeframe Order Blocks to define high probability zones
- Use Market Structure (BOS and MSS) for bias and context
- Validate intent with SMT Divergence when you want intermarket confirmation
- Refine with Imbalances (FVG, BPR, CE) and Liquidity Sweeps
- Add timing structure via Killzones and risk structure via auto Fibonacci
🔹 Features
🔸 Multi Timeframe Order Blocks (3 candle displacement OB)
The OB engine detects a strict 3 candle displacement sequence (bull and bear) and projects the “order block candle” as a forward extending zone. Detection can run on the chart timeframe or on a user selected higher timeframe and then be displayed on your execution chart.
🔸 Overlap Control
Before adding a new OB, the script checks overlap against existing zones of the same direction. If a new zone intersects an existing one, it is ignored to reduce redundant stacking in the same price area.
🔸 Automatic Extension and Mitigation for Order Blocks
OB zones extend forward on every bar and are removed once mitigation is confirmed. Mitigation is evaluated by close breaking decisively beyond the relevant boundary:
- Bullish OB mitigates when close prints below the OB bottom
- Bearish OB mitigates when close prints above the OB top
🔸 Market Structure (BOS and MSS)
Market Structure is built from swing pivots using a configurable pivot length. When price closes through the latest swing, the script prints a structure event:
BOS (Break of Structure) for continuation
MSS (Market Structure Shift) for a directional change
To keep the chart readable, older structure drawings are capped by history limits.
🔸 SMT Divergence with optional mini panel
SMT can compare the current instrument with a user selected symbol to highlight divergence at swing points. A divergence is flagged when one market makes a new swing extreme while the other fails to confirm.
Optional: a compact right side “compare symbol” candle panel can be enabled so you can visually confirm what the secondary market is doing without leaving the chart.
🔸 Imbalances: FVG, BPR, and CE modes
You can choose between three imbalance views depending on your style:
FVG mode: Fair Value Gaps are plotted as extending zones
CE mode: Consequent Encroachment is visualized using a midpoint line and a half zone fill
BPR mode: Balanced Price Range is formed when a new FVG overlaps an opposing FVG, producing a “balanced” region that often behaves differently than a standalone gap
🔸 Automatic extension, limits, and mitigation for imbalances
Imbalance objects extend forward until mitigated. Mitigation uses wick based logic:
Bullish imbalance mitigates when price wicks below the zone bottom
Bearish imbalance mitigates when price wicks above the zone top
The script also enforces per side limits and removes older items to keep performance stable.
🔸 Liquidity sweeps (buyside and sellside)
The liquidity module tracks swing highs and lows and marks sweep events when price runs the level and then closes back through it, which often behaves like a rejection signal. Sweeps are visualized with a level line plus a small sweep highlight box, with an optional history cap.
🔸 Auto anchored Fibonacci (EQ and OTE focus)
Fibonacci levels are automatically anchored using the most recent structure context so you do not need to manually re draw fibs every time the market evolves. EQ and OTE focused bands are plotted to support common premium discount style workflows, with optional extra levels if desired.
🔸 Killzones (session boxes with optional range tracking)
Asian, London Open, New York AM, and New York PM killzones can be displayed using UTC-5 session definitions. Session boxes dynamically expand as new highs and lows are formed during the session, and historical zones can be retained up to a user set count. Rendering is restricted to intraday timeframes up to 60 minutes for clean scaling and performance.
🔹 Calculations
1) Order Block detection (3 candle displacement)
The OB pattern is defined inside detectLogic() . The zone boundaries always come from candle (the middle candle of the 3 candle sequence).
detectLogic() =>
bool isBull = open > close and close > open and close > open and low < low and close > high
bool isBear = open < close and close < open and close < open and high > high and close < low
[isBull, high , low , time , isBear, high , low , time ]
Interpretation (bullish side):
Candle is bearish
Candle is bullish (the OB candle)
Current candle is bullish and closes above high
low undercuts low to form the sweep style condition
Bearish logic is the mirrored inverse.
2) Multi timeframe projection and duplicate control
If the timeframe input is set, detections are computed on that timeframe and projected onto the current chart using request.security . A last processed time check prevents duplicate prints.
=
request.security(syminfo.tickerid, i_tf, detectLogic())
var int lastBullTime = 0
var int lastBearTime = 0
if mtf_isBull and mtf_bullTime != lastBullTime
lastBullTime := mtf_bullTime
if mtf_isBear and mtf_bearTime != lastBearTime
lastBearTime := mtf_bearTime
3) OB overlap validation and mitigation
Overlap is checked before pushing a new zone, then zones are extended and removed once mitigated by close.
method hasOverlap(array OBs, float top, float bottom) =>
bool overlap = false
if OBs.size() > 0
for i = 0 to OBs.size() - 1
OB item = OBs.get(i)
if (top < item.top and top > item.bottom) or (bottom > item.bottom and bottom < item.top)
overlap := true
break
overlap
method isMitigated(OB this, float currentClose) =>
this.isBull ? (currentClose < this.bottom) : (currentClose > this.top)
4) Market Structure: pivots, BOS, and MSS
Swings are derived from pivots; then BOS/MSS prints when price crosses the latest swing. The script tracks trend state to decide whether the break is continuation (BOS) or shift (MSS).
float ph = ta.pivothigh(i_structLen, i_structLen)
float pl = ta.pivotlow(i_structLen, i_structLen)
bool brokenHigh = ta.crossover(close, lastHigh)
bool brokenLow = ta.crossunder(close, lastLow)
// drawStructure(..., "BOS", ...) or drawStructure(..., "MSS", ...) depending on trend state
5) SMT Divergence conditions
SMT uses pivot highs/lows on both instruments. A bearish SMT prints when the main chart makes a higher high but the compare symbol fails to exceed its prior high. A bullish SMT prints when the main chart makes a lower low but the compare symbol fails to make a lower low.
bool bearishSmt = not na(smtAHighPrev) and not na(smtBHighPrev) and (smtAHighLast > smtAHighPrev) and (smtBHighLast <= smtBHighPrev)
bool bullishSmt = not na(smtALowPrev) and not na(smtBLowPrev) and (smtALowLast < smtALowPrev) and (smtBLowLast >= smtBLowPrev)
6) FVG detection, BPR construction, and CE level
FVGs are detected via a classic 3 bar gap condition. When a new FVG overlaps an opposing FVG, the script builds a BPR using the intersecting region. CE is the midpoint (top + bottom) / 2, plotted as a dashed line plus a half fill box.
bool fvgBullDetected = low > high
bool fvgBearDetected = high < low
// CE
float ceLevel = (this.top + this.bottom) / 2
Imbalance mitigation uses wick logic:
method isMitigated(FVG this, float currentHigh, float currentLow) =>
this.isBull ? (currentLow < this.bottom) : (currentHigh > this.top)
7) Liquidity sweep trigger
A sweep is confirmed only when price runs the pivot level and closes back through it (reject style).
bool sweepBull = i_showLiq and not na(liqLastLow) and not liqLastLowSwept and low < liqLastLow and close > liqLastLow
bool sweepBear = i_showLiq and not na(liqLastHigh) and not liqLastHighSwept and high > liqLastHigh and close < liqLastHigh
8) Killzone session mapping
Sessions are defined in UTC-5 using time() session strings.
string kzTz = "UTC-5"
kzInSession(string sess) =>
not na(time(timeframe.period, sess, kzTz))
bool inAsian = kzInSession("2000-0000")
bool inLondon = kzInSession("0200-0500")
bool inNY = kzInSession("0830-1100")

RF iFVG MTF V1Inverse Fair Value Gaps (iFVGs) are a powerful confluence because they mark areas where the market first left a clear imbalance (an FVG), then later returned and proved participation by closing fully through that zone. In other words, they often highlight prices where liquidity was exchanged and orderflow “flipped,” making them useful as potential reaction areas for:
The RF iFVG MTF indicator Once confirmed, draws the iFVG zone and is projected forward as an actionable area of interest and remains active until price invalidates the zone. Use this zone from a higher time frame as a POI, or use it on the current chart time frame as an entry model.
You can run it on the current chart timeframe or enable MTF mode to detect iFVGs from a higher timeframe while plotting them directly on your chart for clean top-down context. Includes adjustable gap filtering, and inversion timing (N bars) to adjust the sensitivity of the iFVG logic

VORB DJB Trades V1VORB by DJB Trades (Version 1) is a complete intraday framework built around the New York session Opening Range Breakout (ORB), combined with higher-timeframe VWAPs and precise Fair Value Gap mapping.
This tool is designed to give you context, levels and confluence at a glance – no more stacking 5 different indicators on your chart.
🔶 Core ORB Logic (NY Session)
• Uses the 09:30–09:45 NY time 15-minute ORB range.
• Draws an ORB box from high to low during the ORB window.
• Projects clean high/low ORB lines across the session (up to your chosen end time, default 18:00 NY).
• Displays the ORB size in points above the box
• 1 point = 4 ticks (futures-style logic).
This gives an instant sense of how “wide” or “tight” the opening drive was, and how much room you have for trend or mean-reversion plays.
📐 Daily VWAP (Intraday Bias)
• Custom anchor time (default 18:00, NY session close style).
• Plots Daily VWAP plus +/-1 standard deviation bands.
• Full styling controls: colors, line widths, band fill etc.
• You can limit visibility to specific timeframes via dropdown (e.g. only show on 1–5m, or just intraday).
VWAP +/-1 deviation bands gives you intraday bias and “fair value” zones to frame trades around the ORB.
🕒 Higher Timeframe VWAPs (Weekly, Monthly, Yearly)
All three higher-TF VWAPs are calculated the same way (volume-weighted, streaming) but anchored at different structural points:
• Weekly VWAP – resets at the start of each week
• Monthly VWAP – resets at the start of each month
• Yearly VWAP – resets at the start of each year
Each has:
• Main VWAP line
• ±/-1 standard deviation bands
• Independent color / width / band fill settings
• Timeframe visibility controls (“show from TF” & “show up to TF”) so you can do things like:
⁃ Weekly VWAP only from 5m and above
⁃ Monthly on 1h and higher
⁃ Yearly only on Daily/Weekly/Monthly
Use these as higher-timeframe bias references and key dynamic value areas above/below the ORB.
📊 1m FVGs (Outside ORB & VWAP Bands)
For precision entries:
• Detects 1-minute Fair Value Gaps (classic 3-candle pattern):
⁃ Bullish FVG: low > high
⁃ Bearish FVG: high < low
• Only plots FVGs that are:
⁃ Outside the ORB range, and
⁃ Outside the Daily VWAP +/-1 bands
• FVG boxes are auto-extended to the right (4× original width) for clear “liquidity pockets”.
• Separate colors for bullish and bearish FVGs.
This helps you focus only on “clean” imbalances away from the opening chop and mid-range value.
⚙️ Customisation & Use
• Works best on US indices, FX and futures during the NY session.
• Optimised for 1m–15m ORB trading, but higher-TF VWAPs shine on 5m, 15m, 1h and Daily.
• Every visual element (ORB box, lines, VWAPs, bands, FVGs, label text/bg) is fully customisable in the settings.
⚠️ Disclaimer
This script is for educational and informational purposes only.
It does not constitute financial advice or a signal service.
Always test on a demo account and use your own risk management before trading live.

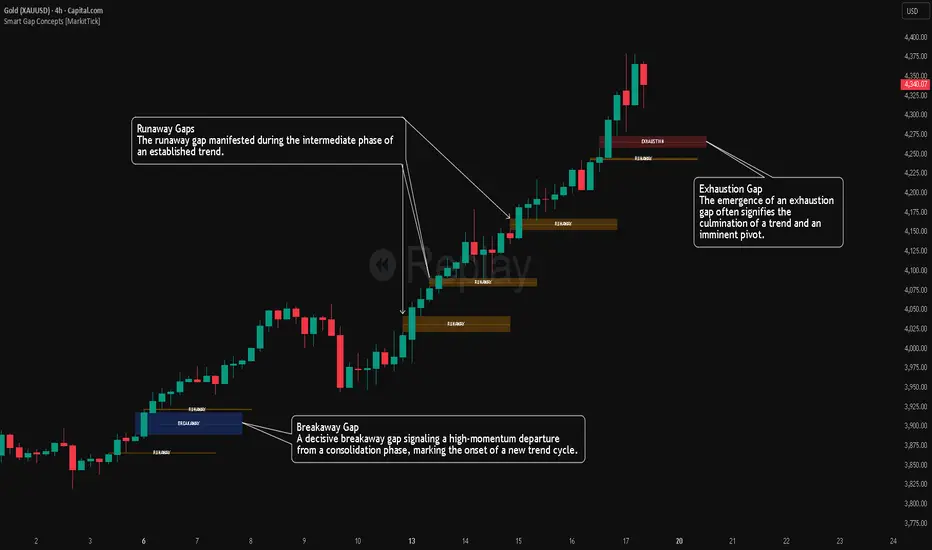
Smart Gap Concepts [MarkitTick]💡 This indicator automates the identification and classification of price gaps, commonly known as Fair Value Gaps (FVG) or Imbalances, by integrating market structure and volume analysis. Unlike standard gap detectors that simply highlight empty space on a chart, this script applies algorithmic filters to categorize gaps into three distinct phases of market movement: Breakaway, Runaway, and Exhaustion. This helps traders understand the potential context of a move rather than just seeing a support or resistance zone.
● Originality and Utility
The primary innovation of this tool is its dynamic classification system. It moves beyond visual detection by checking the "why" behind the gap. By referencing Swing Highs and Swing Lows (Market Structure) alongside Volume efficiency, it determines if a gap represents a breakout, a trend continuation, or a climatic end to a move. Additionally, the script features an automated mitigation tracking system that removes gaps from the chart once price has re-tested the midpoint, ensuring the visual workspace remains clean and relevant to current price action.
● Methodology
The script operates on a multi-stage logic engine:
• Gap Detection
It first identifies the core imbalance where the Low of the current bar does not overlap with the High of the bar two periods prior (for bullish gaps), ensuring the intervening candle represents a strong displacement.
• Structural Analysis (Breakaway Gaps)
The script monitors Pivot Highs and Lows. If a gap occurs simultaneously with a close beyond a key structural Pivot, it is classified as a "Breakaway Gap." This signals the potential start of a new trend.
• Volume and Time Analysis (Exhaustion Gaps)
To identify potential reversals, the script looks for "Trend Maturity." If a gap forms after a long duration since the last pivot and is accompanied by a volume spike (defined by the Volume Spike Multiplier), it is labeled as an "Exhaustion Gap."
• Continuation (Runaway Gaps)
If a gap is valid but meets neither the Breakaway nor Exhaustion criteria, it is considered a "Runaway Gap," typically found in the middle of an established trend.
• Dynamic Cleanup
The script tracks the midpoint of every active gap. If price creates a lower low (for bullish gaps) or higher high (for bearish gaps) beyond this midpoint, the gap is considered mitigated and is removed from the screen.
📖 How to Use
Traders can utilize the color-coded classifications to gauge market intent:
Breakaway (Default Blue): Watch these zones for potential trend initiations. These are often high-probability areas for a retest entry after a structure break.
Runaway (Default Orange): These indicate strong momentum. They can be used to trail stop-losses or add to winning positions, as price should ideally not close below these gaps in a healthy trend.
Exhaustion (Default Red): Be cautious when these appear. They suggest the current move is overextended and a reversal or complex pullback may be imminent.
• Exhaustion Gap : A Practical Case Study
• Breakaway Gap: A Practical Case Study
• Runaway Gap : A Practical Case Study
⚙️ Inputs and Settings
Min Gap Size (Points): Filters out insignificant gaps smaller than this threshold.
Structure Lookback: Defines the sensitivity of the Pivot detection (Swing High/Low).
Volume Avg Length & Multiplier: Determines what qualifies as a "Volume Spike" for exhaustion logic.
Trend Maturity: The minimum number of bars required to consider a trend "old" enough for an exhaustion signal.
Visual Settings: Custom colors for each gap type and box extension length.
● Disclaimer
All provided scripts and indicators are strictly for educational exploration and must not be interpreted as financial advice or a recommendation to execute trades. I expressly disclaim all liability for any financial losses or damages that may result, directly or indirectly, from the reliance on or application of these tools. Market participation carries inherent risk where past performance never guarantees future returns, leaving all investment decisions and due diligence solely at your own discretion.
MTF Fair Value GapsMTF Fair Value Gaps (MTF FVGs) plots Fair Value Gaps from up to 4 user-selectable higher timeframes directly on your chart.
Multi-timeframe support: Enable/disable each timeframe independently (e.g., 15m / 1h / 4h / 1D).
Clean chart mode: Show only the N closest bullish + bearish gaps per timeframe (reduces clutter).
Mitigation options: Choose how/when gaps are considered filled and automatically removed.
CE (0.5) midpoint line: Optional display with customizable style and width.
Per-timeframe colors: One color per timeframe (bull/bear share the same color).
Right-edge extension: Shift the right edge by X chart candles to keep gaps visible ahead of price.

Daytrading Suite: Neon TPO + FVG v6.1Here is the summary of the code and the trading guide in English.
---
### 1. Code Summary: What does the chart show?
The script combines three dimensions of trading into a single chart:
* **The Context (TPO / Market Profile - Yesterday):**
* **Gold Zone (Center):** Yesterday's **POC (Point of Control)**. This was the "fairest price". It often acts as a magnet.
* **White Dashed Lines:** The **VAH (Value Area High)** and **VAL (Value Area Low)**. Yesterday, 70% of all trading volume happened between these lines. This is the area of "Balance".
* **The Structure (HTF - 1 Hour+):**
* **Red/Green Boxes (Right Edge):** Automatic **Supply & Demand Zones** based on the 1-hour chart (or your setting). They indicate major resistance and support levels.
* **The Timing (Entries):**
* **Neon FVG Boxes (Small):** "Fair Value Gaps". These represent imbalances in price. If price revisits these, it is often your **entry signal**.
* **Lines (VWAP, EMA, PDH/PDL):** Act as dynamic support and trend indicators.
---
### 2. Trading Strategy: How to use it
Do not just trade every colored spot. You must combine **Location (TPO)** with **Signal (FVG)**.
#### Step A: The Open (Where are we?)
In the morning (or at the US Open), check where the price is relative to the **white TPO lines**.
1. **Inside the White Lines (In Balance):**
* The market is undecided. Expect ranging/choppy behavior.
* **Strategy:** Buy at the bottom edge (VAL), Sell at the top edge (VAH). The target is often the Gold Zone (POC) in the middle.
2. **Outside the White Lines (Imbalance):**
* The market is seeking new prices. Danger of a Trend!
* **Strategy:** If price breaks above VAH and tests it from above -> **Long**. If it breaks below VAL -> **Short**.
#### Step B: The Setup (The High Probability Scenario)
Here is the "Rejection" Setup (Long Example):
1. Price drops to the lower white line (**VAL**) or into a green **Demand Zone**.
2. It bounces (shows a wick).
3. In the process, a small **green Neon FVG** is formed.
4. **Entry:** Limit Order at the top of the Neon FVG.
5. **Target:** The Gold Zone (POC) or the upper white line (VAH).
6. **Stop Loss:** Below the recent swing low.
#### Step C: Warning Signals (When NOT to trade)
* **In "No Man's Land":** If the price is sitting right in the middle between Gold (POC) and White (VAH/VAL), do nothing. The risk is 50/50. Wait until price hits an edge.
* **Against the Flow:** If EMA 9 and 21 are pointing steeply downwards, do not buy blindly at the VAL just because the line is there. Wait for confirmation (FVG).
### Pre-Trade Checklist:
1. **Level:** Am I at a white line (VAH/VAL) or the Gold Zone (POC)?
2. **Structure:** Do I have an HTF Demand/Supply Zone backing me up?
3. **Trigger:** Do I see a Neon FVG pointing in my direction?

Fair Value Gap [Tradeuminati]Fair Value Gap
Fair Value Gap is a clean and rule-based Fair Value Gap indicator for TradingView, designed to display only valid and confirmed Fair Value Gaps (FVGs) and Inverted Fair Value Gaps (iFVGs).
The indicator is built on a strict 3-candle FVG definition and operates exclusively on candle close, ensuring no repainting and no premature signals.
🔹 Key Features
Valid Fair Value Gaps (FVG)
- Detects bullish and bearish Fair Value Gaps using a precise 3-candle structure
- FVGs are only plotted after the confirming candle has closed
- A Fair Value Gap remains visible only as long as it is valid
- Once price closes beyond the FVG, it is removed or converted
Inverted Fair Value Gaps (iFVG)
- When a valid FVG is invalidated by a candle close, it can be converted into an iFVG
- iFVGs retain the original price range and structure
- Only valid iFVGs are displayed
- As soon as price closes through an iFVG, it is automatically removed
Clean & Controlled Visualization
- Only the last N active FVGs are displayed (bullish + bearish combined)
- Only the last N valid iFVGs are shown
- Boxes automatically extend to the current price + configurable bars
- Labels are dynamically positioned at the right edge of each zone
🔹 Technical Notes
- No repainting
- No intrabar signals
- Close-based validation only
- Works on all markets and timeframes
- Lightweight and performance-friendly
⚠️ Disclaimer
This indicator is for technical analysis purposes only and does not constitute trading or investment advice.

Structure Lite - Automatic Major Trend LinesStructure Lite – Pivot-Based Market Structure Visualization
OVERVIEW
Structure Lite is an open-source charting tool designed to assist traders in visualizing higher-timeframe market structure. The script identifies major swing points using high-period pivot analysis and projects structural support and resistance lines directly on the chart. Its purpose is to highlight persistent market structure while minimizing visual noise.
CORE CONCEPTS & CALCULATIONS
Pivot Identification
The script uses Pine Script’s built-in ta.pivothigh() and ta.pivotlow() functions to identify confirmed swing highs and lows. A pivot is only validated after a user-defined number of bars (Major Pivot Lookback) have formed on both sides of the price extreme, ensuring that only structurally significant pivots are selected.
Structural Pairing
Each structural line is created only after two consecutive pivots of the same type are confirmed (high-to-high or low-to-low). The script stores the price and bar index of these pivots and uses them as fixed anchor points.
Line Projection
Once a valid pivot pair is formed, the script draws a line between the two points using line.new() and extends it forward using extend.right. These lines represent projected structural boundaries rather than trade signals.
Object Management
To maintain chart clarity and performance, the script manages all drawn objects through a line array. A FIFO (First-In, First-Out) method is applied so that only the three most recent structural lines remain visible. Older lines are automatically deleted as new ones are created.
DESIGN PHILOSOPHY & ORIGINALITY
While many indicators plot frequent swing points or short-term pivots, Structure Lite focuses on structural persistence. By filtering for higher-period pivots and limiting the number of displayed projections, the script emphasizes dominant market structure rather than short-term fluctuations. This approach is intended to support discretionary analysis, not replace it.
HOW TO USE
Major Pivot Lookback
Increase the value to focus on higher-timeframe structure (e.g., swing or position trading).
Decrease the value to visualize intraday structural levels.
Visual Encoding
Green lines represent projected structural support
Red lines represent projected structural resistance
Visibility Control
A boolean input allows all structure lines to be hidden instantly to restore a clean price chart.
LIMITATIONS & DISCLAIMER
This script is a visualization tool only. It does not generate trade signals, entry or exit points, alerts, or directional forecasts. All plotted levels are derived from historical price action and may change as new pivots form. The script is provided for educational and analytical purposes and should be used in conjunction with other forms of market analysis

FairValueGap [Tradeuminati]Tradeuminati – (i)FVG is a free Fair Value Gap indicator for TradingView, built on a precise 3-candle structure and extended with Inverted Fair Value Gaps (iFVG) and an optional structure-based trend overview.
The indicator focuses exclusively on confirmed market structure, avoiding repainting and intrabar signals.
🔹 Features Overview
Fair Value Gaps (FVG)
- Detection of bullish and bearish Fair Value Gaps using a 3-candle formation
- FVGs are only displayed after the confirming candle has closed
- A Fair Value Gap remains valid until it is invalidated by a candle close
- Fully customizable colors, labels, and right-side extension
Trend Detection (Optional)
- Structure-based trend analysis on the 15-minute and 1-hour timeframes
- Trend is defined using Swing Highs and Swing Lows:
--> Higher Highs + Higher Lows → Uptrend
--> Lower Highs + Lower Lows → Downtrend
- Swing definition: center candle with X candles to the left and right (default: 1, fully adjustable)
- Trend is displayed in a compact trend table in the top-right corner
- Visual trend representation:
▲ Green = Uptrend
▼ Red = Downtrend
– Neutral / not yet confirmed
- Trend table can be enabled or disabled via settings
🔹 Technical Characteristics
- No repainting
- No intrabar signals
- Only confirmed candle closes are used
- Works on all markets and all timeframes
- Lightweight and performance-friendly
🔹 Use Case
This indicator is designed for traders who work with Price Action, Smart Money Concepts, market structure, or liquidity-based trading models, and who require a clear and reliable visualization of Fair Value Gaps and market trend.
⚠️ Disclaimer
This indicator does not provide trading or investment advice.
It is intended solely for technical chart analysis and decision support.

ICT Unicorn Model [Kodexius]ICT Unicorn Model is a market structure and imbalance confluence tool that automatically detects high probability “Unicorn” setups by combining three key elements into a single, clean script:
-A first, clean break of that swing level (displacement style break)
-A Fair Value Gap that overlaps a breaker candle body range
Instead of plotting every pivot or every imbalance independently, the script waits for a specific sequence: price establishes a valid swing, breaks that swing for the first time, and prints a setup only when the resulting context aligns with a valid, volatility filtered FVG and a clearly defined breaker range.
Each detected setup is drawn directly on the chart with labeled zones (Breaker and FVG) and is then actively monitored. If price violates the breaker boundary based on your chosen invalidation basis (Close or Wick), the setup is marked inactive and can optionally be removed to keep the chart clean.
This indicator is designed for traders who work with ICT style concepts such as liquidity runs, displacement, breaker blocks, and imbalance reversion, and who want a structured, rules based visualization rather than discretionary drawing.
🔹 Features
🔸 Fair Value Gap Detection With Volatility Filtering
Bullish and bearish FVGs are detected using classic three candle imbalance logic. To avoid low quality gaps during compression, the script applies an ATR based minimum size filter using the “FVG Min Size (ATR Multiplier)” input. Only gaps larger than ATR * threshold are considered valid.
🔸 First Break Validation (Clean Break Logic)
A key part of the model is identifying a “first break” of a swing level. The script checks whether the swing price has already been invalidated between the swing bar and the current bar. If it has, the swing is ignored. This helps reduce repeated signals and focuses on fresh structural breaks.
🔸 Breaker and FVG Confluence With Overlap Requirement
After a valid break occurs, the script defines a breaker range using the body of the swing candle (open and close). A setup is only created if this breaker body range overlaps the detected FVG price range. This overlap requirement is what filters many “almost” conditions and keeps signals more selective.
Bullish Unicorn:
Bearish Unicorn:
🔸 Configurable Invalidation Basis (Close or Wick)
You can choose how a setup fails:
-Close: invalidation requires a candle close beyond the breaker boundary
-Wick: invalidation occurs as soon as any wick crosses beyond the breaker boundary
This allows the tool to adapt to different trading styles, from conservative confirmation to more sensitive risk control.
🔸 Automatic Cleanup of Failed Setups
If “Delete Invalidated Setups” is enabled, the script removes the breaker box, FVG box, and label as soon as the setup is invalidated. If disabled, the zones remain visible for review while the setup is marked inactive internally.
🔸 Clear Chart Visuals
Each setup plots:
-A labeled Breaker zone box
-A labeled FVG zone box
-A directional Unicorn label (Bull or Bear) that updates position as the chart advances
Colors for bullish and bearish structures are fully configurable.
🔸 Alert Conditions
Two alert conditions are provided:
-Bullish Unicorn Setup Detected
-Bearish Unicorn Setup Detected
Alerts trigger only on the bar a new setup is created.
🔹 Calculations
This section summarizes the main computations used internally. The goal here is to explain the model mechanics rather than reproduce every implementation detail.
1. Swing Detection (Pivot High / Pivot Low)
Swing levels are detected using a symmetric pivot definition with “Swing Length” bars on both sides:
float ph = ta.pivothigh(high, swingLength, swingLength)
float pl = ta.pivotlow(low, swingLength, swingLength)
When a pivot is confirmed, its price and originating bar index are stored:
-Swing High: price = pivot high, isHigh = true
-Swing Low: price = pivot low, isHigh = false
The script keeps a limited history (most recent swings) to stay efficient.
2. Fair Value Gap Detection
FVGs use the classic three candle displacement imbalance:
Bullish FVG condition
bool isBullFVG = high < low
Bullish gap range is defined as:
-Top = low
-Bottom = high
Bearish FVG condition
bool isBearFVG = low > high
Bearish gap range is defined as:
-Top = low
-Bottom = high
3. ATR Based Minimum Gap Filter
ATR is computed (length 14), then the gap size is compared against a user threshold:
float atr = ta.atr(14)
bool validBullFVG = isBullFVG and (bullFvgTop - bullFvgBot) > (atr * fvgThreshold)
bool validBearFVG = isBearFVG and (bearFvgTop - bearFvgBot) > (atr * fvgThreshold)
This prevents very small imbalances from generating setups in low volatility conditions.
4. “First Break” Check Using Level Invalidation Scan
Before accepting a swing break, the script scans forward from the swing bar to the current bar to confirm the level has not already been breached. The scan can be based on wick or close:
-Wick mode: uses high or low
-Close mode: uses close
Conceptually:
priceToCheck = mode == "Wick" ? (checkBelow ? low : high) : close
If a prior breach is found, the swing is treated as already invalidated and is ignored for setup creation.
5. Break Of Structure Condition
Bullish break requirement
A bullish setup requires breaking a stored swing high with bullish body intent:
-close > swingHighPrice
-open < close
Bearish break requirement
A bearish setup requires breaking a stored swing low with bearish body intent:
-close < swingLowPrice
-open > close
An additional proximity filter is applied in the bearish branch to reduce weak or overly extended breaks by requiring the prior close to be reasonably near the swing level.
6. Breaker Range Construction
Once a qualifying swing is found, the breaker range is derived from the body of the swing candle (the candle at the swing bar index). The body boundaries are:
float breakerTop = math.max(bOpen, bClose)
float breakerBot = math.min(bOpen, bClose)
This models the breaker as the candle body range rather than full wick range, which typically produces more practical invalidation boundaries.
7. Overlap Test Between Breaker and FVG
A setup is only created if the breaker body overlaps the FVG zone. Conceptually the script rejects cases where one range is fully above or fully below the other:
-If there is no overlap, no setup is created
-If overlap exists, the Unicorn setup is valid
8. Active Monitoring and Invalidation
Each setup remains active until invalidated. Invalidation is evaluated every bar using your selected basis:
-Close basis: compares close to breaker boundary
-Wick basis: compares high or low to breaker boundary
Bullish invalidation
Setup fails if price crosses below breaker bottom.
Bearish invalidation
Setup fails if price crosses above breaker top.
If deletion is enabled, all drawings related to that setup are removed immediately on invalidation.
9. Drawing Updates and Object Lifecycle
Breaker and FVG boxes are extended to the right while the setup is active to keep zones visible into the near future. The Unicorn label is also repositioned as new bars print so the most recent context stays readable.

FVG Heatmap [Hash Capital Research]FVG Map
FVG Map is a visual Fair Value Gap (FVG) mapping tool built to make displacement imbalances easy to see and manage in real time. It detects 3-candle FVG zones, plots them as clean heatmap boxes, tracks partial mitigation (how much of the zone has been filled), and summarizes recent “fill speed” behavior in a small regime dashboard.
This is an indicator (not a strategy). It does not place trades and it does not publish performance claims. It is a market-structure visualization tool intended to support discretionary or systematic workflows.
What this script detects
Bullish FVG (gap below price)
A bullish FVG is detected when the candle from two bars ago has a high below the current candle’s low.
The zone spans from that prior high up to the current low.
Bearish FVG (gap above price)
A bearish FVG is detected when the candle from two bars ago has a low above the current candle’s high.
The zone spans from the current high up to that prior low.
What makes it useful
Heatmap zones (clean, readable FVG boxes)
Bullish zones plot below price. Bearish zones plot above price.
Partial fill tracking (mitigation progress)
As price trades back into a zone, the script visually shows how much of the zone has been filled.
Mitigation modes (your definition of “filled”)
• Full Fill: price fully trades through the zone
• 50% Fill: price reaches the midpoint of the zone
• First Touch: price touches the zone one time
Optional auto-cleanup
Optionally remove zones once they’re mitigated to keep the chart clean.
Fill-Speed Regime Dashboard
When zones get mitigated, the script records how many bars it took to fill and summarizes the recent environment:
• Average fill time
• Median fill time
• % fast fills vs % slow fills
• Regime label: choppy/mean-revert, trending/displacement, or mixed
How to use
Use FVG zones as structure, not guaranteed signals.
• Bullish zones are often watched as potential support on pullbacks.
• Bearish zones are often watched as potential resistance on rallies.
The fill-speed dashboard helps provide context: fast fills tend to appear in more rotational conditions, while slow fills tend to appear in stronger trend/displacement conditions.
Alerts
Bullish FVG Created
Bearish FVG Created
Notes
FVGs are not guaranteed reversal points. Fill-speed/regime is descriptive of recent behavior and should be treated as context, not prediction. On realtime candles, visuals may update as the bar forms.

Market Structure HighLow + Liquidity [MaB]📊 Market Structure HighLow + Liquidity A comprehensive indicator combining precision market structure analysis with real-time liquidity zone detection, built on a custom finite-state machine architecture.
━━━━━━━━━━━━━━━━━━━━━━━━━━━━━━━━━━━━━━━━
🎯 KEY FEATURES
• Automatic Swing Detection Identifies structural High/Low points using a dual-confirmation system (minimum candles + pullback percentage)
• Smart Trend Tracking Automatically switches between Uptrend (Higher Highs & Higher Lows) and Downtrend (Lower Highs & Lower Lows)
• Breakout Alerts Visual markers for confirmed breakouts (Br↑ / Br↓) with configurable threshold
• Sequential Labeling Clear numbered labels (L1, H2, L3, H4...) showing the exact market structure progression
• Color-Coded Structure Lines
• Green: Uptrend continuation legs
• Red: Downtrend continuation legs
• Gray: Trend inversion points
• Imbalance Zones (FVG) Automatically detects Fair Value Gaps that form during impulsive moves between validated swing points
• Inducement Zones Identifies potential liquidity traps - FVGs that form before breakout confirmation, often used as stop-hunt areas
• Dynamic Zone Management Zones automatically close when price touches them, with configurable retracement sensitivity
━━━━━━━━━━━━━━━━━━━━━━━━━━━━━━━━━━━━━━━━
🔬 TECHNICAL ARCHITECTURE
This indicator does NOT rely on TradingView's built-in ta.pivothigh() / ta.pivotlow() functions.
Instead, it implements a custom finite-state machine (FSM) that manages multiple monitoring states, alternating dynamically between Uptrend and Downtrend modes based on confirmed breakouts.
Core Components:
• State Machine Engine Multiple internal states handle candidate detection, validation, and confirmation phases. The system transitions between states based on price action triggers and confirmation criteria.
• Dual-Confirmation System Each swing point must satisfy two independent filters before validation:
o Time-based filter (minimum candles)
o Price-based filter (minimum retracement %)
• Directional Breakout Logic Separate breakout detection routines for uptrend continuation, downtrend continuation, and trend inversion scenarios. Each triggers specific state transitions.
• FVG Classification Engine Automatically distinguishes between Imbalance zones (post-confirmation FVGs) and Inducement zones (pre-confirmation FVGs) based on breakout timing context.
• Dynamic Zone Lifecycle Zones are created, monitored, and closed through a managed lifecycle with configurable touch sensitivity.
━━━━━━━━━━━━━━━━━━━━━━━━━━━━━━━━━━━━━━━━
⚙️ CONFIGURABLE PARAMETERS
Market Structure
• Analysis Start Date: Define when to begin structure analysis
• Min Confirmation Candles: Required candles for validation (default: 3)
• Pullback Percentage: Minimum retracement for confirmation (default: 10%)
• Breakout Threshold: Percentage beyond structure for breakout (default: 1%)
Liquidity
• Show Zones: Toggle visibility of imbalance and inducement zones
• Zone Colors: Customize colors for Supply/Demand imbalances and inducements
• Zone Retracement %: How deep price must enter zone to consider it touched (0-100%)
• Inactive Zones Transparency: Visual distinction for closed zones
Display
• Show Market Structure Table: Toggle info panel
• Replay Mode: Optimize for TradingView Replay feature
━━━━━━━━━━━━━━━━━━━━━━━━━━━━━━━━━━━━━━━━
🎨 ZONE COLOR CODING
• 🔴 Imbalance Supply (Red): Bearish FVG - potential resistance/short entry
• 🟢 Imbalance Demand (Green): Bullish FVG - potential support/long entry
• 🟠 Inducement Supply (Orange): Pre-breakout bearish FVG - possible stop-hunt zone
• 🔵 Inducement Demand (Blue): Pre-breakout bullish FVG - possible stop-hunt zone
━━━━━━━━━━━━━━━━━━━━━━━━━━━━━━━━━━━━━━━━
💡 HOW IT WORKS
1. Initializes state machine in UPTREND mode, searching for first swing Low
2. Tracks price movement and triggers candidate states upon potential reversals
3. Validates candidates through dual-confirmation (time + price filters)
4. Upon confirmation, scans price range for FVG patterns (3-candle gaps)
5. Classifies detected FVGs based on breakout timing (Inducement vs Imbalance)
6. Monitors breakout levels - triggers state transitions on confirmed breaks
7. Alternates between Uptrend/Downtrend modes based on breakout direction
8. Manages zone lifecycle - closes zones when price retraces into them
━━━━━━━━━━━━━━━━━━━━━━━━━━━━━━━━━━━━━━━━
🔧 BEST USED FOR
• Identifying key support/resistance levels with liquidity context
• Spotting potential reversal zones (imbalances)
• Avoiding stop-hunt traps (inducement awareness)
• Trend direction confirmation
• Breakout trading setups with confluence
• Multi-timeframe structure and liquidity analysis
• Understanding where institutional orders may be resting
━━━━━━━━━━━━━━━━━━━━━━━━━━━━━━━━━━━━━━━━
⚠️ NOTES
• Works best on higher timeframes (1H+) for cleaner structure
• Inducement zones often convert to Imbalance zones after breakout confirmation
• Zone Retracement % allows fine-tuning: 0% = first touch, 25% = quarter penetration, 100% = full traversal
• Inactive zones remain visible (faded) to show historical liquidity levels
• Use Replay Mode when backtesting to prevent buffer overflow errors

FVG vertical Created by Alphaomega18
🎯 What is an FVG (Fair Value Gap)?
A Fair Value Gap is a price imbalance created by a mismatch between buyers and sellers, formed by 3 consecutive candles where:
Bullish FVG: The low of the current candle is above the high of the candle 2 periods ago
Bearish FVG: The high of the current candle is below the low of the candle 2 periods ago
⚙️ Indicator Settings
Display Group:
Show Bullish vertical FVG: Display bullish vertical FVGs (green) ✅
Show Bearish vertical FVG: Display bearish vertical FVGs (red) ✅
Box Extension (bars): Zone extension duration (1-50 bars, default: 10)
Show Labels: Display labels with gap size 🏷️
Remove When Filled: Automatically remove filled zones ✅
📊 Visual Elements
FVG Zones:
🟢 Green = Bullish vertical FVG (potential support zone)
🔴 Red = Bearish vertical FVG (potential resistance zone)
Labels:
Show gap size in points
Positioned at the beginning of each zone
Dashboard (top right corner):
Real-time count of active FVGs
🟢 = Number of bullish vertical FVGs
🔴 = Number of bearish vertical FVGs
Candle Coloring:
Light green background = Candle forming a bullish vertical FVG
Light red background = Candle forming a bearish vertical FVG
🎯 How to Use the Indicator
1. Installation:
Open TradingView
Click "Indicators" at the top of the chart
Search for "FVG Clean" or paste the code in the Pine Editor
2. Trading Strategies:
Support/Resistance:
Bullish vertical FVGs act as support zones
Bearish vertical FVGs act as resistance zones
Price tends to return to "fill" these gaps
Position Entries:
Long: Wait for a return to a bullish vertical FVG + confirmation
Short: Wait for a return to a bearish vertical FVG + confirmation
Position Management:
Place stops below/above FVGs
Use FVGs as price targets
A filled FVG loses its validity
🔔 Alerts
The indicator includes 2 configurable alert types:
Bullish vertical FVG: Triggers when a new bullish vertical FVG forms
Bearish vertical FVG: Triggers when a new bearish vertical FVG forms
To configure: Right-click on chart → "Add Alert" → Select desired alert
💡 Usage Tips
✅ Do:
Combine with other indicators (volume, momentum)
Wait for confirmation before entering
Use across multiple timeframes
Respect your risk management
❌ Don't:
Trade solely on FVGs without confirmation
Ignore the overall market trend
Overload your chart with too many zones
🔧 Parameter Optimization
Scalping (1-5min):
Box Extension: 5-10 bars
Remove When Filled: Enabled
Day Trading (15min-1H):
Box Extension: 10-20 bars
Remove When Filled: Enabled
Swing Trading (4H-Daily):
Box Extension: 20-50 bars
Remove When Filled: As preferred
📈 Performance
Maximum 100 FVGs of each type in memory
Automatic removal of oldest ones
Optimized to not slow down your chart
Compatible with all markets and timeframes

Fair Value Gap Signals [Kodexius]Fair Value Gap Signals is an advanced market structure tool that automatically detects and tracks Fair Value Gaps (FVGs), evaluates the quality of each gap, and highlights high value reaction zones with visual metrics and signal markers.
The script is designed for traders who focus on liquidity concepts, order flow and mean reversion. It goes beyond basic FVG plotting by continuously monitoring how price interacts with each gap and by quantifying three key aspects of each zone:
-Entry velocity inside the gap
-Volume absorption during tests
-Structural integrity and depth of penetration
The result is a dynamic, information rich visualization of which gaps are being respected, which are being absorbed, and where potential reversals or continuations are most likely to occur.
All visual elements are configurable, including the maximum number of visible gaps per direction, mitigation method (close or wick) and an ATR based filter to ignore insignificant gaps in low volatility environments.
🔹 Features
🔸 Automated Fair Value Gap Detection
The script detects both bullish and bearish FVGs based on classic three candle logic:
Bullish FVG: current low is strictly above the high from two bars ago
Bearish FVG: current high is strictly below the low from two bars ago
🔸 ATR Based Gap Filter
To avoid clutter and low quality signals, the script can ignore very small gaps using an ATR based filter.
🔸Per Gap State Machine and Lifecycle
Each gap is tracked with an internal status:
Fresh: gap has just formed and has not been tested
Testing: price is currently trading inside the gap
Tested: gap was tested and left, waiting for a potential new test
Rejected: price entered the gap and then rejected away from it
Filled: gap is considered fully mitigated and no longer active
This state machine allows the script to distinguish between simple touches, multiple tests and meaningful reversals, and to trigger different alerts accordingly.
🔸 Visual Ranking of Gaps by Metrics
For each active gap, three additional horizontal rank bars are drawn on top of the gap area:
Rank 1 (Vel): maximum entry velocity inside the gap
Rank 2 (Vol): relative test volume compared to average volume
Rank 3 (Dpt): remaining safety of the gap based on maximum penetration depth
These rank bars extend horizontally from the creation bar, and their length is a visual score between 0 and 1, scaled to the age of the gap. Longer bars represent stronger or more favorable conditions.
🔸Signals and Rejection Markers
When a gap shows signs of rejection (price enters the gap and then closes away from it with sufficient activity), the script can print a signal label at the reaction point. These markers summarize the internal metrics of the gap using a tooltip:
-Velocity percentage
-Volume percentage
-Safety score
-Number of tests
🔸 Flexible Mitigation Logic (Close or Wick)
You can choose how mitigation is defined via the Mitigation Method input:
Close: the gap is considered filled only when the closing price crosses the gap boundary
Wick: a full fill is detected as soon as any wick crosses the gap boundary
🔸 Alert Conditions
-New FVG formed
-Price entering a gap (testing)
-Gap fully filled and invalidated
-Rejection signal generated
🔹Calculations
This section summarizes the main calculations used under the hood. Only the core logic is covered.
1. ATR Filter and Gap Size
The script uses a configurable ATR length to filter out small gaps. First the ATR is computed:
float atrVal = ta.atr(atrLength)
Gap size for both directions is then measured:
float gapSizeBull = low - high
float gapSizeBear = low - high
If useAtrFilter is enabled, gaps smaller than atrVal are ignored. This ties the minimum gap size to the current volatility regime.
2. Fair Value Gap Detection
The basic FVG conditions use a three bar structure:
bool fvgBull = low > high
bool fvgBear = high < low
For bullish gaps the script stores:
-top as low of the current bar
-bottom as high
For bearish gaps:
-top as high of the current bar
-bottom as low
This defines the price range that is considered the imbalance area.
3. Depth and Safety Score
Depth measures how far price has penetrated into the gap since its creation. For each bar, the script computes a currentDepth and updates the maximum depth:
float currentDepth = 0.0
if g.isBullish
if l < g.top
currentDepth := g.top - l
else
if h > g.bottom
currentDepth := h - g.bottom
if currentDepth > g.maxDepth
g.maxDepth := currentDepth
The safety score expresses how much of the gap remains intact:
float depthRatio = g.maxDepth / gapSize
float safetyScore = math.max(0.0, 1.0 - depthRatio)
safetyScore near 1: gap is mostly untouched
safetyScore near 0: gap is mostly or fully filled
4. Velocity Metric
Velocity captures how aggressively price moves inside the gap. It is based on the body to range ratio of each bar that trades within the gap and rewards bars that move in the same direction as the gap:
float barRange = h - l
float bodyRatio = math.abs(close - open) / barRange
float directionBonus = 0.0
if g.isBullish and close > open
directionBonus := 0.2
else if not g.isBullish and close < open
directionBonus := 0.2
float currentVelocity = math.min(bodyRatio + directionBonus, 1.0)
The gap keeps track of the strongest observed value:
if currentVelocity > g.maxVelocity
g.maxVelocity := currentVelocity
This maximum is later used as velScore when building the velocity rank bar.
5. Volume Accumulation and Volume Score
While price is trading inside a gap, the script accumulates the traded volume:
if isInside
g.testVolume += volume
It also keeps track of the number of tests and the volume at the start of the first test:
if g.status == "Fresh"
g.status := "Testing"
g.testCount := 1
g.testStartVolume := volume
An average volume is computed using a 20 period SMA:
float volAvg = ta.sma(volume, 20)
The expected volume is approximated as:
float expectedVol = volAvg * math.max(1, (bar_index - g.index) / 2)
The volume score is then:
float volScore = math.min(g.testVolume / expectedVol, 1.0)
This produces a normalized 0 to 1 metric that shows whether the gap has attracted more or less volume than expected over its lifetime.
6. Rank Bar Scaling
All three scores are projected visually along the time axis as horizontal bars. The script uses the age of the gap in bars as the maximum width:
float maxWidth = math.max(bar_index - g.index, 1)
Then each metric is mapped to a bar length:
int len1 = int(math.max(1, maxWidth * velScore))
g.rankBox1.set_right(g.index + len1)
int len2 = int(math.max(1, maxWidth * volScore))
g.rankBox2.set_right(g.index + len2)
int len3 = int(math.max(1, maxWidth * safetyScore))
g.rankBox3.set_right(g.index + len3)
This creates an intuitive visual representation where stronger metrics produce longer rank bars, making it easy to quickly compare the relative quality of multiple FVGs on the chart.

Rolling Volume Profile [Matrix Volume Heatmap] by NXT2017Description
This indicator offers a unique visual approach to Volume Profile analysis. Instead of the traditional histogram bars or boxes, this script renders a Rolling Volume Profile as a background "Matrix Heatmap" directly on your chart.
By dividing the price action of the most recent N-candles into 30 horizontal zones (buckets), it visualizes where the most trading activity has occurred within your defined lookback period. The visualization uses dynamic transparency to highlight the Point of Control (POC) and high-volume nodes, while fading out low-volume areas.
🧠 How it Works
The script operates on a "Rolling Window" basis, meaning it recalculates the profile at every bar to reflect the immediate market context.
Dynamic Range: It calculates the highest High and lowest Low of the user-defined Lookback Length (default: 1000 bars).
Bucket Slicing: This vertical range is divided into 30 equal price buckets.
Volume Distribution (Overlap Logic): The script iterates through the historical data. If a candle is large and spans multiple buckets, its volume is distributed proportionally across those buckets. This ensures a more realistic profile compared to simply assigning volume to the close price.
Heatmap Visualization:
The script calculates the Maximum Volume (POC) within the profile.
It uses a Reference Length to normalize this maximum.
Dynamic Opacity: Zones with volume close to the maximum are rendered opaque (solid). Zones with low relative volume become highly transparent. This creates an automatic "Heatmap" effect, allowing you to instantly spot the most significant price levels.
⚙️ Settings
Lookback Length (candles): Defines how far back the profile calculates volume (e.g., 1000 bars).
POC Reference Length: Defines the smoothing window for the 100% volume baseline. Increasing this stabilizes the color changes; decreasing it makes the heatmap more reactive to sudden volume spikes.
Profil Color: Choose the base color for the matrix. The transparency is calculated automatically.
💡 Use Case
This tool is ideal for traders who want to see the "Value Area" of the current range without cluttering the chart with complex boxes or side-bars. It works excellent as a background context tool to identify:
High Volume Nodes (Support/Resistance)
Low Volume Nodes (Price gaps/Rejection areas)
Migrating Points of Control (Trend direction)

CK FVGThis indicator automatically finds bullish and bearish Fair Value Gaps and shows you which ones still matter — without you drawing anything.
What it does:
Marks every new FVG on the chart
Shows bullish (green) and bearish (red) gaps
Removes gaps once they’re mitigated (filled)
Highlights rejections when price taps the FVG and shoots away
Option to only show the last few unmitigated FVGs
Works on any timeframe
Extra features:
Dashboard showing total FVGs + mitigation %
Alert system for new FVGs and mitigations
Static or dynamic gap mode depending on your preference
Why traders like it:
No more drawing FVG boxes manually
Helps spot clean reaction zones
Perfect for ICT-style setups, liquidity plays, and reversals
Simple, clean, and does all the FVG work for you.
