Order Block Volumatic FVG StrategyInspired by: Volumatic Fair Value Gaps —
License: CC BY-NC-SA 4.0 (Creative Commons Attribution–NonCommercial–ShareAlike).
This script is a non-commercial derivative work that credits the original author and keeps the same license.
What this strategy does
This turns BigBeluga’s visual FVG concept into an entry/exit strategy. It scans bullish and bearish FVG boxes, measures how deep price has mitigated into a box (as a percentage), and opens a long/short when your mitigation threshold and filters are satisfied. Risk is managed with a fixed Stop Loss % and a Trailing Stop that activates only after a user-defined profit trigger.
Additions vs. the original indicator
✅ Strategy entries based on % mitigation into FVGs (long/short).
✅ Lower-TF volume split using upticks/downticks; fallback if LTF data is missing (distributes prior bar volume by close’s position in its H–L range) to avoid NaN/0.
✅ Per-FVG total volume filter (min/max) so you can skip weak boxes.
✅ Age filter (min bars since the FVG was created) to avoid fresh/immature boxes.
✅ Bull% / Bear% share filter (the 46%/53% numbers you see inside each FVG).
✅ Optional candle confirmation and cooldown between trades.
✅ Risk management: fixed SL % + Trailing Stop with a profit trigger (doesn’t trail until your trigger is reached).
✅ Pine v6 safety: no unsupported args, no indexof/clamp/when, reverse-index deletes, guards against zero/NaN.
How a trade is decided (logic overview)
Detect FVGs (same rules as the original visual logic).
For each FVG currently intersected by the bar, compute:
Mitigation % (how deep price has entered the box).
Bull%/Bear% split (internal volume share).
Total volume (printed on the box) from LTF aggregation or fallback.
Age (bars) since the box was created.
Apply your filters:
Mitigation ≥ Long/Short threshold.
Volume between your min and max (if enabled).
Age ≥ min bars (if enabled).
Bull% / Bear% within your limits (if enabled).
(Optional) the current candle must be in trade direction (confirm).
If multiple FVGs qualify on the same bar, the strategy uses the most recent one.
Enter long/short (no pyramiding).
Exit with:
Fixed Stop Loss %, and
Trailing Stop that only starts after price reaches your profit trigger %.
Input settings (quick guide)
Mitigation source: close or high/low. Use high/low for intrabar touches; close is stricter.
Mitigation % thresholds: minimal mitigation for Long and Short.
TOTAL Volume filter: skip FVGs with too little/too much total volume (per box).
Bull/Bear share filter: require, e.g., Long only if Bull% ≥ 50; avoid Short when Bull% is high (Short Bull% max).
Age filter (bars): e.g., ≥ 20–30 bars to avoid fresh boxes.
Confirm candle: require candle direction to match the trade.
Cooldown (bars): minimum bars between entries.
Risk:
Stop Loss % (fixed from entry price).
Activate trailing at +% profit (the trigger).
Trailing distance % (the trailing gap once active).
Lower-TF aggregation:
Auto: TF/Divisor → picks 1/3/5m automatically.
Fixed: choose 1/3/5/15m explicitly.
If LTF can’t be fetched, fallback allocates prior bar’s volume by its close position in the bar’s H–L.
Suggested starting presets (you should optimize per market)
Mitigation: 60–80% for both Long/Short.
Bull/Bear share:
Long: Bull% ≥ 50–70, Bear% ≤ 100.
Short: Bull% ≤ 60 (avoid shorting into strong support), Bear% ≥ 0–70 as you prefer.
Age: ≥ 20–30 bars.
Volume: pick a min that filters noise for your symbol/timeframe.
Risk: SL 4–6%, trailing trigger 1–2%, distance 1–2% (crypto example).
Set slippage/fees in Strategy Properties.
Notes, limitations & best practices
Data differences: The LTF split uses request.security_lower_tf. If the exchange/data feed has sparse LTF data, the fallback kicks in (it’s deliberate to avoid NaNs but is a heuristic).
Real-time vs backtest: The current bar can update until close; results on historical bars use closed data. Use “Bar Replay” to understand intrabar effects.
No pyramiding: Only one position at a time. Modify pyramiding in the header if you need scaling.
Assets: For spot/crypto, TradingView “volume” is exchange volume; in some markets it may be tick volume—interpret filters accordingly.
Risk disclosure: Past performance ≠ future results. Use appropriate position sizing and risk controls; this is not financial advice.
Credits
Visual FVG concept and original implementation: BigBeluga.
This derivative strategy adds entry/exit logic, volume/age/share filters, robust LTF handling, and risk management while preserving the original spirit.
License remains CC BY-NC-SA 4.0 (non-commercial, attribution required, share-alike).
Fvg

ICT Killzones Pro Suite — ICT & SMC Indicator with AlertsThe ICT Killzones Pro Suite is a complete ICT and Smart Money Concepts (SMC) indicator that brings together the most important institutional concepts into one single tool.
Instead of manually drawing sessions, structure breaks, liquidity levels or imbalances, this ICT indicator for TradingView automatically plots them with precision and full customization.
It is widely used by traders in Forex, Indices, Crypto and Commodities who want to study market structure the same way institutions do.
🔎 Features
✅ Killzones (Asia, London, New York)
Session boxes with customizable colors
50% midline level for equilibrium reference
Real-time status display (“In Killzone” / “Out of Killzone”)
✅ Equal Highs & Equal Lows (Liquidity zones)
Automatic detection of EQH/EQL
Equality tolerance parameter
Zone expiry (bars)
Rejection filter (2 consecutive closes)
Option to show only the latest active EQH/EQL
✅ Break of Structure (BOS) & Market Structure Shift (MSS)
Detects continuation (BOS) and reversal (MSS) structures
Customizable line styles and colors
“Body only” or “Body/Wick” break modes
Option to show only the latest signals
✅ Open Price Range (OPR)
Institutional daily open level in UTC
Historical OPR memory for backtesting
Optional labels for quick identification
✅ Previous Highs and Lows
Daily (PDH/PDL), Weekly (PWH/PWL), Monthly (PMH/PML)
Full label system
Customizable line width/style
Breakout alerts for each level
✅ Fair Value Gaps (FVGs)
Automatic imbalance detection
Wick or body detection modes
Highlighted imbalance candles in yellow
✅ Alerts Engine
One global alert condition
Modular alerts:
• Killzone opens/closes
• EQH/EQL created or broken
• BOS/MSS bullish & bearish signals
• Previous Highs/Lows breakouts
• FVGs
⚙️ Parameters Explained
Killzones: start/end times in UTC, colors, extension lines, 50% midline
EQH/EQL: tolerance (0 = strict equality, >0 = margin allowed), expiry age (bars), rejection filter, body/wick break type, latest only toggle
BOS/MSS: swing bars (pivots), body vs wick detection, line styles & widths, only-latest option
OPR: exact UTC time (HH:MM), history toggle, label size/color
Previous Highs/Lows: daily/weekly/monthly levels, line styles, label settings, breakout alerts
FVGs: wick vs body detection, candle highlight color
Alerts: global condition + per-module toggles (sessions, liquidity, BOS/MSS, FVG)
Every parameter is fully customizable, making this SMC indicator adaptable to any trading style or timeframe.
📌 Why use this ICT & SMC indicator?
Saves time by automating repetitive tasks
Provides an institutional framework directly on charts
Keeps analysis structured and consistent
Optimized for intraday scalping and swing trading
⚠️ Disclaimer
This script is for educational purposes only. It does not guarantee profits or predict markets with certainty. Always use proper risk management.
🔑 Access
This is an invite-only script on TradingView.
Click Request Access on this page to apply.

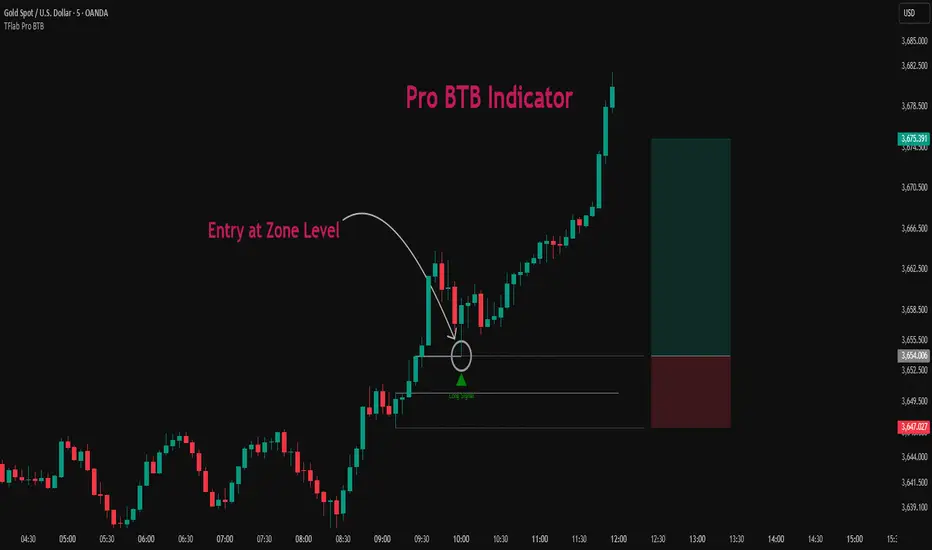
Pro BTB Pour Samadi Indicator [TradingFinder] Back To Breakeven🔵 Introduction
The Pro BTB (Professional Back To Breakeven) strategy is one of the most advanced price action setups, designed and taught by Mohammad Ali Poursamadi, an international Iranian trader and a well-known instructor of financial market analysis.
The main logic of this strategy is based on the natural behavior of the market :
Breakout of a key level: Price moves beyond an important support or resistance.
Retest / Back To Breakeven: Price returns to the broken level.
Continuation of the main trend: Entry at this point allows alignment with the dominant market direction.
To better understand Pro BTB, it is necessary to first know the concept of a Spike. A spike refers to a sudden and powerful movement of price in one direction, usually caused by heavy order flow. Such a move creates an Imbalance between buyers and sellers. Because the market does not have enough time to distribute orders fairly, it leaves an Inefficiency on the chart.
The direct result of this process is the formation of a Fair Value Gap (FVG) a gap between candles that shows trades were not distributed evenly. In simple terms: the spike is the cause, and Imbalance, Inefficiency, and FVG are its consequences.
In practice, Pro BTB works effectively in both bullish and bearish structures. In a Bullish Setup, a bullish spike first breaks a resistance level. Then, when price returns to that same level, a safe and low-risk buying opportunity is created. Conversely, in a Bearish Setup, a bearish spike breaks a support level, and when price comes back to the broken level, it provides the best conditions for a short entry. These two examples illustrate how Pro BTB logic provides precise, low-risk entries in both directions of the market.
🔵 How to Use
The Pro BTB (Back To Breakeven) strategy allows traders to enter precisely after price returns to the breakout level; this way the entry aligns with the natural market flow while risk is minimized. In practice, this method is simple yet powerful: first, identify a valid breakout on a key level, then wait for price to return to that level, and finally, take the entry in the direction of the main trend.
🟣 Bullish Setup
When a bullish spike occurs and a key resistance is broken, price usually returns to the same level. This level, now acting as support, provides the best opportunity for a long entry. In this scenario, the stop-loss is placed behind the breakout candle or slightly below the broken level, and the take-profit target should be defined with at least a 1:2 risk-to-reward ratio. With strong momentum, higher targets can also be considered.
🟣 Bearish Setup
In a bearish scenario, a bearish spike breaks a key support. After the breakout, price usually returns to the same level, which now acts as resistance. This creates the best conditions for a short entry. The stop-loss is placed behind the breakout candle or slightly above the broken level, while the take-profit target is set with a risk-to-reward ratio greater than 1:2.
🟣 General Rules of Pro BTB
To apply Pro BTB correctly, several key rules must be followed :
The breakout must be valid and occur on a key level.
Always wait for the retest; do not enter immediately after the breakout.
Entry should only happen when price touches the broken level and shows candlestick confirmation.
The stop-loss (SL) must be placed behind the breakout candle or the broken level.
The take-profit (TP) must always be at least twice the trade risk.
For higher reliability, the breakout should align with the trend on higher timeframes.
🟣 Six Entry Methods in Pro BTB
For greater flexibility, Pro BTB offers six standard entry methods :
Market Entry : Enter immediately at the breakout level.
Limit Order : Place a limit order on the breakout level.
Stop Order : Enter only after confirmation of continuation.
Confirmation Candle : Enter after a confirmation candle closes on the level.
Pattern Entry : Enter based on candlestick patterns such as Pin Bar or Engulfing.
Zone Entry : Enter from a zone instead of an exact point to account for market noise.
🔵 Setting
🟣 Spike Filter | Movement
Minimum Spike Bars : Defines the minimum number of consecutive candles required for a valid spike.
Movement Power : Enables or disables the momentum-based spike filter.
Movement Power Level : Sets the strength threshold; higher values filter out weaker moves and only detect strong spikes.
🟣 Spike Filter | Gap
Gap Filter : Enables or disables the gap filter.
Gap Type : Selects which type of gap should be detected (All Gaps, Significant, Structural, Major).
🟣 Spike Filter | Doji
Doji Tolerance : Defines whether doji candles are allowed within a spike.
Max Doji Body Ratio : Maximum ratio of body-to-total candle size for classifying a candle as a doji.
Max Doji in Spike Ratio : Maximum percentage of doji candles allowed within a spike.
🟣 Position Management
Stop-Loss Threshold : Enables or disables the stop-loss threshold feature.
Stop-Loss Threshold Value : Defines the value of the stop-loss threshold for risk management.
Risk-Reward Ratio : Sets the desired risk-to-reward ratio (e.g., 1:1 or 1:2).
Include SL Threshold in R:R : Determines whether the stop-loss threshold is included in risk-to-reward calculations.
🟣 Display Settings
Display Mode : Chooses between Setup (showing setups) or Signal (showing trade signals).
Show Entry Levels: Displays entry levels on the chart (buy/sell zones) when enabled
Only Display the Last Position : Displays only the most recent position on the chart when enabled.
Setup Width Drawing : Adjusts the visual width of the setup drawings on the chart for better visibility.
🟣 Alert
Alert : Enables alert notifications. When turned on, you can set TradingView alerts to receive notifications once the setup or signal conditions are met
🔵 Conclusion
The Pro BTB (Back To Breakeven) strategy is a smart and structured entry method based on natural market behavior after a breakout and retest of the broken level. It helps traders avoid emotional, high-risk entries by waiting for market confirmation and entering precisely at a point that aligns with the main trend and sits closest to the key level.
The simplicity of its rules, flexibility in entry methods, and a risk-to-reward ratio above 2 have made Pro BTB one of the most popular tools among price action traders. Nevertheless, as with any strategy, it is recommended to practice it in demo accounts or through personal backtesting before applying it to real trading, in order to find the entry conditions that best suit your trading style.
VWAP + Range Breakout (Pre-Signal for Manual Entry)WHAT IT DOES
This tool highlights potential breakout opportunities when price sweeps the previous day’s high or low and aligns with VWAP and short-term range levels. It provides both pre-signals (early warnings) and confirmed signals (breakout closed) so traders can prepare before momentum accelerates.
Works on all timeframes and across markets (indices, forex, crypto). Especially useful during active London and New York sessions.
---
KEY FEATURES
Daily sweep logic: previous day high/low as liquidity reference
VWAP with cumulative calculation
Adjustable range breakout levels
Optional SMA trend filter
Session filter (London / NY trading hours)
Pre-Signal markers (early alert before breakout)
Confirmed LONG/SHORT signals after breakout close
Alerts for Pre-Long, Pre-Short, and Confirmed entries
---
HOW TO USE
1. Wait for price to sweep the previous day high/low.
2. Look for alignment with VWAP and the defined range breakout levels.
3. Use trend/session filters for higher accuracy.
4. Combine with your own risk management rules.
---
SETTINGS TIPS
Adjust range lookback for different timeframes (shorter for fast intraday, longer for higher timeframes).
Enable/disable session filters depending on your market.
Use SMA trend filter to stay aligned with higher-timeframe bias.
---
WHO IT’S FOR
Scalpers, intraday, and swing traders who want early signals when liquidity is taken and price is preparing for a breakout.
---
NOTES
For educational purposes only. No financial advice.
This script is open-source; redistribution follows TradingView rules.

Smart Money LITE — Daily Sweep → HQ Signals (VWAP • FVG • CHoCH) 🔗 PRO VERSION (VWAP + FVG + CHoCH — full confirmations, all timeframes):
chartedgepro.gumroad.com/l/rmnbhw
Daily liquidity sweep → confluence signals with VWAP, FVG & CHoCH. Works on all timeframes & markets (Indices, Forex, Crypto).
WHAT IT DOES
Smart Money LITE+ highlights high-quality LONG/SHORT signals only after daily liquidity is swept (previous day high/low) with confluence from VWAP, FVG and structure (BOS/CHoCH).
Works on all timeframes and across markets: indices, forex, crypto.
KEY FEATURES (Lite)
• Daily sweep logic (PDH/PDL) + previous day zones
• VWAP + deviation bands (optional) and proximity filter
• 3-bar FVG boxes (visual) with adjustable extension
• ATR/volatility filter, optional HTF trend filter
• Anti-spam cooldown, clean LONG/SHORT labels
• Alerts: HQ LONG / HQ SHORT
HOW TO USE
1. Wait for price to sweep PDH/PDL → indicator opens “signal window”.
2. Look for confluence: VWAP touch/proximity + CHoCH or BOS in direction.
3. Enter with proper risk management (stop beyond swing/zone, partials).
SETTINGS TIPS
• Enable “Require VWAP Confluence?” for strictest setups.
• Use “HTF Trend Filter?” to align with higher-timeframe EMA trend.
• Adjust “After sweep (bars)” to define signal validity window.
• FVGs are visual in Lite — advanced filtering and confirmation are in Pro.
WHO IT'S FOR
Scalpers, intraday, and swing traders looking for objective, visual signals based on liquidity sweeps and VWAP/FVG confluence.
PRO VERSION (full confirmations)
Adds advanced FVG/iFVG logic, more confluence filters, dynamic risk tools and extended alert packages — optimized for all timeframes.
👉 chartedgepro.gumroad.com/l/rmnbhw
NOTES
• For educational purposes only. No financial advice.
• “Lite” is open-source; redistribution of code follows TradingView rules.

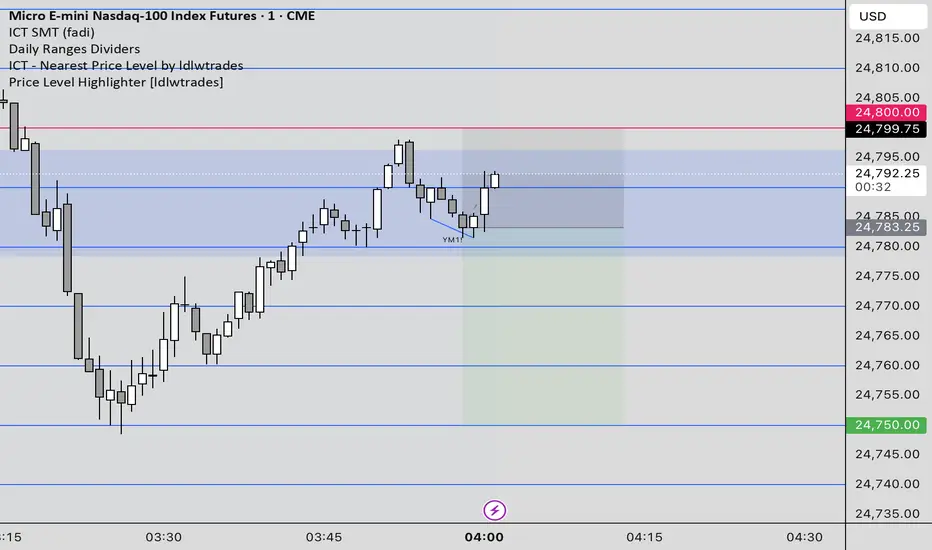
Price Level HighlighterThis indicator is a minimalist and highly effective tool designed for traders who incorporate institutional concepts into their analysis. It automates the identification of key psychological price levels and adds a unique, dynamic layer of information to help you focus on the most relevant area of the market. Inspired by core principles of market structure and liquidity, it serves as a powerful visual guide for anticipating potential support and resistance.
The core idea is simple: specific price points, particularly those ending in round numbers or common increments, often act as magnets or barriers for price. While many indicators simply plot static lines, this tool goes further by intelligently highlighting the single most significant level in real-time. This dynamic feature allows you to quickly pinpoint where the market is currently engaged, offering a clear reference point for your trading decisions. It reduces chart clutter and enhances your focus on the immediate price action.
Features
Customizable Price Range: Easily define a specific Start Price and End Price to focus the indicator on the most relevant area of your chart, preventing unnecessary clutter.
Adjustable Increment: Change the interval of the lines to suit your trading style, from high-frequency increments (e.g., 10 points) for scalping to wider intervals (e.g., 50 or 100 points) for swing trading.
Intelligent Highlighting: A key feature that automatically identifies and highlights the single horizontal line closest to the current market price with a distinct color and thickness. This gives you an immediate visual cue for the most relevant price level.
Highly Customizabile: Adjust the line color, style, and width for both the main lines and the highlighted line to fit your personal chart aesthetic.
Usage
Apply the indicator to your chart.
In the settings, input your desired price range (Start Price and End Price) to match the market you are trading.
Set the Price Increment to your preferred density.
Monitor the chart for the highlighted line. This is your active price level and a key area of interest.
Combine this tool with other confirmation signals (e.g., order blocks, fair value gaps, liquidity pools) to build higher-probability trade setups.
Best Practices
Pairing: This tool is effective across all markets, including stocks, forex, indices, and crypto. It is particularly useful for volatile markets where price moves rapidly between psychological levels.
Mindful Analysis: Use the highlighted level as a reference point for your analysis, not as a standalone signal. A break above or below this level can signify a shift in market control.
Backtesting: Always backtest the indicator on your preferred market and timeframe to understand how it performs under different conditions.
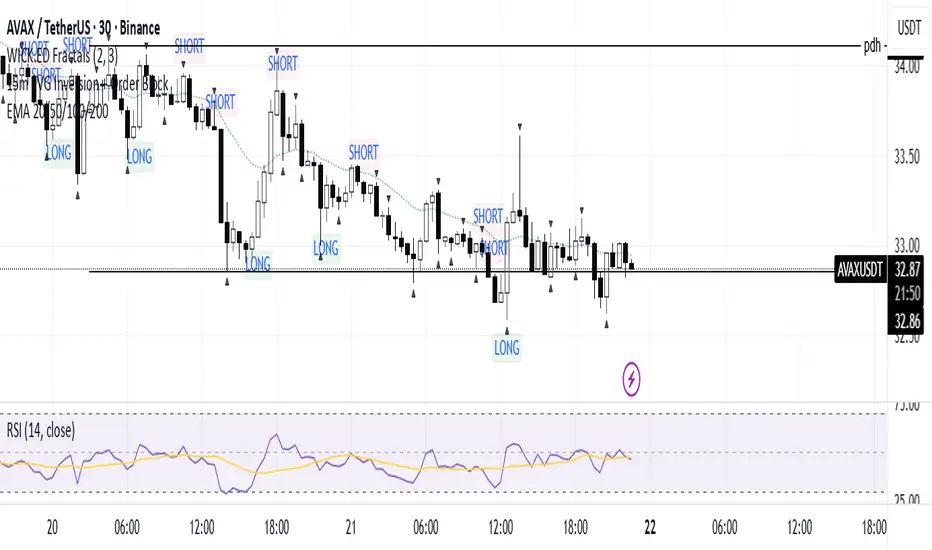
15m FVG Inversion + Order BlockThe indicator finds the inversion of the FVG 15 minutes and the order block, after which it gives an entry signal.
ICT Killzones x FVGs @dancizyeaaICT Killzones x FVGs Indicator
Last update: 19-SEP-2025
Creator: dancizyeaa
This indicator targets key session highs and lows combined with Fair Value Gaps (FVGs) visualization on TradingView charts. It integrates multiple market sessions (Asia, London, New York), drawing killzones, session separators, and key price levels with user-configurable alerts and filtering. It supports dynamic timeframe limits, coloring by FVG size, moving averages, and labels.
The ICT Killzones x FVGs indicator highlights major session high and low price zones with added fair value gaps, assisting traders in identifying potential reversal or breakout areas. It automatically draws session lines, pivot points, and dynamically colors FVG rectangles by size. It includes options for timezone offsets, alert setups for pivot breaks, and versatile visual configuration for clear session segmentation and market structure awareness.
Detailed Function Descriptions
Session Time and Date Handling:
Manages time offsets and date components to correctly align session boundaries and day separators considering timezone differences, including a weekday naming system for chart labeling.
FVG Detection and Coloring:
Detects bullish and bearish Fair Value Gaps based on recent candles, calculates gap size, and colors gaps differently if they are small or normal size to highlight relevant market inefficiencies.
Killzone (Session High/Low Zone) Management:
Creates and updates boxes, lines, and labels representing important market session zones from Asia to New York, including the ability to extend or limit these objects across timeframes and manage range averages.
Pivot Points and Midpoint Labels:
Draws session-specific pivot highs/lows and optional midpoint lines with alert conditions when these levels are broken, allowing traders to track and be notified of key market moves.
Session Separators and Open Lines:
Draws vertical and horizontal lines marking daily, weekly, and monthly open prices and session start/end boundaries with customizable styling, enhancing chart structure clarity.
Moving Average Overlay:
Optionally plots a user-defined simple moving average line for trend analysis, with customizable length and color.
Alert System:
Provides user-configurable alerts on pivot breaks and other key events, ensuring timely trading signals.
User Inputs and Settings:
Extensive input options to customize timezone offset, session visibility, line styles, transparency, label sizes and positions, and filter parameters for FVGs for a tailored trading experience.

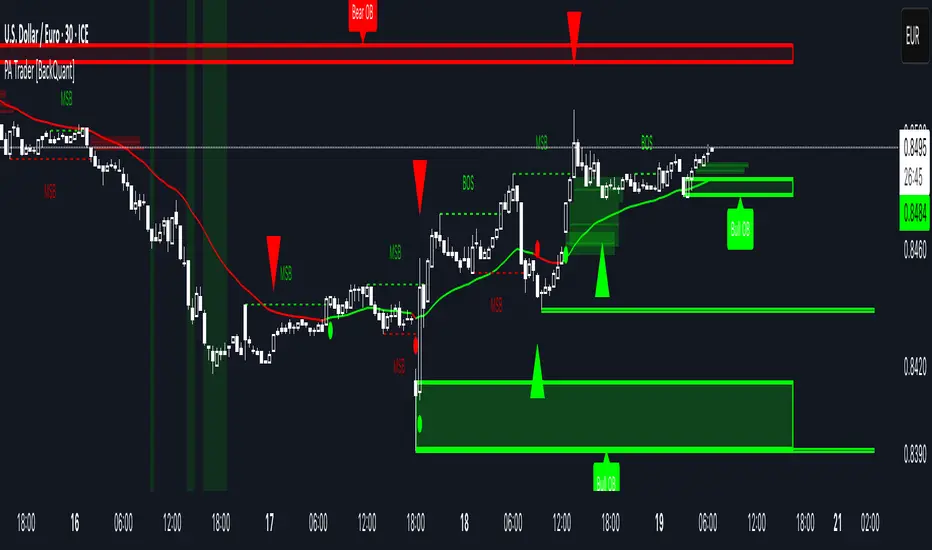
Price Action Trader [BackQuant]Price Action Trader
Introduction
Price Action Trader is an all-in-one, chart-side workflow for reading trend, timing impulses, and mapping high-probability zones the way discretionary traders actually trade. It blends an ensemble trend engine with clean price-action building blocks—Market Structure (BOS/MSB), Fair Value Gaps, Order Blocks, and Volumetric Support/Resistance—so you can form a bias, find confluence, and execute with context.
What is it
A modular “price-action stack” that:
Paints trend bias and impulse shifts on the chart (optional candle coloring).
Auto-annotates internal & swing structure (BOS / MSB).
Finds FVGs on your chosen timeframe and draws them cleanly.
Detects Order Blocks (with optional FVG confirmation).
Builds volumetric S/R levels that adapt to liquidity.
Emits alerts for key events (new levels, touches, breaks, OB creation/touch).
Everything is configurable—keep it minimal (trend + a few zones) or run the full toolkit.
What’s it used for
Bias first, trade second: establish direction/conviction, then execute where structure, gaps, blocks, and volume agree.
Timing: impulse flips and level touches provide actionable triggers.
Risk placement: OB edges, FVG midlines, and volumetric bands give logical stop/target references.
Review & journaling: optional session shading and labeled structures make post-trade notes simple.
Composite Trend Model
A lightweight signal line (default: 30-period) that turns green when the composite regime is bullish and red when bearish. Under the hood, multiple cues (adaptive momentum, de-noised oscillation, volatility-aware filters) are blended into a single directional score; when thresholds flip, the line recolors and optional Long/Short dots appear.
How to use
Treat the line as your bias rail : favor longs while green, shorts while red.
Flat/rapid flips = stand down or reduce size.
Prefer clean charts? Keep only the line and (optionally) trend-painted candles.
Inputs to know
Show Trend Signal Line / Width.
Paint Candles by Trend.
Long/Bearish color controls.
Impulse Model
Highlights short-term pressure shifts with optional impulse candle coloring and ▲/▼ markers. Great for entries in the prevailing trend and for early warnings when impulses fire against bias.
How to use
Up-bias: look for the next impulse-up near structure/FVG/OB or volumetric support.
Down-bias: mirror the logic.
Frequent counter-impulses → expect chop or regime change.
Inputs to know
Show Impulse Signals.
Paint Impulse Candles.
Market Structure
Automatic Internal (tight lookback) and Swing (wider lookback) structure with BOS and MSB (CHoCH) labels. You decide what to show—All, BOS only, MSB only—independently for internal vs swing.
How to use
Use Swing labels for the primary map; Internal for entry refinement.
After a bullish MSB , seek the first HL back into support/FVG/OB.
After a bearish BOS , favor LH fades into resistance/FVG/OB.
Inputs to know
Swing Lookback / Internal Lookback.
Swing/Internal Structure: All | BOS | MSB | None .
Separate bull/bear color controls for both layers.
Fair Value Gaps
Detects bullish/bearish FVGs on the current or higher TF, draws boxes, and can extend them forward. Midlines provide quick visual targeting.
How to use
In-trend fills: in an up-bias, tags of bullish FVGs often offer high-quality continuation entries, especially with structure/OB confluence.
Failed fills: rejections at the midline can signal emerging strength/weakness.
Inputs to know
Show FVG / Show Last N / Extend.
Timeframe (blank = chart TF; set higher TF for macro FVGs).
Bull/Bear colors (tune opacity to taste).
Volumetric Support and Resistance
Builds adaptive S/R from price interaction + relative volume over a rolling lookback. Levels store touch counts; you can show volume stats on labels or inside boxes. Transparency and border thickness can scale with volume so stronger levels are visually louder. Broken levels can auto-remove.
How to use
Use as confluence with structure, OBs, and FVGs. A long at volumetric support + Bull OB + FVG midline is qualitatively different from a naked level.
If a level breaks on strong volume, stop fading—flip expectations or wait for a clean retest.
Inputs to know
Detection Sensitivity / Volume Multiplier.
Analysis Period / Max Levels / Min Distance (%).
Remove Broken / Extend Right / Show Volume Info / Text Inside.
Support/Resistance colors (+ high-vol variants).
Alerts
New Support/Resistance Level Created.
Level Touch.
Level Break.
Order Blocks
Detects bullish/bearish OBs using configurable fractals (3- or 5-bar) with a break confirmation (by Close or High/Low). Optional FVG proximity filter, right-extension, and auto-delete when filled.
How to use
Bullish bias: stalk pullbacks into fresh Bull OBs aligned with a bullish FVG or volumetric support.
If price fills an opposing OB and fails to continue, reassess bias—context may be shifting.
Inputs to know
Fractal Type & Break Method (Close / HL).
Filter with FVG + Max FVG Distance.
Extend Blocks / Delete When Filled / Show Labels.
Alerts
New Order Block Created.
Order Block Touch.
Final Notes
Suggested workflow
Start with Composite Trend (bias).
Mark Swing structure in that direction.
Wait for an Impulse in-direction near an OB / FVG / Volumetric level.
Risk = nearest opposite level or OB edge; targets = FVG midlines / next S/R.
Timeframes & assets
Defaults suit liquid intraday and 1–4H swing.
Slower markets → lengthen lookbacks, lower sensitivity.
Very noisy crypto → keep trend visible, trim drawings (e.g., MSB only, last 3–5 FVGs, 8–12 volume levels).
Keep it readable
Turn off modules you don’t need today—fewer, higher-quality signals beat clutter.
About this release
Internal scoring, smoothing, and detection logic are proprietary. Behavior is controlled via inputs described above.
Trade with a plan, test your settings, and let confluence do the heavy lifting.
Structural Liquidity Signals [BullByte]Structural Liquidity Signals (SFP, FVG, BOS, AVWAP)
Short description
Detects liquidity sweeps (SFPs) at pivots and PD/W levels, highlights the latest FVG, tracks AVWAP stretch, arms percentile extremes, and triggers after confirmed micro BOS.
Full description
What this tool does
Structural Liquidity Signals shows where price likely tapped liquidity (stop clusters), then waits for structure to actually change before it prints a trigger. It spots:
Liquidity sweeps (SFPs) at recent pivots and at prior day/week highs/lows.
The latest Fair Value Gap (FVG) that often “pulls” price or serves as a reaction zone.
How far price is stretched from two VWAP anchors (one from the latest impulse, one from today’s session), scaled by ATR so it adapts to volatility.
A “percentile” extreme of an internal score. At extremes the script “arms” a setup; it only triggers after a small break of structure (BOS) on a closed bar.
Originality and design rationale, why it’s not “just a mashup”
This is not a mashup for its own sake. It’s a purpose-built flow that links where liquidity is likely to rest with how structure actually changes:
- Liquidity location: We focus on areas where stops commonly cluster—recent pivots and prior day/week highs/lows—then detect sweeps (SFPs) when price wicks beyond and closes back inside.
- Displacement context: We track the last Fair Value Gap (FVG) to account for recent inefficiency that often acts as a magnet or reaction zone.
- Stretch measurement: We anchor VWAP to the latest N-bar impulse and to the Daily session, then normalize stretch by ATR to assess dislocation consistently across assets/timeframes.
- Composite exhaustion: We combine stretch, wick skew, and volume surprise, then bend the result with a tanh transform so extremes are bounded and comparable.
- Dynamic extremes and discipline: Rather than triggering on every sweep, we “arm” at statistical extremes via percent-rank and only fire after a confirmed micro Break of Structure (BOS). This separates “interesting” from “actionable.”
Key concepts
SFP (liquidity sweep): A candle briefly trades beyond a level (where stops sit) and closes back inside. We detect these at:
Pivots (recent swing highs/lows confirmed by “left/right” bars).
Prior Day/Week High/Low (PDH/PDL/PWH/PWL).
FVG (Fair Value Gap): A small 3‑bar gap (bar2 high vs bar1 low, or vice versa). The latest gap often acts like a magnet or reaction zone. We track the most recent Up/Down gap and whether price is inside it.
AVWAP stretch: Distance from an Anchored VWAP divided by ATR (volatility). We use:
Impulse AVWAP: resets on each new N‑bar high/low.
Daily AVWAP: resets each new session.
PR (Percentile Rank): Where the current internal score sits versus its own recent history (0..100). We arm shorts at high PR, longs at low PR.
Micro BOS: A small break of the recent high (for longs) or low (for shorts). This is the “go/no‑go” confirmation.
How the parts work together
Find likely liquidity grabs (SFPs) at pivots and PD/W levels.
Add context from the latest FVG and AVWAP stretch (how far price is from “fair”).
Build a bounded score (so different markets/timeframes are comparable) and compute its percentile (PR).
Arm at extremes (high PR → short candidate; low PR → long candidate).
Only print a trigger after a micro BOS, on a closed bar, with spacing/cooldown rules.
What you see on the chart (legend)
Lines:
Teal line = Impulse AVWAP (resets on new N‑bar extreme).
Aqua line = Daily AVWAP (resets each session).
PDH/PDL/PWH/PWL = prior day/week levels (toggle on/off).
Zones:
Greenish box = latest Up FVG; Reddish box = latest Down FVG.
The shading/border changes after price trades back through it.
SFP labels:
SFP‑P = SFP at Pivot (dotted line marks that pivot’s price).
SFP‑L = SFP at Level (at PDH/PDL/PWH/PWL).
Throttle: To reduce clutter, SFPs are rate‑limited per direction.
Triggers:
Triangle up = long trigger after BOS; triangle down = short trigger after BOS.
Optional badge shows direction and PR at the moment of trigger.
Optional Trigger Zone is an ATR‑sized box around the trigger bar’s close (for visualization only).
Background:
Light green/red shading = a long/short setup is “armed” (not a trigger).
Dashboard (Mini/Pro) — what each item means
PR: Percentile of the internal score (0..100). Near 0 = bullish extreme, near 100 = bearish extreme.
Gauge: Text bar that mirrors PR.
State: Idle, Armed Long (with a countdown), or Armed Short.
Cooldown: Bars remaining before a new setup can arm after a trigger.
Bars Since / Last Px: How long since last trigger and its price.
FVG: Whether price is in the latest Up/Down FVG.
Imp/Day VWAP Dist, PD Dist(ATR): Distance from those references in ATR units.
ATR% (Gate), Trend(HTF): Status of optional regime filters (volatility/trend).
How to use it (step‑by‑step)
Keep the Safety toggles ON (default): triggers/visuals on bar‑close, optional confirmed HTF for trend slope.
Choose timeframe:
Intraday (5m–1h) or Swing (1h–4h). On very fast/thin charts, enable Performance mode and raise spacing/cooldown.
Watch the dashboard:
When PR reaches an extreme and an SFP context is present, the background shades (armed).
Wait for the trigger triangle:
It prints only after a micro BOS on a closed bar and after spacing/cooldown checks.
Use the Trigger Zone box as a visual reference only:
This script never tells you to buy/sell. Apply your own plan for entry, stop, and sizing.
Example:
Bullish: Sweep under PDL (SFP‑L) and reclaim; PR in lower tail arms long; BOS up confirms → long trigger on bar close (ATR-sized trigger zone shown).
Bearish: Sweep above PDH/pivot (SFP‑L/P) and reject; PR in upper tail arms short; BOS down confirms → short trigger on bar close (ATR-sized trigger zone shown).
Settings guide (with “when to adjust”)
Safety & Stability (defaults ON)
Confirm triggers at bar close, Draw visuals at bar close: Keep ON for clean, stable prints.
Use confirmed HTF values: Applies to HTF trend slope only; keeps it from changing until the HTF bar closes.
Performance mode: Turn ON if your chart is busy or laggy.
Core & Context
ATR Length: Bigger = smoother distances; smaller = more reactive.
Impulse AVWAP Anchor: Larger = fewer resets; smaller = resets more often.
Show Daily AVWAP: ON if you want session context.
Use last FVG in logic: ON to include FVG context in arming/score.
Show PDH/PDL/PWH/PWL: ON to see prior day/week levels that often attract sweeps.
Liquidity & Microstructure
Pivot Left/Right: Higher values = stronger/rarer pivots.
Min Wick Ratio (0..1): Higher = only more pronounced SFP wicks qualify.
BOS length: Larger = stricter BOS; smaller = quicker confirmations.
Signal persistence: Keeps SFP context alive for a few bars to avoid flicker.
Signal Gating
Percent‑Rank Lookback: Larger = more stable extremes; smaller = more reactive extremes.
Arm thresholds (qHi/qLo): Move closer to 0.5 to see more arms; move toward 0/1 to see fewer arms.
TTL, Cooldown, Min bars and Min ATR distance: Space out triggers so you’re not reacting to minor noise.
Regime Filters (optional)
ATR percentile gate: Only allow triggers when volatility is at/above a set percentile.
HTF trend gate: Only allow longs when the HTF slope is up (and shorts when it’s down), above a minimum slope.
Visuals & UX
Only show “important” SFPs: Filters pivot SFPs by Volume Z and |Impulse stretch|.
Trigger badges/history and Max badge count: Control label clutter.
Compact labels: Toggle SFP‑P/L vs full names.
Dashboard mode and position; Dark theme.
Reading PR (the built‑in “oscillator”)
PR ~ 0–10: Potential bullish extreme (long side can arm).
PR ~ 90–100: Potential bearish extreme (short side can arm).
Important: “Armed” ≠ “Enter.” A trigger still needs a micro BOS on a closed bar and spacing/cooldown to pass.
Repainting, confirmations, and HTF notes
By default, prints wait for the bar to close; this reduces repaint‑like effects.
Pivot SFPs only appear after the pivot confirms (after the chosen “right” bars).
PD/W levels come from the prior completed candles and do not change intraday.
If you enable confirmed HTF values, the HTF slope will not change until its higher‑timeframe bar completes (safer but slightly delayed).
Performance tips
If labels/zones clutter or the chart lags:
Turn ON Performance mode.
Hide FVG or the Trigger Zone.
Reduce badge history or turn badge history off.
If price scaling looks compressed:
Keep optional “score”/“PR” plots OFF (they overlay price and can affect scaling).
Alerts (neutral)
Structural Liquidity: LONG TRIGGER
Structural Liquidity: SHORT TRIGGER
These fire when a trigger condition is met on a confirmed bar (with defaults).
Limitations and risk
Not every sweep/extreme reverses; false triggers occur, especially on thin markets and low timeframes.
This indicator does not provide entries, exits, or position sizing—use your own plan and risk control.
Educational/informational only; no financial advice.
License and credits
© BullByte - MPL 2.0. Open‑source for learning and research.
Built from repeated observations of how liquidity runs, imbalance (FVG), and distance from “fair” (AVWAPs) combine, and how a small BOS often marks the moment structure actually shifts.

SP2L Pour Samadi Indicator [TradingFinder] Spike 2 Legs PA🔵 Introduction
The SP2L (Spike–2Leg) strategy, designed by Mohammad Ali Poursamadi, an international Iranian trader, is a simple yet powerful price action setup developed to identify precise entry points following sharp market movements.
A Spike refers to a sudden and rapid move in the market, usually triggered by a heavy flow of orders in one direction. This sharp movement creates an Imbalance between buyers and sellers. Since the market does not have time to trade evenly during such moves, it generates Inefficiency on the chart.
The direct result of a spike is usually the formation of a Fair Value Gap (FVG) — a space between candles indicating that trades were not distributed fairly. In simple terms, the spike is the cause, while Imbalance, Inefficiency, and FVG are its consequences.
🟣 How is a Spike formed?
Big Movement : A spike begins with a sharp and powerful move caused by heavy order flow in one direction.
Imbalance : This move disrupts the balance between buyers and sellers.
Inefficiency : Due to the speed of the move, the market fails to trade efficiently, leaving inefficiency on the chart.
Fair Value Gap (FVG) : The final outcome is a price gap between candles, highlighting unfair distribution of trades.
In SP2L, entries occur right after a spike. The entry logic is based on the structure of each candle’s Higher Lows (HLs) or Lower Highs (LHs).
When a spike occurs and candles consecutively form higher lows or lower highs :
In bullish conditions, each previous low becomes a potential Buy Entry.
In bearish conditions, each previous high becomes a potential Sell Entry.
🔵 How to Use
In the SP2L strategy, entries occur directly within the ongoing strong movement (the spike). A spike forms when heavy order flow pushes the market strongly in one direction, creating several large candles in sequence. This disrupts balance and leaves patterns such as Imbalance and FVG on the chart.
During such moves, the market does not necessarily retrace; instead, it continues strongly in the direction of the spike. The key principle in SP2L is that candles begin forming Higher Lows (HLs) in a bullish spike or Lower Highs (LHs) in a bearish spike. Each HL or LH acts as a potential entry level, but the actual entry only triggers once price returns to retest that level. This allows the trader to enter within a powerful wave while keeping stop-losses clear and risk controlled.
🟣 Bullish SP2L
When a bullish spike occurs, candles consecutively form Higher Lows. Each HL marks a potential entry. The entry is activated when price returns to that HL.
Stop-Loss (SL) : Placed below the candle where the spike originated, usually the lowest point before the sharp move.
Take-Profit (TP) : Defined based on classic risk-to-reward ratios, commonly TP1 = 1:1 and TP2 = 1:2. Stronger trends may allow extended targets.
🟣 Bearish SP2L
When a bearish spike occurs, candles consecutively form Lower Highs. Each LH marks a potential sell entry. The entry is triggered when price returns to retest that LH.
Stop-Loss (SL) : Placed above the candle where the bearish spike started, usually the highest point before the sharp drop.
Take-Profit (TP) : Similar to bullish setups, typically TP1 = 1:1 and TP2 = 1:2, with extended targets possible if bearish momentum continues.
🔵 Settings
🟣 Spike Filter | Movement
Minimum Spike Bars : Defines the minimum number of consecutive candles required for a valid spike.
Movement Power : Enables or disables the momentum-based spike filter.
Movement Power Level : Sets the strength threshold; higher values filter out weaker moves and only detect strong spikes.
🟣 Spike Filter | Gap
Gap Filter : Enables or disables the gap filter.
Gap Type : Selects which type of gap should be detected (All Gaps, Significant, Structural, Major).
🟣 Spike Filter | Doji
Doji Tolerance : Defines whether doji candles are allowed within a spike.
Max Doji Body Ratio : Maximum ratio of body-to-total candle size for classifying a candle as a doji.
Max Doji in Spike Ratio : Maximum percentage of doji candles allowed within a spike.
🟣 Trend Detection
Trend Detection : Enables or disables the trend detection module using dojis.
Max Doji Body Ratio : Maximum body-to-candle ratio used to classify a doji in trend calculations.
Candle Lookback : Number of candles used to calculate doji percentage for trend evaluation.
Max Doji in Trend Ratio : Maximum percentage of doji candles allowed within the lookback window for the trend to be valid.
🟣 Position Management
Stop-Loss Threshold : Enables or disables the stop-loss threshold feature.
Stop-Loss Threshold Value : Defines the value of the stop-loss threshold for risk management.
Risk-Reward Ratio : Sets the desired risk-to-reward ratio (e.g., 1:1 or 1:2).
Include SL Threshold in R:R : Determines whether the stop-loss threshold is included in risk-to-reward calculations.
🟣 Display Settings
Display Mode : Chooses between Setup (showing setups) or Signal (showing trade signals).
Only Display the Last Position : Displays only the most recent position on the chart when enabled.
🔵 Conclusion
The SP2L (Spike–2Leg) strategy, designed by Mohammad Ali Poursamadi, offers a simple yet effective framework for trading strong market flows. Built on the logic of spikes and candle structures (HLs and LHs), it identifies precise entry points directly within the main movement of the market, where risk is clear and reward is logical.
With transparent rules, defined stop-loss placement, and flexible risk management, SP2L proves especially effective in volatile markets such as forex, gold, and indices. Its simplicity makes it practical for both beginner traders and seasoned professionals.
In summary, SP2L helps traders avoid unnecessary complexity by focusing on spikes and consecutive HL/LH formations to capture accurate, low-risk entries.

NX - ICT PD ArraysThis Pine Script indicator identifies and visualizes Fair Value Gaps (FVGs) and Order Blocks (OBs) based on refined price action logic.
FVGs are highlighted when price leaves an imbalance between candles, while Order Blocks are detected using ICT methodology—marking the last opposing candle before a displacement move.
The script dynamically tracks and updates these zones, halting box extension once price interacts with them. Customizable colors and lookback settings allow traders to tailor the display to their strategy.

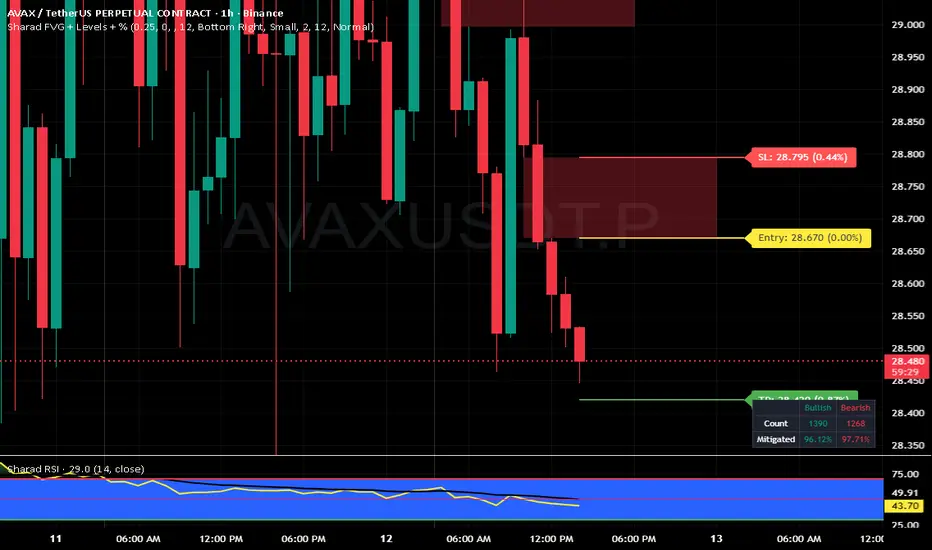
Sharad FVG (Last FVG SL/TP + Entry + % + Label Size)Sharad Fair Value Gap — Last FVG Entry, SL & TP (with % Labels)
What it is
A streamlined Fair Value Gap (FVG) tool that plots exact trading levels for the latest unmitigated FVG only:
Entry (yellow)
Stop-Loss (red)
Target (green) computed from a configurable Risk:Reward
Price and percentage distance printed on the right of each line
Optional dashboard and optional visualization of recent unmitigated/mitigated FVGs
The goal is simple: find the newest valid imbalance and give you just three actionable levels—no clutter.
How it detects FVGs
The script uses the standard 3-candle FVG logic (inspired by LuxAlgo’s implementation):
Bullish FVG forms when:
low > high and close > high and the gap size exceeds the Threshold filter.
The bullish gap is between high (lower bound) and low (upper bound).
Bearish FVG forms when:
high < low and close < low and the gap size exceeds the Threshold filter.
The bearish gap is between low (lower bound) and high (upper bound).
Threshold % filters small/weak gaps. You can also enable Auto, which estimates a dynamic threshold from recent candle ranges, so tiny imbalances don’t spam your chart in low-volatility regimes.
You may set Timeframe to detect FVGs on the chart timeframe or any higher/lower TF via request.security.
“Latest FVG only” levels (the core feature)
From the most recent unmitigated FVG (bullish or bearish), the script draws:
Entry
Bullish FVG → Entry = higher side of the gap (the gap max)
Bearish FVG → Entry = lower side of the gap (the gap min)
Stop-Loss (SL) = the opposite side of that same gap
Target (TP) = Entry + (Risk × R:R) for bulls, Entry − (Risk × R:R) for bears
where Risk = |Entry − SL| and R:R is your input (default 1:2)
Each line shows the price and its absolute % distance from Entry in parentheses—like TradingView’s long/short tool.
Alerts included
These are carried over from the base logic so you can build workflows:
Bullish FVG – when a new bullish gap is detected
Bearish FVG – when a new bearish gap is detected
Bullish FVG Mitigation – when a bullish gap is filled
Bearish FVG Mitigation – when a bearish gap is filled
Credits & License
Inspiration & base logic: LuxAlgo’s “Fair Value Gap ”.
This script: modified and extended by Sharad (Entry/SL/TP for latest FVG, price/% labels, label sizing, decluttered drawing).
License: This derivative keeps the original CC BY-NC-SA 4.0 license.
Attribution: Credit LuxAlgo for the original FVG approach and detection logic.
Non-Commercial: You may not use this for commercial purposes.
Share-Alike: If you remix/redistribute, you must use the same license and provide attribution.
Disclaimer:
Educational use only. Nothing in this script or its description is financial advice or a recommendation to buy/sell any asset. Markets involve substantial risk. Past performance and historical fill rates do not guarantee future results. You are solely responsible for your trading decisions and risk management. Data feeds, broker routing, spreads, slippage, and TradingView’s real-time behavior (especially with MTF) can affect outcomes. Test thoroughly on a demo account and consider multiple forms of confirmation before risking capital.
ICT Fair Value Gap (FVG) DetectorFair Value Gap (FVG) Indicator
Purpose: Highlights price gaps between three consecutive candles, which signal areas of imbalance that may later act as support or resistance.
How It Works: The script looks for a gap between the high of two bars ago and the low of the current bar (bullish FVG) or the low of two bars ago and the high of the current bar (bearish FVG).
Visuals: These gaps are marked as transparent boxes on the chart, extended to the right until they are "filled" or mitigated by price returning into the gap.
Customization: You can adjust which gaps show, their colors, thresholds, and other display options.

Order Blocks & FVG (Kostya)the indicator is the attempt to visualize the trading opportunities - price magnets and potential reversal zones for intraday and swing trading.

Greer Gap# Greer Gap Indicator (No mitigation: i.e. removing false signals)
## Summary
The **Greer Gap Indicator** identifies **Fair Value Gaps (FVGs)** and introduces specialized **Greer Bull Gaps (Blue)** and **Greer Bear Gaps (Orange)** to highlight high-probability trading opportunities. Unlike traditional FVG indicators, it avoids hindsight bias by not removing historical gaps based on future price action, ensuring transparency in signal accuracy. Built upon LuxAlgo’s FVG logic, it adds unique filtering: only the first Greer Gap after an opposite gap is plotted if its level (min for Bull, max for Bear) is not higher/lower than the previous Greer Gap of the same type, while all valid gaps are recorded for comparison. Traders can use these gaps as support/resistance or entry signals, customizable via timeframe, look back, and display options.
## Description
This indicator detects and displays **Fair Value Gaps (FVGs)** on the chart, with a focus on specialized **Greer Gaps**:
- **Bullish Gaps (Green)**: Areas where the low of the current candle is above the high of a previous candle (look back period), indicating potential upward momentum.
- **Bearish Gaps (Red)**: Areas where the high of the current candle is below the low of a previous candle, indicating potential downward momentum.
- **Greer Bull Gaps (Blue)**: A bullish gap that is above the latest bearish gap's max. Only the first such gap after a bearish gap is plotted if it meets criteria (not higher than the previous Greer Bull Gap's min), but all valid ones are recorded for comparison.
- **Greer Bear Gaps (Orange)**: A bearish gap that is below the latest bullish gap's min. Only the first such gap after a bullish gap is plotted if it meets criteria (not lower than the previous Greer Bear Gap's max), but all valid ones are recorded.
## How It Works
The script uses a dynamic look back period to detect FVGs. It maintains a record of all detected gaps and applies additional logic for Greer Gaps:
- **Greer Bull Gaps**: Checks if the new bullish gap's min is above the latest bearish gap's max. Plots only if it's the first since the last bearish gap and its min is <= previous Greer Bull min (or first one).
- **Greer Bear Gaps**: Checks if the new bearish gap's max is below the latest bullish gap's min. Plots only if it's the first since the last bullish gap and its max is >= previous Greer Bear max (or first one).
- **Resets**: A new bearish gap resets the Greer Bull Gap flag, and a new bullish gap resets the Greer Bear Gap flag.
## How to Use
- **Timeframe**: Set a higher timeframe (e.g., 'D' for daily) to detect gaps from that timeframe on the current chart.
- **Look back Period**: Adjust to change gap detection sensitivity (default: 34). Use 2 if you want to compare to LuxAlgo
- **Extend**: Controls how far right the gap boxes extend.
- **Show Options**: Toggle visibility of all bullish/bearish gaps or Greer Gaps.
- **Colors**: Customize colors for each gap type.
- **Application**: Use Greer Gaps as potential support/resistance levels or entry signals, but combine with other analysis for confirmation.
## Originality and Credits
This script is inspired by and builds upon the **"Fair Value Gap "** indicator by LuxAlgo (available on TradingView: ()).
**Credits**: Thanks to LuxAlgo for the core FVG detection logic.
**Significant Changes**:
- Added **Greer Bull and Bear Gap** logic for filtered, directional gaps with reset mechanisms.
- Introduced recording of all valid Greer Gaps without plotting all, to compare levels without hindsight bias.
- **No mitigation/removal of gaps**: Unlike LuxAlgo's approach, which mitigates (removes or alters) gaps based on future price action (e.g., when filled), this can create a hindsight bias where incorrect signals disappear over time. If a signal is used for a trade and later removed due to new data, it doesn't reflect real-time performance accurately. The Greer Gap avoids this by using gap comparisons to validate signals without altering historical boxes, ensuring transparency in when signals were right or wrong.

Machine Learning-Inspired Supply & Demand Zones [AlgoPoint]This indicator is a Smart Supply & Demand Zone tool, developed with principles inspired by Machine Learning (ML). It intelligently filters out market noise, allowing you to focus only on the most significant zones where institutional order flow is likely present.
💡 How It Works: Why Is This Indicator "Smart"?
Unlike traditional indicators that only measure simple price movements, this script uses an algorithm that asks the same critical questions an experienced market analyst would to qualify a zone:
- 1. Price Imbalance: How fast and aggressively did the price leave the zone? Our algorithm measures the body size of the "departure candle" relative to the current market volatility (ATR). A zone is only considered if it was formed by an explosive move that is statistically significant, indicating a major imbalance between buyers and sellers.
- 2. Volume Confirmation: Did the "smart money" participate in this move? The script checks if the volume on the departure candle was significantly higher than the recent average volume. A spike in volume confirms that the move was backed by institutional interest, adding strength and validity to the zone.
- 3. Valid Pivot Structure: Did the zone originate from a meaningful swing high or low? The algorithm first identifies a valid pivot structure, ensuring that zones are not drawn from insignificant or random price fluctuations.
Only when a potential zone passes these three critical tests—our "quality filter"—is it drawn on your chart.
🚀 Features & How to Use
Using the indicator is straightforward. You will see two primary types of boxes on your chart:
* 🟥 Red Box (Supply Zone): An area of potential resistance where selling pressure is likely to be strong. Look for potential shorting opportunities as the price approaches this zone.
* 🟩 Green Box (Demand Zone): An area of potential support where buying pressure is likely to be strong. Look for potential long opportunities as the price pulls back into this zone.
Dynamic Zone Management
This indicator is not static; it lives and breathes with the market:
- Fresh Zone: A newly formed zone appears in its full, vibrant color. These are the highest-probability zones as they have not yet been re-tested.
- Broken / Flipped Zone: You have full control over what happens when a zone is broken! In the settings, you can choose:
- Delete Zone: The zone will be removed completely when the price closes through it.
- Show as Broken (Flip): When broken, the zone will turn gray, stop extending, and remain on your chart. This is extremely useful for identifying Support/Resistance Flips, where a broken demand zone becomes new resistance, or a broken supply zone becomes new support.
⚙️ Settings & Customization
Fine-tune the indicator to match your personal trading style via the settings menu:
- Breakout Behavior: The most powerful feature. Choose between Delete Zone and Show as Broken (Flip) to customize your chart.
- Zone Finding Logic: Control the indicator's sensitivity.
- Selective: Requires both strong imbalance and high volume. Finds fewer, but higher-quality, zones.
- Moderate: Requires either strong imbalance or high volume. Finds more potential zones.
- Sensitivity Settings: Adjust the ATR Multiplier and Volume Multiplier to make the criteria for a "strong" zone stricter or looser.

Smart Money Footprint & Cost Basis Engine [AlgoPoint]Smart Money Footprint & Cost Basis Engine
This indicator is a comprehensive market analysis tool designed to identify the "footprints" of Smart Money (institutions, whales) and pinpoint high-probability reaction zones. Instead of relying on lagging averages, this engine analyzes the very structure of the market to find where large players have shown their hand.
How It Works: The Core Logic
The indicator operates on a multi-stage confirmation process to identify and validate Smart Money zones:
Smart Money Detection (The Trigger): The engine first scans the chart for signs of intense, urgent buying or selling. It does this by identifying Fair Value Gaps (FVGs) created by large, high-volume Displacement Candles. This is our initial Point of Interest (POI).
Cost Basis Calculation (The Average Price): Once a potential Smart Money move is detected, the indicator calculates the Volume-Weighted Average Price (VWAP) for that specific move. This gives us a highly accurate estimate of the average price at which the large players entered their positions.
Historical Confirmation (The "Memory"): This is the indicator's most unique feature. It checks its historical database to see if a similar Smart Money move (in the same direction) has occurred in the same price area in the past. If a match is found, the zone's significance is confirmed.
Verified Cost Basis Zone (The Final Output): A zone that passes all the above checks is drawn on the chart as a high-probability Verified Cost Basis Zone. These are the "memory zones" where the market is likely to react upon a re-visit.
How to Use This Indicator
Cost Basis Zones (The Boxes):
Green Boxes: Bullish zones where Smart Money likely accumulated positions. When the price returns here, a BUY reaction is expected.
Red Boxes: Bearish zones where Smart Money likely distributed positions. When the price returns here, a SELL reaction is expected.
Zone Strength (★★★): Each zone is created with a star rating. More stars indicate a higher-confidence zone (based on factors like volume intensity and historical confirmation).
BUY/SELL Signals: A signal is only generated when the price enters a zone AND the confirmation filters (if enabled in the settings) are passed.
Zone Statuses:
Green/Red: Active and waiting to be tested.
Gray: The zone has been tested, and a signal was produced.
Dark Gray (Invalidated): The zone was broken decisively and is no longer considered valid support/resistance.
Key Settings
Signal Accuracy Filters: You can enable/disable three powerful filters to balance signal quantity and quality:
Momentum Confirmation (Stoch): Waits for momentum to align with the zone's direction.
Candlestick Confirmation (Engulfing): Waits for a strong reversal candle inside the zone.
Lower Timeframe MSS Confirmation: The most advanced filter; waits for a trend shift on a lower timeframe before giving a signal.
Historical Confirmation:
Require Historical Confirmation: Toggle the "Memory" feature on/off. Turn it off to see all potential SM zones.
Tolerance Calculation Method: Choose between a dynamic ATR Multiplier (recommended for all-around use) or a fixed Percentage to define the zone size.

SMC Suite - OB . Breaker . Liquidity Sweep . FVGSMC Suite — Order Blocks • Breaker • Liquidity Sweep • FVG
What it does:
Maps institutional SMC structure (OB → Breaker flips, Liquidity Sweeps, and 3-bar FVGs) and alerts when price retests those zones with optional r ejection-wick confirmation .
Why this isn’t “just a mashup”?
This tool implements a specific interaction between four classic SMC concepts instead of only plotting them side-by-side:
1. OB → Breaker Flip (automated): When price invalidates an Order Block (OB), the script converts that zone into a Breaker of opposite bias (bullish ⇄ bearish), extends it, and uses it for retest signals.
2. Liquidity-Gated FVGs : Fair Value Gaps (3-bar imbalances) are optionally gated—they’re only drawn/used if a recent liquidity sweep occurred within a user-defined lookback.
3. Retest Engine with Rejection Filter : Entries are not whenever a zone prints. Signals fire only if price retests the zone, and (optionally) the candle shows a rejection wick ≥ X% of its range.
4. Signal Cooldown : Prevents spam by enforcing a minimum bar gap between consecutive signals.
These behaviors work together to catch the sequence many traders look for: sweep → impulse → OB/FVG → retest + rejection.
Concepts & exact rules
1) Impulsive move and swing structure
• A bar is “ impulsive ” when its range ≥ ATR × Impulsive Mult and it closes in the direction of the move.
• Swings use Pivot Length (lenSwing) on both sides (HH/LL detection). These HH/LLs are also used for sweep checks.
2) Order Blocks (OB)
• Bullish OB : last bearish candle body before an i mpulsive up-move that breaks the prior swing high . Zone = min(open, close) to low of that candle.
• Bearish OB : last bullish candle body before an impulsive down-move that breaks the prior swing low . Zone = high to max(open, close).
• Zones extend right for OB Forward Extend bars.
3) Breaker Blocks (automatic flip)
If price invalidates an OB (closes below a bullish OB’s low or above a bearish OB’s high), that OB flips into a Breaker of opposite bias:
• Invalidated bullish OB → Bearish Breaker (resistance).
• Invalidated bearish OB → Bullish Breaker (support).
Breakers get their own style/opacity and are used for separate Breaker Retest signals.
4) Liquidity Sweeps (decluttered)
• Bullish sweep : price takes prior high but closes back below it.
• Bearish sweep : price takes prior low but closes back above it.
Display can be tiny arrows (default), short non-extending lines, or hidden. Old marks auto-expire to keep the chart clean.
5) Fair Value Gaps (FVG, 3-bar)
• Bearish FVG : high < low and current high < low .
• Bullish FVG : low > high and current low > high .
• Optional gating: only create/use FVGs if a sweep occurred within ‘Recent sweep’ lookback.
6) Retest signals (what actually alerts)
A signal is true when price re-enters a zone and (optionally) the candle shows a rejection wick:
• OB Retest LONG/SHORT — same-direction retest of OB.
• Breaker LONG/SHORT — opposite-direction retest of flipped breaker.
• FVG LONG/SHORT — touch/fill of FVG with rejection.
You can require a wick ratio (e.g., bottom wick ≥ 60% of range for longs; top wick for shorts). A cooldown prevents back-to-back alerts.
How to use
1. Pick timeframe/market : Works on any symbol/TF. Many use 15m–4h intraday and 1D swing.
2. *Tune Pivot Length & Impulsive Mult:
• Smaller = more zones and quicker flips; larger = fewer but stronger.
3. Decide whether to gate FVGs with sweeps : Turn on “Require prior Liquidity Sweep” to focus on post-liquidity setups.
4. Set wick filter : Start with 0.6 (60%) for cleaner signals; lower it if too strict.
5. Style : Use the Style / Zones & Style / Breakers groups to set colors & opacity for OB, Breakers, FVGs.
6. Alerts : Add alerts on any of:
• OB Retest LONG/SHORT
• Breaker LONG/SHORT
• FVG LONG/SHORT
Choose “Once per bar close” to avoid intrabar noise.
Inputs (key)
• Swing Pivot Length — swing sensitivity for HH/LL and sweeps.
• Impulsive Move (ATR ×) — defines the impulse that validates OBs.
• OB/FVG Forward Extend — how long zones project.
• Require prior Liquidity Sweep — gate FVG creation/usage.
• Rejection Wick ≥ % — confirmation filter for retests.
• Signal Cooldown (bars) — throttles repeated alerts.
• Display options for sweep marks — arrows vs short lines vs hidden.
• Full color/opacity controls — independent palettes for OB, Breakers, and FVGs (fills & borders).
What’s original here
• Automatic OB → Breaker conversion with separate retest logic.
• Liquidity-conditioned FVGs (FVGs can be required to follow a recent sweep).
• Unified retest engine with wick-ratio confirmation + cooldown.
• Decluttered liquidity visualization (caps, expiry, and non-extending lines).
• Complete styling controls for zone types (fills & borders), plus matching signal label colors.
🔹 Notes
• This script is invite-only.
• It is designed for educational and discretionary trading use, not as an autotrader.
• No performance guarantees are implied — always test on multiple markets and timeframes.

ORB FVG Strategy with telegram V6.1Summary
Intraday NY-session strategy with Opening-Range bias (09:30–10:00 NY), FVG entries (incl. optional HTF FVGs), momentum filters (LinReg slope & Williams %R), limit entries inside the zone, SL from FVG anchors, and TP via risk-reward. Includes session/trade caps, pending-order handling, auto-cancel at NY time, and optional Telegram webhook alerts.
Feature Overview
Opening Range & Bias: OR high/low built until 10:00 NY, then frozen. Bias from confirmed 5-minute candles (modes: Body Close, Complete Candle, Wick Only).
FVG Scanner: Bull/bear FVGs (choose wick or body gaps), min size, auto-extend, mitigation cleanup (touch or 50%).
HTF FVG (10 min): Optional – displayed after ≥ 2 consecutive FVGs; cleans up on touch/50%.
Entry/SL/TP: Entry at X% fill (+extra %) within the FVG; SL from FVG candle / FVG-1 / FVG-2 (smart) + buffer; TP via risk-reward.
Momentum Filters: LinReg slope (MLL) + Williams %R with threshold/slope filters (individually switchable).
Intrabar Mode (optional): Immediate Open/intrabar entry on touch (calc_on_every_tick=true) or classic bar-close confirmation (toggle).
Trade Management: Max trades/day, pending cap, auto-cancel at defined NY time, pause after first winner (optional).
Telegram: Programmatic alerts via alert() with Telegram-ready JSON payload.
Parameters (compact)
Group Parameter Purpose
Sessions Trading session, Opening range Trading/OR window (internal NY TZ)
Bias Body Close / Complete Candle / Wick Only Bias confirmation relative to OR
Liquidity LQ session, lookback days, cleanup points, show lines Intraday liquidity marks & cleanup
FVG Min size, wick/body, colors, extend, cleanup Detection/visualization & validity
HTF FVG (10 m) Toggle/Display/Colors Conservative HTF filter/POI
Entry Fill %, extra %, max pending, validity (bars), cancel time, intrabar switch Execution timing, order caps, auto-cancel
Stop Loss Source: Candle / -1 / -2 (smart), buffer (points) SL anchor from FVG history + safety offset
Take Profit Risk-Reward (R:R) Target calculation
Momentum LinReg length/min slope, W%R length/min slope, HUD Trend/momentum filters
Trade Mgmt Max trades/day, pause after win Daily cap / risk cooldown
Telegram Enabled, tester, interval, channel id Webhook output & test signals
Debug & Info Debug panel, rejection reasons On-chart status/diagnostics
Alerts / Telegram Webhook (Quick Setup)
Create an alert with Condition: “Any alert() function call”.
Webhook URL: api.telegram.org
Message: leave empty (the strategy provides JSON via alert() – includes chat_id, parse_mode, text).
Ensure your bot can post to the channel and the chat_id is valid.
Repainting & Backtesting
HTF series via lookahead_off on closed higher-TF candles; FVG detection on confirmed bars (barstate.isconfirmed).
Intrabar/Open entries allow earlier fills but typically cause differences between backtest and live (tick granularity/slippage, limit touch on bar OHLC).
For reproducibility, trade without intrabar (bar-close only).
Limitations
No full tick simulation; limit fills rely on bar OHLC.
Liquidity “cleanup” is rule-based (not an orderbook).
Telegram depends on correct webhook configuration.
Tips
Timeframes: M5 (intrabar)
Start with modest R:R (e.g., 1.5–2.0) and tune filters carefully.
Disclaimer
No financial advice. Past results do not guarantee future performance. Use responsibly and follow Public Library rules.
License / Credits
© 2025 Lean Trading (Lennart Pomreinke). License: MPL-2.0.
Changelog
V06.1: Intrabar switch (Open/intrabar vs bar-close), Telegram sanitizer & tester, HTF-FVG cleanup, refined pending/cancel logic, debug panel (status & rejections).

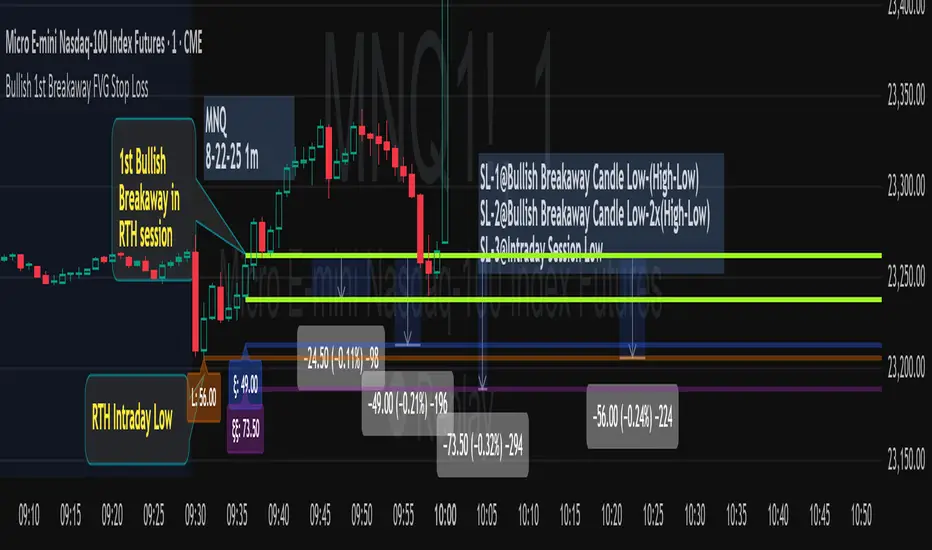
Bullish 1st Breakaway FVG Stop Loss
This indicator provides a defined 3-tier stop loss placement when you want to trade the 1st Bullish Breakaway FVG strategy. The Bullish Breakaway Dual Session FVG indicator is an independent indicator that track all bullish breakaway candles, however this one only tracks the very 1st breakaway candle with a stop loss visual cue.
Introduction of Bullish Breakaway Consolidated FVG:
Inspired by the FVG Concept:
This indicator is built on the Fair Value Gap (FVG) concept, with a focus on Consolidated FVG. Unlike traditional FVGs, this version only works within a defined session (e.g., ETH 18:00–17:00 or RTH 09:30–16:00).
Bullish consolidated FVG & Bullish breakaway candle
Begins when a new intraday low is printed. After that, the indicator searches for the 1st bullish breakaway candle, which must have its low above the high of the intraday low candle. Any candles in between are part of the consolidated FVG zone. Once the 1st breakaway forms, the indicator will shades the candle’s range (high to low).
Session Reset: Occurs at session close.
Choose your own session: use 930 to 1615 for RTH, 1800 to 1615 for ETH. (New York Time Zone)
Repaint Behavior:
If a new intraday (or intra-session) low forms, earlier breakaway patterns are wiped, and the system restarts from the new low.
Product Optimization:
This indicator is designed for CME future product with New York time zone. If you want to trade other products, please adjust your own time session.
Entry:
Long after the 1st Bullish Breakaway Candle in your active session.
However, best position of long is executed by your own trading skill and edge.
Stop Loss: ξ
ξ: This is the 1st stop loss, it is 1 equal size of the breakaway candle below the low.
ξξ: This is the 2nd stop loss, it is 2 equal sizes of the breakaway candle below the low.
L: This is the 3rd stop loss, it is the intraday session low.
Stop loss calculation:
Assuming you enter at the high of the breakaway candle, the SL number is shown as the high minus the stop loss placement.
Last Mention:
If you don't see anything in the indicator, adjust your session to an active session only, and use Tradingview replay function. This indicator is a live indicator with repainting mechanism.
True Order Block (OB) True Order Block (OB)
This script automatically detects and plots Order Blocks (OBs) based on the presence of Fair Value Gaps (FVGs).
Only Order Blocks are displayed on the chart.
🔎 How it works
The script looks for Fair Value Gaps (FVGs) according to a relaxed 3-candle definition.
Once an FVG is detected:
For a Bullish FVG → the last bearish candle before the gap is marked as the Bullish Order Block.
For a Bearish FVG → the last bullish candle before the gap is marked as the Bearish Order Block.
OBs are extended into the future until price either:
mitigates the zone (optional auto-removal), or
the number of live OBs exceeds the user’s maximum (FIFO cleanup).
⚙️ User settings
Draw Order Blocks (enable/disable plotting)
Minimum OB length (how far each zone extends initially)
Remove OB after violation (auto delete invalidated zones)
Max active OBs (limit on displayed zones for clarity)
Bullish/Bearish OB colors
✅ Key features
Fully automated OB detection
No clutter – only OBs are plotted (FVG logic hidden in the background)
Smart cleanup: mitigated zones are removed automatically
Customizable colors & limits
⚠️ Notes
This tool is designed for educational and analytical purposes only.
It does not generate trade signals.
Always combine with your own strategy, market context, and risk management.

Bearish Breakaway Dual Session-FVGInspired by the FVG Concept:
This indicator is built on the Fair Value Gap (FVG) concept, with a focus on Consolidated FVG. Unlike traditional FVGs, this version only works within a defined session (e.g., ETH 18:00–17:00 or RTH 09:30–16:00).
See the Figure below as an example:
Bearish consolidated FVG & Bearish breakaway candle
Begins when a new intraday high is printed. After that, the indicator searches for the 1st bearish breakaway candle, which must have its high below the low of the intraday high candle. Any candles in between are part of the consolidated FVG zone. Once the 1st breakaway forms, the indicator will shades the candle’s range (high to low). Then it will use this candle as an anchor to search for the 2nd, 3rd, etc. breakaways until the session ends.
Session Reset: Occurs at session close.
Repaint Behavior:
If a new intraday (or intra-session) high forms, earlier breakaway patterns are wiped, and the system restarts from the new low.
Counter:
A session-based counter at the top of the chart displays how many bullish consolidated FVGs have formed.
Settings
• Session Setup:
Choose ETH, RTH, or custom session. The indicator is designed for CME futures in New York timezone, but can be adjusted for other markets.
If nothing appears on your chart, check if you loaded it during an inactive session (e.g., weekend/Friday night).
• Max Zones to Show:
Default = 3 (recommended). You can increase, but 3 zones are usually most useful.
• Timeframe:
Best on 1m, 5m, or 15m. (If session range is big, try higher time frame)
Usage:
See this figure as an example
1. Avoid Trading in Wrong Direction
• No Bearish breakaway = No Short trade.
• Prevents the temptation to countertrade in strong uptrends.
2. Catch the Trend Reversal
• When a bearish breakaway appears after an intraday high, it signals a potential reversal.
• You will need adjust position sizing, watch out liquidity hunt, and place stop loss.
• Best entries of your preferred choices: (this is your own trading edge)
Retest
Breakout
Engulf
MA cross over
Whatever your favorite approach
• Reversal signal is the strongest when price stays within/below the breakaway candle’s
range. Weak if it breaks above.
3. Higher Timeframe Confirmation
• 1m can give false reversals if new lows keep forming.
• 5m often provides cleaner signals and avoids premature reversals.
Summary
This indicator offers 3 main advantages:
1. Prevents wrong-direction trades.
2. Confirms trend entry after reversal signals.
3. Filters false positives using higher timeframes.
Failed example:
Usually happen if you are countering a strong trend too early and using 1m time frame
Last Mention:
The indicator is only used for bearish side trading.
