WR Market StructureThis is script is build up based on Zig Zag Indicator and modify according to WR idea if market structure to define new HH and new LL.
The idea of this indicator is to determine Trend Up (HH and New HH) and Trend Down direction (LL and New LL).
Below is the example of the inidcator:
If you have any suggestions, comments or interested to use this script, kindly PM us to obtain an access.
Marketstructure

[SCL] True Market StructureSee market structure at a glance with Higher Highs and Lower Lows. Bullish/Bearish/Ranging market bias is automatically derived. Optionally get alerted for breaks in market structure. Uses true Local Highs/Lows instead of simply the highest/lowest "pivot" for x bars. Can be useful as a support for learning market structure or for alerts for a change in structure while you're not at the computer.

Trend Lines ProHello Traders!
We need to make things better & better to solve the puzzle and I try to do my best on this way. now I am here with my new Trend Lines Pro script.
As you know, Trend Lines is very subjective and many people (even professionals) draw different Trend Lines on the same chart. This is confusing and there must be an automation to make the life easer. with this tool I tried to automate it.
The idea in this script is different from my previous trend lines scripts. In this, I use channel idea so it can check number of pivot points it contains, it checks H/L/C in the channels as well. it also checks the angle while choosing trend lines. then we get stronger and useful Trend Lines automatically.
There are some option in the script, let see one by one:
Pivot Period: The Length to calculate Pivot Highs/Lows
Source : Option to use "High/Low" or "Close" as the source for Pivot Points
Threshold Rate : This rate is used for channel width. it you give bigger numbers then you get bigger channels. it's 4 by default
Minimum Angle Rate for new Trendline: if there are different trend lines, there must be an angle between them to choose best trend lines. you can set the angle with this option.
Minimum Strength: there can be many trend lines but we need to choose/use stronger ones. with this option you can set the number of pivot points a trend channel have to contains.
Maximum Loopback Length: by default the script can check 40 pivot highs and 40 pivot lows but to make the script faster and useful I needed to add a limitation for the number of bars that the script can go back.
Show Trendlines as: you can see trend lines as "Trendline", "Channel", "Trend Channel". you can see examples below.
Enable Weak Trend Lines: if there is no trend lines strong enough (as defined in "Minimum Strength" option) you have option to see a weak trend line. that is useful sometimes. if you enable this option weak lines are shown as dotted lines.
Show Price Labels on Trendlines: the script can show the price levels to break trend lines. the examples are below
Line Style: trend lines can be Solid or Dashed as you wish
Color theme: colors of the Up/Down Trend lines can be set. 'Red', Lime, Blue, White, Black, Olive, Gray
you can see the Trend Lines as channels:
you can see Trend Channels to see the big picture.also there is dotted trend line as weak trend line defined above.
you can set color/width of trend lines as you wish.
the script is fast enough to run on 1sec chart:
you can use this script on any chart, fx pairs, stocks, indices etc
I made a short video to explain how to use it and some options:
Please PM for access.
Enjoy!
DISCLAIMER: No sharing, copying, reselling, modifying, or any other forms of use are authorized for our documents, script / strategy, and the information published with them. This informational planning script / strategy is strictly for individual use and educational purposes only. This is not financial or investment advice. Investments are always made at your own risk and are based on your personal judgement. I am not responsible for any losses you may incur. Please invest wisely.
Script payant

TM_SWING_LEVELSwing level Indicator shows overall market price structure of market for Swing Position.
Terminology Use ==> Price Line, Price Level name and Price level
Timeframe ==> Use proper Signal with swing trend on 1 Hour or Upper time frame (Best if Use with 1 Hour chart or 1 Day chart).
What to Identify ==> Overall market price structure for the Swing Period
How to Use ==>
There are Many Line in price level chart
Green/red with Solid for important area of support or resistance
other dotted lines are for retracement or extension of prices.
Important Structure==> Price behaviors on all lines of possible support and resistance
Use market structure, chart pattern, trend lines for more support.
Entry ==>
Let’s wait the proper area of support or resistance (Area of Value in case of trend pattern use)
Exit ==>
SL of swing high/low out of market structure with proper risk management and target with proper Risk/ Reward Ratio

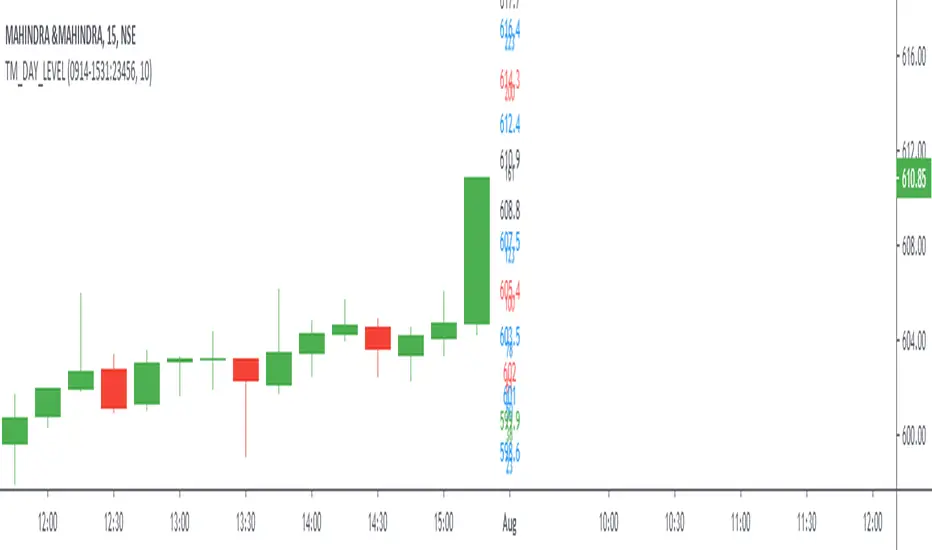
TM_DAY_LEVELDay level Indicator shows overall market price structure of market for Intraday Position.
Terminology Use ==> Price Line, Price Level name and Price level
Timeframe ==> Use proper Signal with swing trend on 15 Min. or lower time frame (Best if Use with 15 Minutes chart or 5 Min. chart).
What to Identify ==> Overall market price structure for the Intraday Period
How to Use ==>
There are Many Line in price level chart
Green/red with Solid for important area of support or resistance
Other dotted lines are for retracement or extension of prices.
Important Structure==> Price behaviors on all lines of possible support and resistance
Use market structure, chart pattern, trend lines for more support..
Entry ==>
Let’s wait the proper area of support or resistance (Area of Value in case of trend pattern use)
Exit ==>
SL of swing high/low out of market structure with proper risk management and target with proper Risk/ Reward Ratio

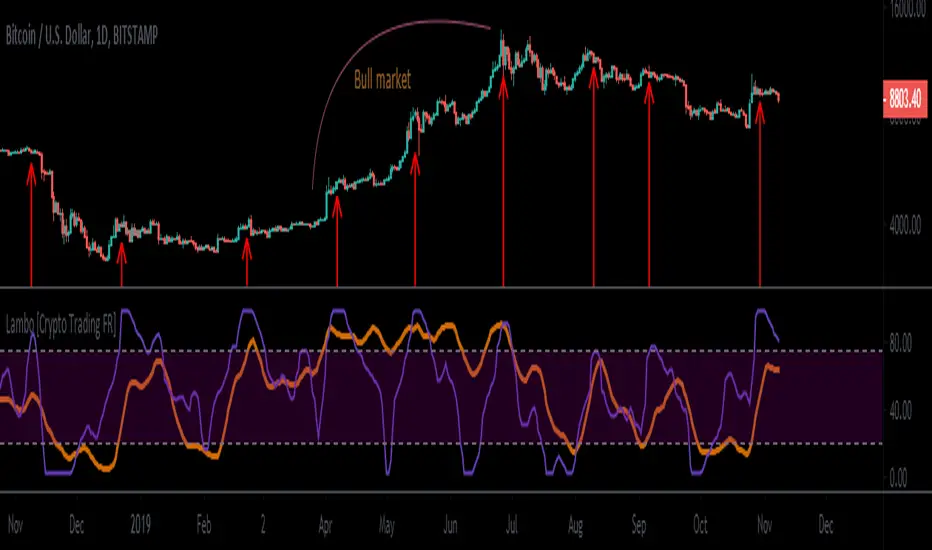
Lambo indicator [Crypto Trading FR]Lambo indicator is probably one of the best indicator you can use to spot the trend and make money.
It is a momentum oscillator contains two signals line :
- The lambo moving average (orange line) for momentum
- The huracan (purple line) perfect in showing market bottoms and tops
The combination of both line give you the perfect timing to buy or sell any assets.
If you look after a way where you can identify market regime shift from low volatility zone to high volatility zone and vice versa, it is certainly the indicator you need!
Lambo indicator works on all timeframe but better use it with higher ones 4H, 8H, 1D, 1W etc.
Let me know if you like it.
Enjoy and make money guys!!!
Market Structure Finder [Dzenis]This indicator is designed to help you visualize the high timeframe market structure breaks and shifts in trend.
It finds local swing highs and lows, and defines the market structure based on them.
Break above the blue line = market structure is bullish, look for long/buy
Break below the red line = market structure is bearish, look for short/sell
I wrote it as a strategy so it can be easily backtested, giving a more complete picture of its effectiveness for catching larger swings.
It works best in trending markets such as Bitcoin.
This specific backtesting strategy and buy/sell signals on the chart are meant for trading the spot markets.
Buy signal triggers the entry with 70% of the trading capital (can be adjusted in the indicator menu and backtested with different percentages).
Sell signal exits the position.
The results assume 0.1% trading fees by default (adjustable in the menu as well).
It does not repaint.
If trading the futures markets it can be used purely as an indicator to help you form a HTF bullish/bearish bias and look for trade setups accordingly.
Although it's not designed for intraday moves, it can be used on lower timeframes as well.
8h timeframe for swing trades.
1h timeframe for intraday setups.
Daily timeframe is still the suggested and main use of this indicator (forming high timeframe bias).
For any questions and inquiries, feel free to DM me.

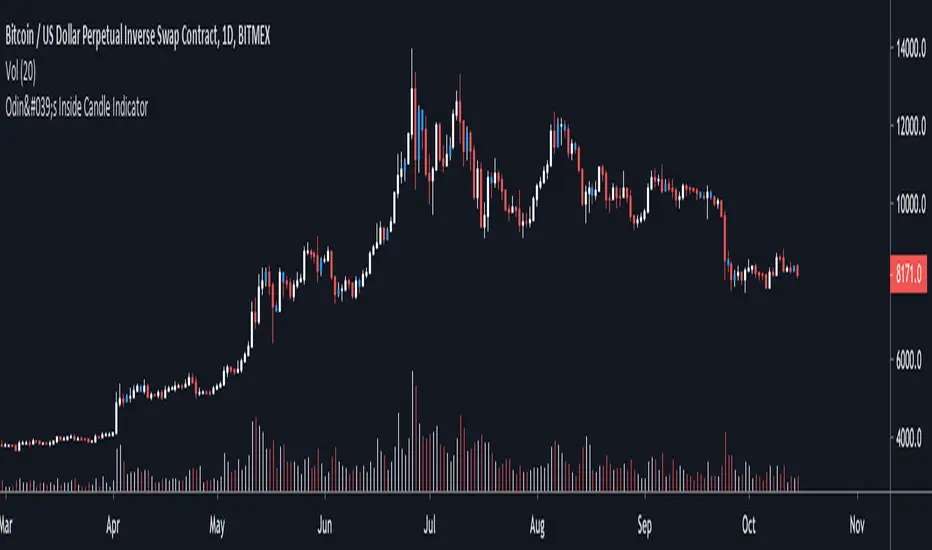
Odin's Inside Bar IndicatorA simple indicator that identifies "inside bars" by painting them blue.
An inside candle is a candle that has a lower high and higher low than the previous candle.
I like to use it on the daily chart to find areas of price compression that lead to a breakout.
The price then often trends in the direction of the breakout.
Especially powerful when combined with other market structure analysis.
Cheers.
PA Extremely Early version
Experimenting with traditional "market structure" and candlestick patterns for trend analysis

Dav-o meter (public)I decided to make this formerly invite only script public (you can find the invite only version here
If you are part of the invite only you don't need to change scripts. I will push improvements first on the invite only script but in time it will come to this version as well.
I would love to know your ideas and thoughts on how this indicator can be improved, so feel free to give any feedback.
Remember to give it a thumbs up if you like it.
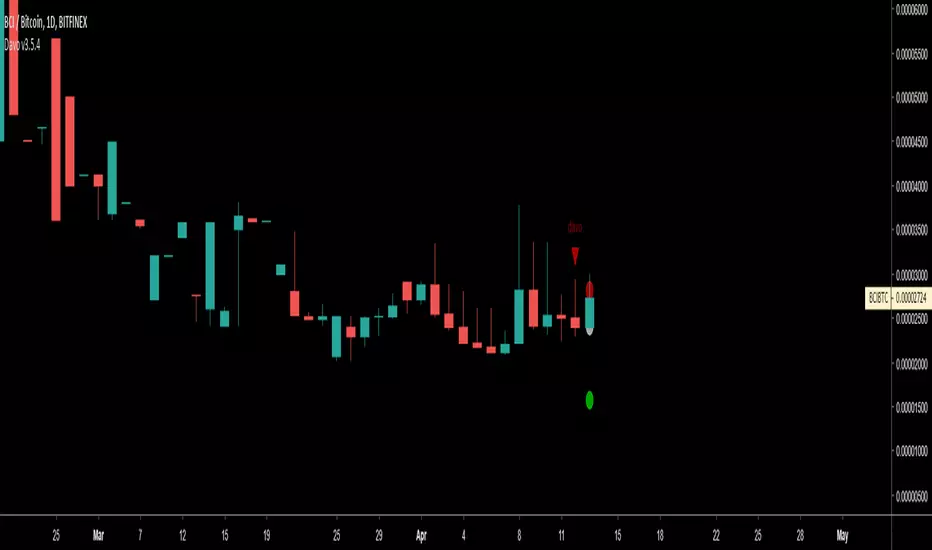
Dav-o meterPseudo code
Example
General info and acknowledgements
Author: maqpie
Date of publishing: 20th of july 2017
This script is based upon Davinci's dav-o meter and his original script, which searches for W's and M's in price, OBV, RSI and/or Willy.
Although the original script is elegant, a W or M has to occur within 5 bars.
However, often what you will see is that a W or M forms over more than 5 bars.
This script tries to remove that limit.
It took me several different approaches to find a good solution. For the most part because of the lack of any real debugging tool in Pine script.
Let me know what you think, because I feel like I need tone down the number of options so it is easier to use.
If you have any questions, or things you would like to see different please contact me at TRI.
Have fun playing and goofing around with it!
How it works
Now, trading is more of an art form than a science and this indicator is no exception.
When talking about M's and W's, it begs the question: what exactly counts as a W or M?
My personal experience is that for a W to count as such, it has to adhere to the following rules:
1. A 'W' has 5 points, A, B, C, D and E E
2. Point A can be any point C /
3. Point B should be lower than A A / \ /
4. Point C should be higher than B \ / D
5. Point D should be lower than C, but higher than B B
6. Point E should be higher than C
1. A 'M' has 5 points, A, B, C, D and E B
2. Point A can be any point / \ D
3. Point B should be higher than A A \ / \
4. Point C should be lower than B C \
5. Point D should be higher than C, but lower than B E
6. Point E should be lower than C
Script input parameters
You can use the following indicators to search for W's or M's:
- price (close)
- OBV
- RSI
- Willy
For each of these indicators you set the following options:
- Use: whether you want to use it
- The maximum width: over how many bars a W / M is allowed to form
- The maximum offset: how many bars back a W / M is allowed to form
- Strict: when not set, rule 5 (see 'How it works') changes: point D no longer has to be above B (for W), and no longer has to be below B (for M)
- Length: length of the indicator, for example a 14 bar RSI
Other options:
- Potential dav-o: show potentials which are like regulars dav-o's, except that rule 6 (see 'How it works') no longer applies.
- Period: you can limit the period for backtesting. Useful to identify under what market conditions the script works best.
Final note: using the potential dav-o in combination with unsetting the 'Strict' rule will make this script all but useless.
