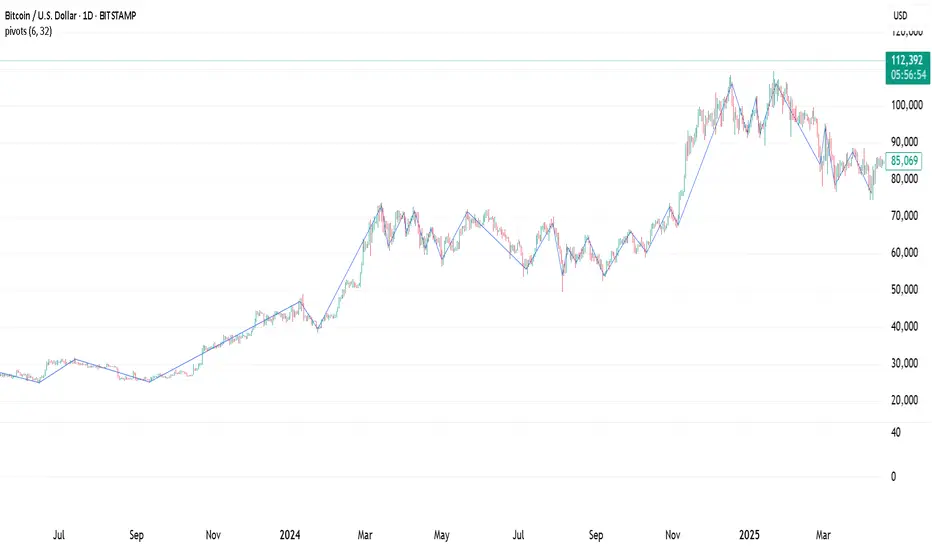
Pivot Points. High & Lows By Reversal PercentageLibrary "Pivot Points. High & Lows By Reversal Percentage" by Jal9000
This Pine Script library provides a robust function for identifying and tracking pivot points (reversal points) in price data, suitable for integration into custom trading indicators and strategies.
🛠️ Main Features:
- ✅ Identifies pivot highs and lows based on configurable price movement thresholds.
- ✅ Lightweight. No candle backtracing used. Much less computation heavy.
- ✅ Supports multiple calls (with different values) within a single script.
- ✅ Compatible with request.security for multi-timeframe analysis.
- ✅ Returns both confirmed and temporary pivots for flexible integration.
- ✅ Pinescript V5 and V6 compliant code.
Purpose:
The pivots library enables Pine Script developers to easily add pivot point detection to their scripts. It identifies significant price reversals by evaluating price movements against a minimum range threshold ( min_range_pct ) and confirming reversals based on a percentage ( reversal_pct ) of the prior trend’s magnitude. The library supports multiple simultaneous calls with different settings, making it ideal for multi-timeframe strategies.
How It Works:
The library’s f_calculatePivot function tracks price movements to detect pivot points:
Minimum Range Threshold : A potential pivot is considered if the price moves beyond the min_range_pct percentage of the current high (for a high pivot) or low (for a low pivot), ensuring sufficient movement.
Reversal Confirmation : A pivot is confirmed if the price reverses from the potential pivot by at least the reversal_pct percentage of the distance between the last confirmed pivot and the current potential pivot, measuring the retracement relative to the prior trend’s magnitude.
The function alternates between tracking highs (in an uptrend) and lows (in a downtrend), updating the trend when a pivot is confirmed.
State management uses an array of pivot_state objects, allowing independent calculations for different timeframes and min_range_pct values within the same script.
## Technical Reference
Functions:
f_calculatePivot(series float _high, series float _low, float _min_range_pct, float _reversal_pct) →
- Parameters:
_high : The high price series (e.g., high or math.max(open, close) ).
_low : The low price series (e.g., low or math.min(open, close) ).
_min_range_pct : The minimum percentage price movement to consider a potential pivot.
_reversal_pct : The percentage of the prior trend’s distance required to confirm a pivot.
- Returns:
A tuple containing:
isNewPivot : Boolean indicating if a new pivot was confirmed.
last_confirmed_pivot : The most recent confirmed pivot (type pivot ).
temp_pivot : The current temporary pivot (type pivot ).
Pivot type:
idx (series int) : Bar index of the pivot.
typ (series int) : Type of pivot ( PIVOT_HIGH or PIVOT_LOW ).
prc (series float) : Price of the pivot.
tme (series int) : Timestamp of the pivot.
Constants (internal):
TREND_LONG , TREND_SHORT : Trend direction indicators (1, -1).
PIVOT_HIGH , PIVOT_LOW : Pivot type indicators (1, -1).
✨ Example of Use:
//@version=5
indicator("Pivot Example", overlay=true)
import jal9000/pivots/1 as pivots
// Inputs
min_range_pct = input.float(20.0, 'Min Range %')
reversal_pct = input.float(30.0, 'Reversal %')
ignore_wick = input.bool(true, 'Ignore wick')
h = ignore_wick ? math.max(open, close) : high
l = ignore_wick ? math.min(open, close) : low
// Call the function with high, low, and input parameters
= pivots.f_calculatePivot(h, l, min_range_pct, reversal_pct)
// Variable to store previous confirmed pivot outside the function
var pivots.pivot prev_confirmed_pivot = na
// Draw the line if a new pivot is confirmed and previous pivot exists
if is_new_pivot
if not na(prev_confirmed_pivot) and not na(new_confirmed_pivot)
line.new(x1 = prev_confirmed_pivot.idx, y1 = prev_confirmed_pivot.prc, x2 = new_confirmed_pivot.idx, y2 = new_confirmed_pivot.prc, color = color.blue, width = 1)
prev_confirmed_pivot := new_confirmed_pivot
## Release Notes
v1
- Initial release of the pivots library with f_calculatePivot function for detecting pivot points and supporting multiple configurations and timeframes.
v2
- Code is Pinescript V6 ready. Remains identified as V5, but changing the version number is the only thing that is required to be v6.
Indicateurs et stratégies
SessionRangeLibraryLibrary "SessionRangeLibrary"
TODO: add library description here
update(session)
Parameters:
session (string)
Data
Fields:
drh (series float)
drl (series float)
idrh (series float)
idrl (series float)
mid (series float)
FibonacciRetracementHi all!
This library will help you draw Fibonacci retracement levels (zones). The code is from my indicator "Fibonacci retracement" (). You can see that description for more information about the behaviour and example of how to use this library. The code is almost the same with the addition of alerts. If the alert frequency is 'alert.freq_once_per_bar_close' alert messages will be concatenated and have a header saying how many messages it contains (if it's more than 1).
Hope this is of help!
Library "FibonacciRetracement"
ConcateAlerts(context)
Concatenates all alerts from the bar to one string (separated by new lines) and clears alert messages on the current bar.
Parameters:
context (Context)
AddAlert(context, message, unshiftInsteadOfPush)
Parameters:
context (Context)
message (string)
unshiftInsteadOfPush (bool)
Range(context, structure, settings)
Will return values if new levels/zones should be drawn.
Parameters:
context (Context) : The 'Context' for the Fibonacci retracement.
structure (Structure type from mickes/PriceAction/1) : The current 'Structure' from the 'MarketStructure' library.
settings (Settings) : The 'Settings' object for the 'Context'.
Returns: A tuple with the start and end pivot if new zones should be drawn, ' ' otherwise.
DrawAll(context, settings, start, end)
Draws lines and labels for the zone. It will also set the 'Price' value that will be used for absolute positions.
Parameters:
context (Context) : The 'Context' for the Fibonacci retracement.
settings (Settings) : The 'Settings' object for the 'Context'.
start (Pivot type from mickes/PriceAction/1)
end (Pivot type from mickes/PriceAction/1)
AlertActive(context, settings)
Will alert for all zones that are active. If multiple alert messages are added they will be concatenated (separated by a new line) with a header saying how many messages the alert contains.
Parameters:
context (Context) : The 'Context' for the Fibonacci retracement. This contains the zones that will be alerted if price (wick or close according to the settings) enters it.
settings (Settings) : The 'Settings' object for the 'Context'.
TrendlineSettings
Holds all the values for 'TrendlineSettings'.
Fields:
Enabled (series bool) : If the trendline should be visible or not.
Color (series color) : The color of the trendline.
Style (series string) : The style of the trendline (as a string).
GenericZonesSettings
Holds all the values for 'GenericZonesSettings', that will be applicable to all drawn objects.
Fields:
ExtendRight (series bool) : If all lines should extend to the right or not.
Style (series string) : The style of all drawn lines
Reverse (series bool) : If true, all lines will be reversed.
Prices (series bool) : If price levels should be shown or not.
Levels (series bool) : If levels should be shown or not.
LevelsValue (series string) : Either 'Value' or 'Percent'. Defined if value or percentage should be shown.
FontSize (series int) : The for size of the text in labels drawn.
LabelsPosition (series string) : Coul be 'Left', 'Rigth' or 'Adapt'. 'Adapt' will try to adapt the labels position to the prices.
ZoneSettings
Holds all the values for 'ZoneSettings'.
Fields:
Enabled (series bool) : If this zone is enabled or not.
Level (series float) : The level of the zone.
Color (series color) : The color that will be displayed.
Price (series float) : The price of the level. Will be set internally.
Settings
Holds all the values for 'Settings'.
Fields:
PivotLeftLength (series int) : The left length used to find pivots through the 'MarketStructure' library.
PivotRightLength (series int) : The right length used to find pivots through the 'MarketStructure' library.
Trendline (TrendlineSettings) : The settings for the 'Trendline' object.
GenericZonesSettings (GenericZonesSettings) : The setting applicable to all zones.
AlertFrequency (series string) : The frequency for the alerts. If 'alert.freq_once_per_bar_close', alert messages will be concatenated and have a header saying how many messages it contains (if it's more than 1).
AlertPrice (series string) : The price that has to enter a zone. Can be 'Close' (the closing price) or 'Wick' (the whole candle needs to be in the zone).
Zone1 (ZoneSettings) : The 'ZoneSettings' that represents this zone.
Zone2 (ZoneSettings) : The 'ZoneSettings' that represents this zone.
Zone3 (ZoneSettings) : The 'ZoneSettings' that represents this zone.
Zone4 (ZoneSettings) : The 'ZoneSettings' that represents this zone.
Zone5 (ZoneSettings) : The 'ZoneSettings' that represents this zone.
Zone6 (ZoneSettings) : The 'ZoneSettings' that represents this zone.
Zone7 (ZoneSettings) : The 'ZoneSettings' that represents this zone.
Zone8 (ZoneSettings) : The 'ZoneSettings' that represents this zone.
Zone9 (ZoneSettings) : The 'ZoneSettings' that represents this zone.
Zone10 (ZoneSettings) : The 'ZoneSettings' that represents this zone.
Zone11 (ZoneSettings) : The 'ZoneSettings' that represents this zone.
Zone12 (ZoneSettings) : The 'ZoneSettings' that represents this zone.
Zone13 (ZoneSettings) : The 'ZoneSettings' that represents this zone.
Zone14 (ZoneSettings) : The 'ZoneSettings' that represents this zone.
Zone15 (ZoneSettings) : The 'ZoneSettings' that represents this zone.
Zone16 (ZoneSettings) : The 'ZoneSettings' that represents this zone.
Zone17 (ZoneSettings) : The 'ZoneSettings' that represents this zone.
Zone18 (ZoneSettings) : The 'ZoneSettings' that represents this zone.
Zone19 (ZoneSettings) : The 'ZoneSettings' that represents this zone.
Zone20 (ZoneSettings) : The 'ZoneSettings' that represents this zone.
Zone21 (ZoneSettings) : The 'ZoneSettings' that represents this zone.
Zone22 (ZoneSettings) : The 'ZoneSettings' that represents this zone.
Zone23 (ZoneSettings) : The 'ZoneSettings' that represents this zone.
Zone24 (ZoneSettings) : The 'ZoneSettings' that represents this zone.
Context
Holds all the values for 'Context'.
Fields:
Lines (array) : All the drawn lines for the current 'Context'.
Labels (array) : All the drawn labels for the current 'Context'.
Boxes (array) : All the drawn boxes for the current 'Context'.
Alerts (array) : All the alert messages on the current tick.
Start (series int) : The start bar index of the current 'Context'.

PriceActionLibrary "PriceAction"
Hi all!
This library will help you to plot the market structure and liquidity. By now, the only part in the price action section is liquidity, but I plan to add more later on. The market structure will be split into two parts, 'Internal' and 'Swing' with separate pivot lengths. For these two trends it will show you:
• Break of structure (BOS)
• Change of character (CHoCH/CHoCH+) (mandatory)
• Equal high/low (EQH/EQL)
It's inspired by "Smart Money Concepts (SMC) " by LuxAlgo.
This library is now the same code as the code in my library 'MarketStructure', but it has evolved into a more price action oriented library than just a market structure library. This is more accurate and I will continue working on this library to keep it growing.
This code does not provide any examples, but you can look at my indicators 'Market structure' () and 'Order blocks' (), where I use the 'MarketStructure' library (which is the same code).
Market structure
Both of these market structures can be enabled/disabled by setting them to 'na'. The pivots lengths can be configured separately. The pivots found will be the 'base' of and will show you when price breaks it. When that happens a break of structure or a change of character will be created. The latest 5 pivots found within the current trends will be kept to take action on. They are cleared on a change of character, so nothing (break of structures or change of characters) can happen on pivots before a trend change. The internal market structure is shown with dashed lines and swing market structure is shown with solid lines.
Labels for a change of character can have either the text 'CHoCH' or 'CHoCH+'. A Change of Character plus is formed when price fails to form a higher high or a lower low before reversing. Note that a pivot that is created after the change of character might have a higher high or a lower low, thus not making the break a 'CHoCH+'. This is not changed after the pivot is found but is kept as is.
A break of structure is removed if an earlier pivot within the same trend is broken, i.e. another break of structure (with a longer distance) is created. Like in the images below, the first pivot (in the first image) is removed when an earlier pivot's higher price within the same trend is broken (the second image):
[image [https://www.tradingview.com/x/PRP6YtPA/
Equal high/lows have a configurable color setting and can be configured to be extended to the right. Equal high/lows are only possible if it's not been broken by price. A factor (percentage of width) of the Average True Length (of length 14) that the pivot must be within to to be considered an Equal high/low. Equal highs/lows can be of 2 pivots or more.
You are able to show the pivots that are used. "HH" (higher high), "HL" (higher low), "LH" (lower high), "LL" (lower low) and "H"/"L" (for pivots (high/low) when the trend has changed) are the labels used. There are also labels for break of structures ('BOS') and change of characters ('CHoCH' or 'CHoCH+'). The size of these texts is set in the 'FontSize' setting.
When programming I focused on simplicity and ease of read. I did not focus on performance, I will do so if it's a problem (haven't noticed it is one yet).
You can set alerts for when a change of character, break of structure or an equal high/low (new or an addition to a previously found) happens. The alerts that are fired are on 'once_per_bar_close' to avoid repainting. This has the drawback to alert you when the bar closes.
Price action
The indicator will create lines and zones for spotted liquidity. It will draw a line (with dotted style) at the price level that was liquidated, but it will also draw a zone from that level to the bar that broke the pivot high or low price. If that zone is large the liquidation is big and might be significant. This can be disabled in the settings. You can also change the confirmation candles (that does not close above or below the pivot level) needed after a liquidation and how many pivots back to look at.
The lines and boxes drawn will look like this if the color is orange:
Hope this is of help!
Will draw out the market structure for the disired pivot length.
Liqudity(liquidity)
Will draw liquidity.
Parameters:
liquidity (Liquidity) : The 'PriceAction.Liquidity' object.
Pivot(structure)
Sets the pivots in the structure.
Parameters:
structure (Structure)
PivotLabels(structure)
Draws labels for the pivots found.
Parameters:
structure (Structure)
EqualHighOrLow(structure)
Draws the boxes for equal highs/lows. Also creates labels for the pivots included.
Parameters:
structure (Structure)
BreakOfStructure(structure)
Will create lines when a break of strycture occures.
Parameters:
structure (Structure)
Returns: A boolean that represents if a break of structure was found or not.
ChangeOfCharacter(structure)
Will create lines when a change of character occures. This line will have a label with "CHoCH" or "CHoCH+".
Parameters:
structure (Structure)
Returns: A boolean that represents if a change of character was found or not.
VisualizeCurrent(structure)
Will create a box with a background for between the latest high and low pivots. This can be used as the current trading range (if the pivots broke strucure somehow).
Parameters:
structure (Structure)
StructureBreak
Holds drawings for a structure break.
Fields:
Line (series line) : The line object.
Label (series label) : The label object.
Pivot
Holds all the values for a found pivot.
Fields:
Price (series float) : The price of the pivot.
BarIndex (series int) : The bar_index where the pivot occured.
Type (series int) : The type of the pivot (-1 = low, 1 = high).
Time (series int) : The time where the pivot occured.
BreakOfStructureBroken (series bool) : Sets to true if a break of structure has happened.
LiquidityBroken (series bool) : Sets to true if a liquidity of the price level has happened.
ChangeOfCharacterBroken (series bool) : Sets to true if a change of character has happened.
Structure
Holds all the values for the market structure.
Fields:
LeftLength (series int) : Define the left length of the pivots used.
RightLength (series int) : Define the right length of the pivots used.
Type (series Type) : Set the type of the market structure. Two types can be used, 'internal' and 'swing' (0 = internal, 1 = swing).
Trend (series int) : This will be set internally and can be -1 = downtrend, 1 = uptrend.
EqualPivotsFactor (series float) : Set how the limits are for an equal pivot. This is a factor of the Average True Length (ATR) of length 14. If a low pivot is considered to be equal if it doesn't break the low pivot (is at a lower value) and is inside the previous low pivot + this limit.
ExtendEqualPivotsZones (series bool) : Set to true if you want the equal pivots zones to be extended.
ExtendEqualPivotsStyle (series string) : Set the style of equal pivot zones.
ExtendEqualPivotsColor (series color) : Set the color of equal pivot zones.
EqualHighs (array) : Holds the boxes for zones that contains equal highs.
EqualLows (array) : Holds the boxes for zones that contains equal lows.
BreakOfStructures (array) : Holds all the break of structures within the trend (before a change of character).
Pivots (array) : All the pivots in the current trend, added with the latest first, this is cleared when the trend changes.
FontSize (series int) : Holds the size of the font displayed.
AlertChangeOfCharacter (series bool) : Holds true or false if a change of character should be alerted or not.
AlertBreakOfStructure (series bool) : Holds true or false if a break of structure should be alerted or not.
AlerEqualPivots (series bool) : Holds true or false if equal highs/lows should be alerted or not.
Liquidity
Holds all the values for liquidity.
Fields:
LiquidityPivotsHigh (array) : All high pivots for liquidity.
LiquidityPivotsLow (array) : All low pivots for liquidity.
LiquidityConfirmationBars (series int) : The number of bars to confirm that a liquidity is valid.
LiquidityPivotsLookback (series int) : A number of pivots to look back for.
FontSize (series int) : Holds the size of the font displayed.
PriceAction
Holds all the values for the general price action and the market structures.
Fields:
Liquidity (Liquidity)
Swing (Structure) : Placeholder for all objects used for the swing market structure.
Internal (Structure) : Placeholder for all objects used for the internal market structure.

ATR by Session Library [1CG]Library "ATRxSession"
This library shows you how big the bars usually are during a trading session. It looks only at the times you choose (like New York or London hours), measures the “true range” of every bar in that session, then finds the average for that session. It keeps the last N sessions and gives you their overall average, so you can quickly see how much the market typically moves per bar during your chosen session.
Call getSessionAtr(timezone, session, sessionCount) from your script, and it will return a single number: the average per-bar volatility during the chosen session, based on the last N completed sessions. This makes it easy to plug session-specific volatility into your own indicators or strategies.
getSessionAtr(_timezone, _session, _sessionCount)
getSessionAtr - Computes a session-aware ATR over completed sessions.
Parameters:
_timezone (string) : (string) - Timezone string to evaluate session timing.
_session (string) : (string) - Session time range string (e.g., "0930-1600").
_sessionCount (int) : (int) - Number of past completed sessions to include in the rolling average.
Returns: (float) - The average ATR across the last N completed sessions, or na if not enough data.

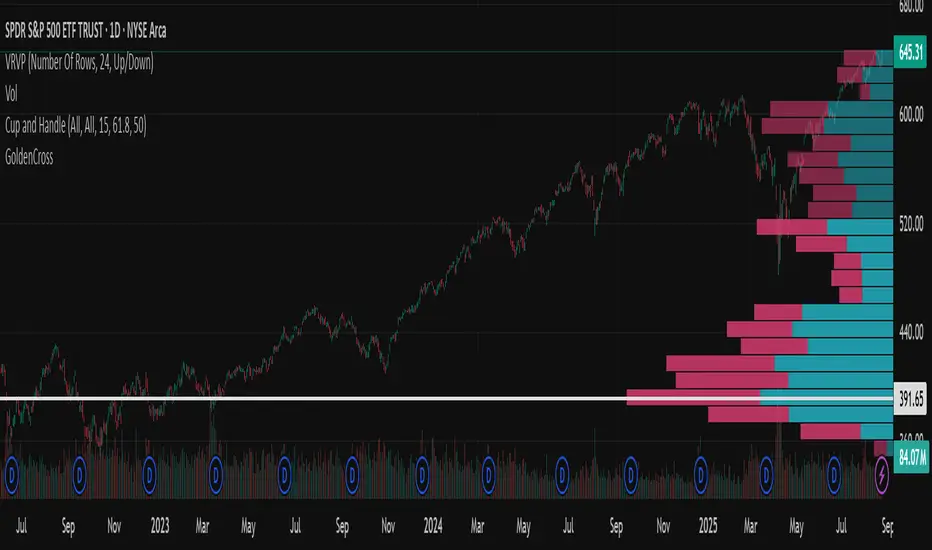
GoldenCrossLibrary "GoldenCross"
get_signals(short_len, long_len)
Parameters:
short_len (int)
long_len (int)
BarLibrary "Bar"
A comprehensive library for creating and managing custom multi-timeframe (MTF) candlestick bars without using request.security calls, providing enhanced visualization and analytical capabilities with improved performance
Candle()
Creates a new candle object initialized with current bar's OHLC data
Returns: A new _Candle instance with current market data
method body(this)
Calculates the absolute size of the candle body (distance between open and close)
Namespace types: _Candle
Parameters:
this (_Candle)
Returns: The absolute difference between closing and opening prices
method topWick(this)
Calculates the length of the upper wick (shadow above the candle body)
Namespace types: _Candle
Parameters:
this (_Candle)
Returns: The distance from the higher of open/close to the high price
method bottomWick(this)
Calculates the length of the lower wick (shadow below the candle body)
Namespace types: _Candle
Parameters:
this (_Candle)
Returns: The distance from the low price to the lower of open/close
method display(this, bullishColor, bearishColor, transp, borderWidth, lineWidth)
Renders the candle visually on the chart with customizable colors and styling options
Namespace types: _Candle
Parameters:
this (_Candle)
bullishColor (color)
bearishColor (color)
transp (int)
borderWidth (int)
lineWidth (int)
candles(tf, autoDisplay)
Creates and manages an array of custom timeframe candles with optional automatic display
Parameters:
tf (string) : Target timeframe string (e.g., "60", "240", "D") for candle aggregation
autoDisplay (bool)
Returns: Array containing all completed candles for the specified timeframe
_Candle
Custom candlestick data structure that stores OHLCV data with visual rendering components
Fields:
start (series int) : Opening timestamp of the candle period
end (series int) : Closing timestamp of the candle period
o (series float) : Opening price of the candle
h (series float) : Highest price reached during the candle period
l (series float) : Lowest price reached during the candle period
c (series float) : Closing price of the candle
v (series float) : Volume traded during the candle period
bodyBox (series box)
wickLine (series line)
Example Usage
// Change version with latest version
import EmreKb/Bar/1 as bar
// "240" for 4h timeframe
// true for auto display candles on chart (default: false)
candlesArr = bar.candles("240", true)
zuperviewResourcesLibrary "zuperview"
ComputeMAValue(maType, series, period)
ComputeMAValue
@description Computes the moving average (MA) value based on the specified MA type.
Parameters:
maType (string) : (string) The type of moving average: "EMA", "SMA", "RMA", "WMA", "HMA", "VWMA", "LinReg".
series (float) : (float) The input price series (typically close).
period (simple int) : (int) The number of periods used for MA calculation.
Returns: (float) The computed MA value or `na` if maType is invalid.
ComputeATRValue(period)
ComputeATRValue
@description Computes the moving average (ATR) value based on the specified ATR type.
Parameters:
period (int) : (int) The number of periods used for MA calculation.
Returns: (float) The computed ATR value or `na` if maType is invalid.
Max(src, period)
Parameters:
src (float)
period (int)
Min(src, period)
Parameters:
src (float)
period (int)
ComputeRSIValue(src, period, smooth)
ComputeRSIValue
@description Computes the moving average (RSI) value based on the specified RSI type.
Parameters:
src (float) : (series) Input series (series float), which can be close (`close`), open (`open`), high (`high`), low (`low`), or any other price-based series.
period (int) : (int) The number of periods used for MA calculation.
smooth (int)
Returns: (float) The computed RSI value or `na` if maType is invalid.
ComputeSMMAValue(src, period)
ComputeSMMAValue
@description Computes the moving average (SMMA) value based on the specified SMMA type.
Parameters:
src (float) : (series) Input series (series float), which can be close (`close`), open (`open`), high (`high`), low (`low`), or any other price-based series.
period (int) : (int) The number of periods used for MA calculation.
Returns: (float) The computed SMMA value or `na` if maType is invalid.
ComputeStochasticValue(src, periodD, periodK, smoothingMethod, smoothingPeriod)
ComputeStochasticValue
@description Computes the moving average (SMMA) value based on the specified SMMA type.
Parameters:
src (float) : (series) Input series (series float), which can be close (`close`), open (`open`), high (`high`), low (`low`), or any other price-based series.
periodD (simple int) : (int) The number of periods used for MA calculation.
periodK (int) : (int) The number of periods used for MA calculation.
smoothingMethod (string) : (string) The type of moving average: "EMA", "SMA", "RMA", "WMA", "HMA", "VWMA", "LinReg".
smoothingPeriod (simple int) : (int) The number of periods used for MA calculation.
Returns: (float) The computed Stochastic(K, D) value or `na` if maType is invalid.
FindSwingsByNeighborhood(arraySwingTop, arraySwingBottom, neighborhood)
Find Swings By Neighborhood
@description Computes the moving average (SMMA) value based on the specified SMMA type.
Parameters:
arraySwingTop (array) : (array): An array to store detected swing highs.
arraySwingBottom (array) : (array): An array to store detected swing lows.
neighborhood (int) : (int): The number of bars to consider when identifying a swing point.
Returns: none
FindSwingsByOffset(arraySwingTop, arraySwingBottom, minSwingLength)
Find Swings By Offset
@description Identifies swing points based on a minimum swing length criteria.
Parameters:
arraySwingTop (array) : (array): An array to store detected swing highs.
arraySwingBottom (array) : (array): An array to store detected swing lows.
minSwingLength (float) : (float): The minimum price movement required to qualify as a swing point.
Returns: none
SwingPoint
Fields:
Key (series int)
IsTop (series bool)
Price (series float)
BarStart (series int)
BarEnd (series int)
TimeStart (series int)
TimeEnd (series int)
Sign (series int)
Label (series label)

BecakFloatingPanelsLibrary "BecakFloatingPanels"
Library for creating floating indicator panels with MACD, RSI, and Stochastic indicators
calculateMacd(source, fastLength, slowLength, signalLength)
Calculate MACD components
Parameters:
source (float) : Price source for calculation
fastLength (simple int) : Fast EMA period
slowLength (simple int) : Slow EMA period
signalLength (simple int) : Signal line period
Returns: MacdData MACD calculation results
calculateRsi(source, length)
Calculate RSI
Parameters:
source (float) : Price source for calculation
length (simple int) : RSI period
Returns: float RSI value
calculateStochastic(source, high, low, kLength, kSmoothing, dSmoothing)
Calculate Stochastic components
Parameters:
source (float) : Price source for calculation
high (float) : High prices
low (float) : Low prices
kLength (int) : %K period
kSmoothing (int) : %K smoothing period
dSmoothing (int) : %D smoothing period
Returns: StochData Stochastic calculation results
calculateStochSignals(stochK, stochD, overboughtLevel, oversoldLevel)
Calculate Stochastic signals
Parameters:
stochK (float) : Stochastic %K series
stochD (float) : Stochastic %D series
overboughtLevel (float) : Overbought threshold
oversoldLevel (float) : Oversold threshold
Returns: StochSignals Signal flags
calculateChartMetrics(high, low, lookbackLength)
Calculate chart range and positioning metrics
Parameters:
high (float) : High prices
low (float) : Low prices
lookbackLength (int) : Lookback period
Returns: ChartMetrics Chart positioning data
calculateMacdRange(macdLine, signalLine, histogram, safeLookback)
Calculate MACD range for normalization
Parameters:
macdLine (float) : MACD line series
signalLine (float) : Signal line series
histogram (float) : Histogram series
safeLookback (int) : Lookback period
Returns: MacdRange MACD range metrics
initVisualArrays()
Initialize visual arrays
Returns: VisualArrays Container with initialized arrays
clearVisuals(visuals)
Clear all visual elements
Parameters:
visuals (VisualArrays) : VisualArrays container
Returns: void
calculatePanelPositions(chartMetrics, oscPlacement, panelHeight, panelSpacing, centerOffset)
Calculate panel positions based on placement option
Parameters:
chartMetrics (ChartMetrics) : Chart metrics object
oscPlacement (string) : Panel placement option
panelHeight (float) : Panel height percentage
panelSpacing (float) : Panel spacing percentage
centerOffset (float) : Center offset percentage
Returns: PanelPositions Panel boundary coordinates
createPanelBackgrounds(visuals, positions, panelLeft, panelRight, showBackground, transparency)
Create panel backgrounds
Parameters:
visuals (VisualArrays) : VisualArrays container
positions (PanelPositions) : PanelPositions object
panelLeft (int) : Left boundary
panelRight (int) : Right boundary
showBackground (bool) : Show background flag
transparency (int) : Background transparency
Returns: void
drawReferenceLines(visuals, positions, chartMetrics, macdRange, dataLeft, dataRight, panelHeight, rsiOverbought, rsiOversold, stochOverbought, stochOversold)
Draw reference lines for all panels
Parameters:
visuals (VisualArrays) : VisualArrays container
positions (PanelPositions) : PanelPositions object
chartMetrics (ChartMetrics) : ChartMetrics object
macdRange (MacdRange) : MacdRange object
dataLeft (int) : Left data boundary
dataRight (int) : Right data boundary
panelHeight (float) : Panel height percentage
rsiOverbought (int) : RSI overbought level
rsiOversold (int) : RSI oversold level
stochOverbought (int) : Stochastic overbought level
stochOversold (int) : Stochastic oversold level
Returns: void
drawMacdIndicator(visuals, macdLine, signalLine, histogram, macdRange, positions, chartMetrics, barIndex, nextBarIndex, barIndexOffset, panelHeight)
Draw MACD indicator
Parameters:
visuals (VisualArrays) : VisualArrays container
macdLine (float) : MACD line series
signalLine (float) : Signal line series
histogram (float) : Histogram series
macdRange (MacdRange) : MacdRange object
positions (PanelPositions) : PanelPositions object
chartMetrics (ChartMetrics) : ChartMetrics object
barIndex (int) : Current bar index
nextBarIndex (int) : Next bar index
barIndexOffset (int) : Horizontal offset
panelHeight (float) : Panel height percentage
Returns: void
drawRsiIndicator(visuals, rsiValue, positions, chartMetrics, barIndex, nextBarIndex, barIndexOffset, panelHeight)
Draw RSI indicator
Parameters:
visuals (VisualArrays) : VisualArrays container
rsiValue (float) : RSI value
positions (PanelPositions) : PanelPositions object
chartMetrics (ChartMetrics) : ChartMetrics object
barIndex (int) : Current bar index
nextBarIndex (int) : Next bar index
barIndexOffset (int) : Horizontal offset
panelHeight (float) : Panel height percentage
Returns: void
drawStochasticIndicator(visuals, stochK, stochD, positions, chartMetrics, barIndex, nextBarIndex, barIndexOffset, panelHeight, stochOverbought, stochOversold)
Draw Stochastic indicator
Parameters:
visuals (VisualArrays) : VisualArrays container
stochK (float) : Stochastic %K series
stochD (float) : Stochastic %D series
positions (PanelPositions) : PanelPositions object
chartMetrics (ChartMetrics) : ChartMetrics object
barIndex (int) : Current bar index
nextBarIndex (int) : Next bar index
barIndexOffset (int) : Horizontal offset
panelHeight (float) : Panel height percentage
stochOverbought (int) : Overbought level
stochOversold (int) : Oversold level
Returns: void
addStochasticSignals(visuals, buySignal, sellSignal, positions, chartMetrics, currentBarIndex, barIndexOffset, panelHeight, signalIndex)
Add Stochastic buy/sell signals
Parameters:
visuals (VisualArrays) : VisualArrays container
buySignal (bool) : Buy signal series
sellSignal (bool) : Sell signal series
positions (PanelPositions) : PanelPositions object
chartMetrics (ChartMetrics) : ChartMetrics object
currentBarIndex (int) : Current bar index
barIndexOffset (int) : Horizontal offset
panelHeight (float) : Panel height percentage
signalIndex (int) : Signal index for lookback
Returns: void
setPanelLabels(macdLabel, rsiLabel, stochLabel, positions, chartMetrics, labelOffset, panelHeight, barIndexOffset)
Set panel title labels
Parameters:
macdLabel (label) : MACD label reference
rsiLabel (label) : RSI label reference
stochLabel (label) : Stochastic label reference
positions (PanelPositions) : PanelPositions object
chartMetrics (ChartMetrics) : ChartMetrics object
labelOffset (int) : Label horizontal offset
panelHeight (float) : Panel height percentage
barIndexOffset (int) : Horizontal offset
Returns: void
showDebugInfo(chartMetrics, debugMode)
Display debug information
Parameters:
chartMetrics (ChartMetrics) : ChartMetrics object
debugMode (bool) : Debug mode flag
Returns: void
ChartMetrics
Chart metrics container
Fields:
visibleHigh (series float) : Highest visible price
visibleLow (series float) : Lowest visible price
chartRange (series float) : Price range of chart
chartCenter (series float) : Center point of chart
MacdData
MACD calculation results
Fields:
macdLine (series float) : Main MACD line
signalLine (series float) : Signal line
histogram (series float) : MACD histogram
MacdRange
MACD range metrics for normalization
Fields:
highest (series float) : Highest MACD value
lowest (series float) : Lowest MACD value
BRange (series float) : Total range
StochData
Stochastic calculation results
Fields:
k_smooth (series float) : Smoothed %K line
d (series float) : %D line
StochSignals
Stochastic signals
Fields:
buySignal (series bool) : Buy signal flag
sellSignal (series bool) : Sell signal flag
PanelPositions
Panel positioning data
Fields:
macdTop (series float) : MACD panel top
macdBottom (series float) : MACD panel bottom
rsiTop (series float) : RSI panel top
rsiBottom (series float) : RSI panel bottom
stochTop (series float) : Stochastic panel top
stochBottom (series float) : Stochastic panel bottom
VisualArrays
Visual elements arrays container
Fields:
macdLines (array) : Array of MACD lines
macdHist (array) : Array of MACD histogram boxes
rsiLines (array) : Array of RSI lines
stochLines (array) : Array of Stochastic lines
stochAreas (array) : Array of Stochastic areas
stochSignals (array) : Array of Stochastic signals
panelBackgrounds (array) : Array of panel backgrounds

ConcatenatedAlertsHi all!
This library is useful if you want to concatenate every tick alert for sending on bar close. The 'alert()' function, provided by Tradingview, with the 'freq' parameter set to 'alert.freq_once_per_bar_close' only fires when the realtime bar closes. So if something has happened intrabar, the alert wont be sent.
This library concatenates all alert messages during the bar and sends them on bar close with a header saying how many messages it contains.
It's useful in many cases, but here are a few examples:
When you want alerts for a zone having a breakout (with a candle close) and another one being entered, like this:
When a candle breaks through 2, or more, lines. Like in this example:
There are of course more useful use cases, but above is 2 examples.
The library uses an own enum saying 'alert.freq_all', 'alert.freq_once_per_bar' and 'alert.freq_once_per_bar_close'. The value of this enumeration represents how often an alert will be sent. 'alert.freq_all' and 'alert.freq_once_per_bar' will behave as the once in the 'alert()' function provided by Tradingview. No concatenatination will take place in this case. However, when 'alert.freq_once_per_bar_close' is set, concatenatination will happen with all alert messages during the bar and sent on bar close. Helper functions can be used for both the string value used by the 'alert()' function by Tradingview and this enum type. Example code is provided in the source code, with the usage of input values for both this string and the enumeration.
Hope this is of help!
Concatenate(a_lert, message)
Concatenates all alert messages (called on every tick) to fire all of them with 'Alert()'.
Parameters:
a_lert (Alert) : The 'Alert' object to be used for the alert messages concatination.
message (string) : The string message to be added to the bar alert.
Alert(a_lert)
When the 'Alert.Frequency' is set to fire on the current tick, this function will concatenate all messages on the current bar and fire an alert. Concatenation will occur if 'alert.freq_once_per_bar_close' is set on 'a_lert.Frequency' separated by new lines and a header saying how many messages the bar contains.
Parameters:
a_lert (Alert) : The 'Alert' object to be used for the alert messages concatination and all its 'Messages' will be alerted.
Create(frequency)
Helper function to create an 'Alert' object.
Parameters:
frequency (series Frequency) : The 'Frequency' in the created 'Alert' object.
Returns: The 'Alert' object that can be used for concatination.
CreateFromAlertFreq(alertFreq)
Helper function to convert 'alert.freq_all', 'alert.freq_once_per_bar' or 'lert.freq_once_per_bar_close'.
Parameters:
alertFreq (string) : The 'alert.freq_all', 'alert.freq_once_per_bar' or 'lert.freq_once_per_bar_close' to convert to 'Frequency' enum.
Returns: The 'Alert' object that can be used for concatination.
Alert
Holds all the values for the 'Alert' to be used.
Fields:
Messages (array) : Holds the alert messages within the current bar that will be sent according to 'Frequency'.
Frequency (series Frequency) : The frequency for the final alert. One of 'alert.freq_all', 'alert.freq_once_per_bar' or 'alert.freq_once_per_bar_close'. If 'alert.freq_all' is set the alert messages will be fired on each tick and no concatination will occure. The same when 'alert.freq_once_per_bar' is set, but the alert will only fire once per bar. If 'alert.freq_once_per_bar_close' is set concatenation will occure before sending an alert (with all concatenated messages) on bar close.
SkipAddition (series bool) : Will skip addition of messages. Used internally if 'Frequency' is 'alert.freq_once_per_bar'.
MarketStructureLibMarketStructure Library
This library extends the "MarketStructure" library by mickes () under the Mozilla Public License 2.0, credited to mickes. It provides functions for detecting and visualizing market structure, including Break of Structure (BOS), Change of Character (CHoCH), Equal High/Low (EQH/EQL), and liquidity zones, with enhancements for improved accuracy and customization.
Functionality
Market Structure Detection: Identifies internal (orderflow) and swing market structures using pivot points, with support for BOS, CHoCH, and EQH/EQL.
Volatility Filter: Only confirms pivots when the ATR exceeds a user-defined threshold, reducing false signals in low-volatility markets.
Trend Strength Metric: Calculates a trend strength score based on pivot frequency and volatility, stored in the Structure type for use in scripts.
Customizable Visualizations: Allows users to configure line styles and colors for BOS and CHoCH, and label sizes for pivots, BOS, CHoCH, and liquidity.
Liquidity Zones: Visualizes liquidity levels with confirmation bars and lookback periods.
Methodology
Pivot Detection: Uses ta.pivothigh and ta.pivotlow with a volatility filter (ATR multiplier) to confirm significant pivots.
Trend Strength: Computes a score as pivotCount / LeftLength * (currentATR / ATR), reflecting trend reliability based on pivot frequency and market volatility.
BOS/CHoCH Logic: Detects BOS when price breaks a pivot in the trend direction, and CHoCH when price reverses against the trend, with labels for "MSF" or "MSF+" based on pivot patterns.
EQH/EQL Zones: Creates boxes around equal highs/lows within an ATR-based threshold, with optional extension.
Visualization: Draws lines and labels for BOS, CHoCH, and liquidity, with user-defined styles, colors, and sizes.
Usage
Integration: Import into Pine Script indicators (e.g., import Fenomentn/MarketStructure/1) to analyze market structure.
Configuration: Set pivot lengths, volatility threshold, label sizes, and visualization styles via script inputs.
Alerts: Enable alerts for BOS, CHoCH, and EQH/EQL events, triggered on bar close to avoid repainting.
Best Practices: Use on forex or crypto charts (1m to 12h timeframes) for optimal results. Adjust the volatility threshold for different market conditions.
Originality
This library builds on mickes’ framework by adding:
A volatility-based pivot filter to enhance signal accuracy.
A trend strength metric for assessing trend reliability.
Dynamic label sizing and customizable visualization styles for better usability. No additional open-source code was reused beyond mickes’ library, credited under MPL 2.0.
Developed by Fenomentn. Published under Mozilla Public License 2.0.

TimeSeriesBenchmarkMeasuresLibrary "TimeSeriesBenchmarkMeasures"
Time Series Benchmark Metrics. \
Provides a comprehensive set of functions for benchmarking time series data, allowing you to evaluate the accuracy, stability, and risk characteristics of various models or strategies. The functions cover a wide range of statistical measures, including accuracy metrics (MAE, MSE, RMSE, NRMSE, MAPE, SMAPE), autocorrelation analysis (ACF, ADF), and risk measures (Theils Inequality, Sharpness, Resolution, Coverage, and Pinball).
___
Reference:
- github.com .
- medium.com .
- www.salesforce.com .
- towardsdatascience.com .
- github.com .
mae(actual, forecasts)
In statistics, mean absolute error (MAE) is a measure of errors between paired observations expressing the same phenomenon. Examples of Y versus X include comparisons of predicted versus observed, subsequent time versus initial time, and one technique of measurement versus an alternative technique of measurement.
Parameters:
actual (array) : List of actual values.
forecasts (array) : List of forecasts values.
Returns: - Mean Absolute Error (MAE).
___
Reference:
- en.wikipedia.org .
- The Orange Book of Machine Learning - Carl McBride Ellis .
mse(actual, forecasts)
The Mean Squared Error (MSE) is a measure of the quality of an estimator. As it is derived from the square of Euclidean distance, it is always a positive value that decreases as the error approaches zero.
Parameters:
actual (array) : List of actual values.
forecasts (array) : List of forecasts values.
Returns: - Mean Squared Error (MSE).
___
Reference:
- en.wikipedia.org .
rmse(targets, forecasts, order, offset)
Calculates the Root Mean Squared Error (RMSE) between target observations and forecasts. RMSE is a standard measure of the differences between values predicted by a model and the values actually observed.
Parameters:
targets (array) : List of target observations.
forecasts (array) : List of forecasts.
order (int) : Model order parameter that determines the starting position in the targets array, `default=0`.
offset (int) : Forecast offset related to target, `default=0`.
Returns: - RMSE value.
nmrse(targets, forecasts, order, offset)
Normalised Root Mean Squared Error.
Parameters:
targets (array) : List of target observations.
forecasts (array) : List of forecasts.
order (int) : Model order parameter that determines the starting position in the targets array, `default=0`.
offset (int) : Forecast offset related to target, `default=0`.
Returns: - NRMSE value.
rmse_interval(targets, forecasts)
Root Mean Squared Error for a set of interval windows. Computes RMSE by converting interval forecasts (with min/max bounds) into point forecasts using the mean of the interval bounds, then compares against actual target values.
Parameters:
targets (array) : List of target observations.
forecasts (matrix) : The forecasted values in matrix format with at least 2 columns (min, max).
Returns: - RMSE value for the combined interval list.
mape(targets, forecasts)
Mean Average Percentual Error.
Parameters:
targets (array) : List of target observations.
forecasts (array) : List of forecasts.
Returns: - MAPE value.
smape(targets, forecasts, mode)
Symmetric Mean Average Percentual Error. Calculates the Mean Absolute Percentage Error (MAPE) between actual targets and forecasts. MAPE is a common metric for evaluating forecast accuracy, expressed as a percentage, lower values indicate a better forecast accuracy.
Parameters:
targets (array) : List of target observations.
forecasts (array) : List of forecasts.
mode (int) : Type of method: default=0:`sum(abs(Fi-Ti)) / sum(Fi+Ti)` , 1:`mean(abs(Fi-Ti) / ((Fi + Ti) / 2))` , 2:`mean(abs(Fi-Ti) / (abs(Fi) + abs(Ti))) * 100`
Returns: - SMAPE value.
mape_interval(targets, forecasts)
Mean Average Percentual Error for a set of interval windows.
Parameters:
targets (array) : List of target observations.
forecasts (matrix) : The forecasted values in matrix format with at least 2 columns (min, max).
Returns: - MAPE value for the combined interval list.
acf(data, k)
Autocorrelation Function (ACF) for a time series at a specified lag.
Parameters:
data (array) : Sample data of the observations.
k (int) : The lag period for which to calculate the autocorrelation. Must be a non-negative integer.
Returns: - The autocorrelation value at the specified lag, ranging from -1 to 1.
___
The autocorrelation function measures the linear dependence between observations in a time series
at different time lags. It quantifies how well the series correlates with itself at different
time intervals, which is useful for identifying patterns, seasonality, and the appropriate
lag structure for time series models.
ACF values close to 1 indicate strong positive correlation, values close to -1 indicate
strong negative correlation, and values near 0 indicate no linear correlation.
___
Reference:
- statisticsbyjim.com
acf_multiple(data, k)
Autocorrelation function (ACF) for a time series at a set of specified lags.
Parameters:
data (array) : Sample data of the observations.
k (array) : List of lag periods for which to calculate the autocorrelation. Must be a non-negative integer.
Returns: - List of ACF values for provided lags.
___
The autocorrelation function measures the linear dependence between observations in a time series
at different time lags. It quantifies how well the series correlates with itself at different
time intervals, which is useful for identifying patterns, seasonality, and the appropriate
lag structure for time series models.
ACF values close to 1 indicate strong positive correlation, values close to -1 indicate
strong negative correlation, and values near 0 indicate no linear correlation.
___
Reference:
- statisticsbyjim.com
adfuller(data, n_lag, conf)
: Augmented Dickey-Fuller test for stationarity.
Parameters:
data (array) : Data series.
n_lag (int) : Maximum lag.
conf (string) : Confidence Probability level used to test for critical value, (`90%`, `95%`, `99%`).
Returns: - `adf` The test statistic.
- `crit` Critical value for the test statistic at the 10 % levels.
- `nobs` Number of observations used for the ADF regression and calculation of the critical values.
___
The Augmented Dickey-Fuller test is used to determine whether a time series is stationary
or contains a unit root (non-stationary). The null hypothesis is that the series has a unit root
(is non-stationary), while the alternative hypothesis is that the series is stationary.
A stationary time series has statistical properties that do not change over time, making it
suitable for many time series forecasting models. If the test statistic is less than the
critical value, we reject the null hypothesis and conclude the series is stationary.
___
Reference:
- www.jstor.org
- en.wikipedia.org
theils_inequality(targets, forecasts)
Calculates Theil's Inequality Coefficient, a measure of forecast accuracy that quantifies the relative difference between actual and predicted values.
Parameters:
targets (array) : List of target observations.
forecasts (array) : Matrix with list of forecasts, ordered column wise.
Returns: - Theil's Inequality Coefficient value, value closer to 0 is better.
___
Theil's Inequality Coefficient is calculated as: `sqrt(Sum((y_i - f_i)^2)) / (sqrt(Sum(y_i^2)) + sqrt(Sum(f_i^2)))`
where `y_i` represents actual values and `f_i` represents forecast values.
This metric ranges from 0 to infinity, with 0 indicating perfect forecast accuracy.
___
Reference:
- en.wikipedia.org
sharpness(forecasts)
The average width of the forecast intervals across all observations, representing the sharpness or precision of the predictive intervals.
Parameters:
forecasts (matrix) : The forecasted values in matrix format with at least 2 columns (min, max).
Returns: - Sharpness The sharpness level, which is the average width of all prediction intervals across the forecast horizon.
___
Sharpness is an important metric for evaluating forecast quality. It measures how narrow or wide the
prediction intervals are. Higher sharpness (narrower intervals) indicates greater precision in the
forecast intervals, while lower sharpness (wider intervals) suggests less precision.
The sharpness metric is calculated as the mean of the interval widths across all observations, where
each interval width is the difference between the upper and lower bounds of the prediction interval.
Note: This function assumes that the forecasts matrix has at least 2 columns, with the first column
representing the lower bounds and the second column representing the upper bounds of prediction intervals.
___
Reference:
- Hyndman, R. J., & Athanasopoulos, G. (2018). Forecasting: principles and practice. OTexts. otexts.com
resolution(forecasts)
Calculates the resolution of forecast intervals, measuring the average absolute difference between individual forecast interval widths and the overall sharpness measure.
Parameters:
forecasts (matrix) : The forecasted values in matrix format with at least 2 columns (min, max).
Returns: - The average absolute difference between individual forecast interval widths and the overall sharpness measure, representing the resolution of the forecasts.
___
Resolution is a key metric for evaluating forecast quality that measures the consistency of prediction
interval widths. It quantifies how much the individual forecast intervals vary from the average interval
width (sharpness). High resolution indicates that the forecast intervals are relatively consistent
across observations, while low resolution suggests significant variation in interval widths.
The resolution is calculated as the mean absolute deviation of individual interval widths from the
overall sharpness value. This provides insight into the uniformity of the forecast uncertainty
estimates across the forecast horizon.
Note: This function requires the forecasts matrix to have at least 2 columns (min, max) representing
the lower and upper bounds of prediction intervals.
___
Reference:
- (sites.stat.washington.edu)
- (www.jstor.org)
coverage(targets, forecasts)
Calculates the coverage probability, which is the percentage of target values that fall within the corresponding forecasted prediction intervals.
Parameters:
targets (array) : List of target values.
forecasts (matrix) : The forecasted values in matrix format with at least 2 columns (min, max).
Returns: - Percent of target values that fall within their corresponding forecast intervals, expressed as a decimal value between 0 and 1 (or 0% and 100%).
___
Coverage probability is a crucial metric for evaluating the reliability of prediction intervals.
It measures how well the forecast intervals capture the actual observed values. An ideal forecast
should have a coverage probability close to the nominal confidence level (e.g., 90%, 95%, or 99%).
For example, if a 95% prediction interval is used, we expect approximately 95% of the actual
target values to fall within those intervals. If the coverage is significantly lower than the
nominal level, the intervals may be too narrow; if it's significantly higher, the intervals may
be too wide.
Note: This function requires the targets array and forecasts matrix to have the same number of
observations, and the forecasts matrix must have at least 2 columns (min, max) representing
the lower and upper bounds of prediction intervals.
___
Reference:
- (www.jstor.org)
pinball(tau, target, forecast)
Pinball loss function, measures the asymmetric loss for quantile forecasts.
Parameters:
tau (float) : The quantile level (between 0 and 1), where 0.5 represents the median.
target (float) : The actual observed value to compare against.
forecast (float) : The forecasted value.
Returns: - The Pinball loss value, which quantifies the distance between the forecast and target relative to the specified quantile level.
___
The Pinball loss function is specifically designed for evaluating quantile forecasts. It is
asymmetric, meaning it penalizes underestimates and overestimates differently depending on the
quantile level being evaluated.
For a given quantile τ, the loss function is defined as:
- If target >= forecast: (target - forecast) * τ
- If target < forecast: (forecast - target) * (1 - τ)
This loss function is commonly used in quantile regression and probabilistic forecasting
to evaluate how well forecasts capture specific quantiles of the target distribution.
___
Reference:
- (www.otexts.com)
pinball_mean(tau, targets, forecasts)
Calculates the mean pinball loss for quantile regression.
Parameters:
tau (float) : The quantile level (between 0 and 1), where 0.5 represents the median.
targets (array) : The actual observed values to compare against.
forecasts (matrix) : The forecasted values in matrix format with at least 2 columns (min, max).
Returns: - The mean pinball loss value across all observations.
___
The pinball_mean() function computes the average Pinball loss across multiple observations,
making it suitable for evaluating overall forecast performance in quantile regression tasks.
This function leverages the asymmetric Pinball loss function to evaluate how well forecasts
capture specific quantiles of the target distribution. The choice of which column from the
forecasts matrix to use depends on the quantile level:
- For τ ≤ 0.5: Uses the first column (min) of forecasts
- For τ > 0.5: Uses the second column (max) of forecasts
This loss function is commonly used in quantile regression and probabilistic forecasting
to evaluate how well forecasts capture specific quantiles of the target distribution.
___
Reference:
- (www.otexts.com)
Correlation HeatMap Matrix Data [TradingFinder]🔵 Introduction
Correlation is a statistical measure that shows the degree and direction of a linear relationship between two assets.
Its value ranges from -1 to +1 : +1 means perfect positive correlation, 0 means no linear relationship, and -1 means perfect negative correlation.
In financial markets, correlation is used for portfolio diversification, risk management, pairs trading, intermarket analysis, and identifying divergences.
Correlation HeatMap Matrix Data TradingFinder is a Pine Script v6 library that calculates and returns raw correlation matrix data between up to 20 symbols. It only provides the data – it does not draw or render the heatmap – making it ideal for use in other scripts that handle visualization or further analysis. The library uses ta.correlation for fast and accurate calculations.
It also includes two helper functions for visual styling :
CorrelationColor(corr) : takes the correlation value as input and generates a smooth gradient color, ranging from strong negative to strong positive correlation.
CorrelationTextColor(corr) : takes the correlation value as input and returns a text color that ensures optimal contrast over the background color.
Library
"Correlation_HeatMap_Matrix_Data_TradingFinder"
CorrelationColor(corr)
Parameters:
corr (float)
CorrelationTextColor(corr)
Parameters:
corr (float)
Data_Matrix(Corr_Period, Sym_1, Sym_2, Sym_3, Sym_4, Sym_5, Sym_6, Sym_7, Sym_8, Sym_9, Sym_10, Sym_11, Sym_12, Sym_13, Sym_14, Sym_15, Sym_16, Sym_17, Sym_18, Sym_19, Sym_20)
Parameters:
Corr_Period (int)
Sym_1 (string)
Sym_2 (string)
Sym_3 (string)
Sym_4 (string)
Sym_5 (string)
Sym_6 (string)
Sym_7 (string)
Sym_8 (string)
Sym_9 (string)
Sym_10 (string)
Sym_11 (string)
Sym_12 (string)
Sym_13 (string)
Sym_14 (string)
Sym_15 (string)
Sym_16 (string)
Sym_17 (string)
Sym_18 (string)
Sym_19 (string)
Sym_20 (string)
🔵 How to use
Import the library into your Pine Script using the import keyword and its full namespace.
Decide how many symbols you want to include in your correlation matrix (up to 20). Each symbol must be provided as a string, for example FX:EURUSD .
Choose the correlation period (Corr\_Period) in bars. This is the lookback window used for the calculation, such as 20, 50, or 100 bars.
Call Data_Matrix(Corr_Period, Sym_1, ..., Sym_20) with your selected parameters. The function will return an array containing the correlation values for every symbol pair (upper triangle of the matrix plus diagonal).
For example :
var string Sym_1 = '' , var string Sym_2 = '' , var string Sym_3 = '' , var string Sym_4 = '' , var string Sym_5 = '' , var string Sym_6 = '' , var string Sym_7 = '' , var string Sym_8 = '' , var string Sym_9 = '' , var string Sym_10 = ''
var string Sym_11 = '', var string Sym_12 = '', var string Sym_13 = '', var string Sym_14 = '', var string Sym_15 = '', var string Sym_16 = '', var string Sym_17 = '', var string Sym_18 = '', var string Sym_19 = '', var string Sym_20 = ''
switch Market
'Forex' => Sym_1 := 'EURUSD' , Sym_2 := 'GBPUSD' , Sym_3 := 'USDJPY' , Sym_4 := 'USDCHF' , Sym_5 := 'USDCAD' , Sym_6 := 'AUDUSD' , Sym_7 := 'NZDUSD' , Sym_8 := 'EURJPY' , Sym_9 := 'EURGBP' , Sym_10 := 'GBPJPY'
,Sym_11 := 'AUDJPY', Sym_12 := 'EURCHF', Sym_13 := 'EURCAD', Sym_14 := 'GBPCAD', Sym_15 := 'CADJPY', Sym_16 := 'CHFJPY', Sym_17 := 'NZDJPY', Sym_18 := 'AUDNZD', Sym_19 := 'USDSEK' , Sym_20 := 'USDNOK'
'Stock' => Sym_1 := 'NVDA' , Sym_2 := 'AAPL' , Sym_3 := 'GOOGL' , Sym_4 := 'GOOG' , Sym_5 := 'META' , Sym_6 := 'MSFT' , Sym_7 := 'AMZN' , Sym_8 := 'AVGO' , Sym_9 := 'TSLA' , Sym_10 := 'BRK.B'
,Sym_11 := 'UNH' , Sym_12 := 'V' , Sym_13 := 'JPM' , Sym_14 := 'WMT' , Sym_15 := 'LLY' , Sym_16 := 'ORCL', Sym_17 := 'HD' , Sym_18 := 'JNJ' , Sym_19 := 'MA' , Sym_20 := 'COST'
'Crypto' => Sym_1 := 'BTCUSD' , Sym_2 := 'ETHUSD' , Sym_3 := 'BNBUSD' , Sym_4 := 'XRPUSD' , Sym_5 := 'SOLUSD' , Sym_6 := 'ADAUSD' , Sym_7 := 'DOGEUSD' , Sym_8 := 'AVAXUSD' , Sym_9 := 'DOTUSD' , Sym_10 := 'TRXUSD'
,Sym_11 := 'LTCUSD' , Sym_12 := 'LINKUSD', Sym_13 := 'UNIUSD', Sym_14 := 'ATOMUSD', Sym_15 := 'ICPUSD', Sym_16 := 'ARBUSD', Sym_17 := 'APTUSD', Sym_18 := 'FILUSD', Sym_19 := 'OPUSD' , Sym_20 := 'USDT.D'
'Custom' => Sym_1 := Sym_1_C , Sym_2 := Sym_2_C , Sym_3 := Sym_3_C , Sym_4 := Sym_4_C , Sym_5 := Sym_5_C , Sym_6 := Sym_6_C , Sym_7 := Sym_7_C , Sym_8 := Sym_8_C , Sym_9 := Sym_9_C , Sym_10 := Sym_10_C
,Sym_11 := Sym_11_C, Sym_12 := Sym_12_C, Sym_13 := Sym_13_C, Sym_14 := Sym_14_C, Sym_15 := Sym_15_C, Sym_16 := Sym_16_C, Sym_17 := Sym_17_C, Sym_18 := Sym_18_C, Sym_19 := Sym_19_C , Sym_20 := Sym_20_C
= Corr.Data_Matrix(Corr_period, Sym_1 ,Sym_2 ,Sym_3 ,Sym_4 ,Sym_5 ,Sym_6 ,Sym_7 ,Sym_8 ,Sym_9 ,Sym_10,Sym_11,Sym_12,Sym_13,Sym_14,Sym_15,Sym_16,Sym_17,Sym_18,Sym_19,Sym_20)
Loop through or index into this array to retrieve each correlation value for your custom layout or logic.
Pass each correlation value to CorrelationColor() to get the corresponding gradient background color, which reflects the correlation’s strength and direction (negative to positive).
For example :
Corr.CorrelationColor(SYM_3_10)
Pass the same correlation value to CorrelationTextColor() to get the correct text color for readability against that background.
For example :
Corr.CorrelationTextColor(SYM_1_1)
Use these colors in a table or label to render your own heatmap or any other visualization you need.

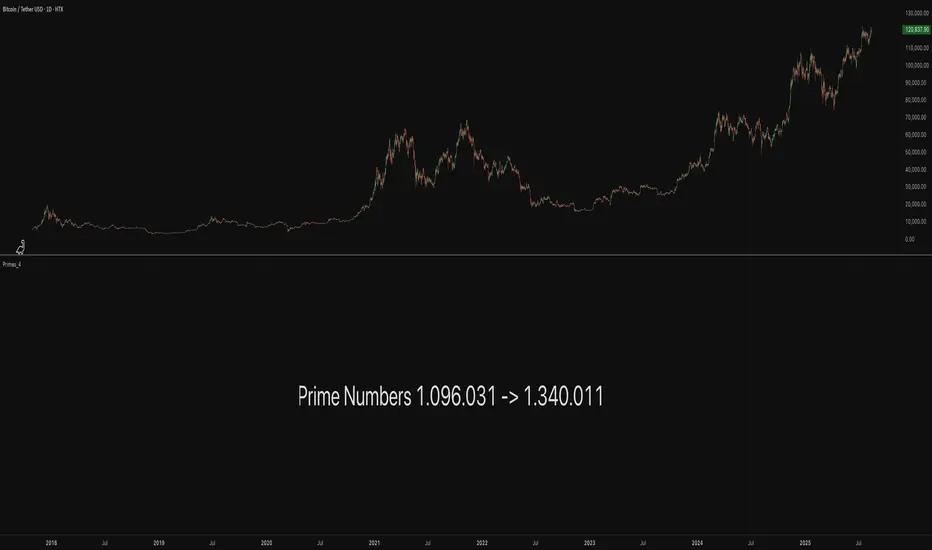
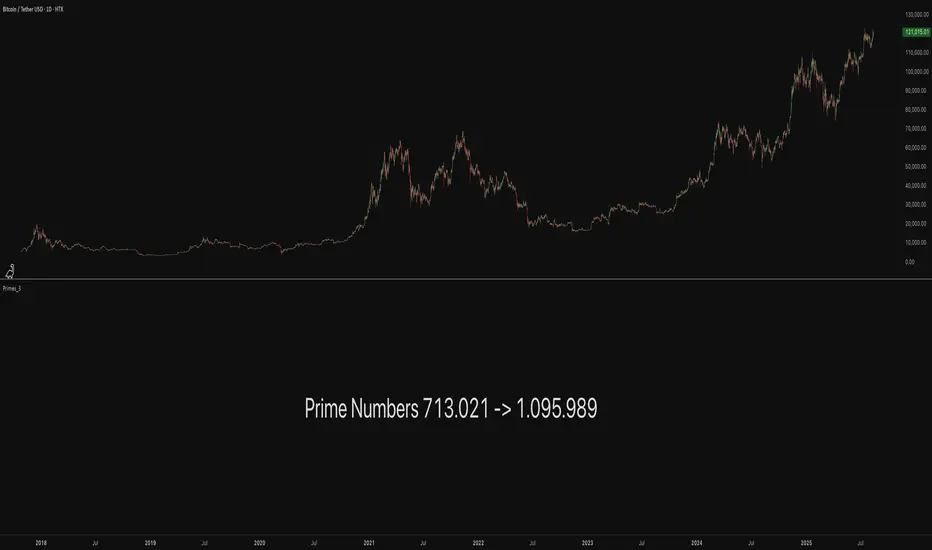
Primes_4These libraries (Primes_1 -> Primes_4) contain arrays of reduced Prime Numbers to minimize the amount of tokens, allowing more information to be exported.
Values, for example:
7001, 7013, 7019, 7027, 7039, 7043, 7057, 7069, 7079, 7103, 7109, 7021
are reduced to:
7001, 13, 19, 27, 39, 43, 57, 69, 79, 7103, 9, 21
With the restoreValues() function found in this library, the reduced values can be restored back to its original state.
7001, 13, 19, 27, 39, 43, 57, 69, 79, 7103, 9, 21
is restored back to:
7001, 7013, 7019, 7027, 7039, 7043, 7057, 7069, 7079, 7103, 7109, 7021
The libraries contain all Prime Numbers from 2 to 1.340.011
------------------------------------------------------------
Library "Primes_4"
Prime Numbers 1.096.031 - 1.340.011
primes_a()
Prime numbers 1.096.031 - 1.205.999
primes_b()
Prime numbers 1.206.013 - 1.317.989
primes_c()
Prime numbers 1.318.003 - 1.340.011
method restoreValues(iArray, iShow, iFrom, iTo)
restoreValues : Restores reduced prime number values in an array to their original state, for example `7001, 13, 19, 27, 39, 43, 57, 69, 79, 7103, 9, 21` is restored to `7001, 7013, 7019, 7027, 7039, 7043, 7057, 7069, 7079, 7103, 7109, 7021`
Namespace types: array
Parameters:
iArray (array)
iShow (bool)
iFrom (int)
iTo (int)
Returns: Initial array with restored prime number values
Primes_3These libraries (Primes_1 -> Primes_4) contain arrays of reduced Prime Numbers to minimize the amount of tokens, allowing more information to be exported.
Values, for example:
7001, 7013, 7019, 7027, 7039, 7043, 7057, 7069, 7079, 7103, 7109, 7021
are reduced to:
7001, 13, 19, 27, 39, 43, 57, 69, 79, 7103, 9, 21
With the restoreValues() function found in the Primes_4 library, the reduced values can be restored back to its original state.
7001, 13, 19, 27, 39, 43, 57, 69, 79, 7103, 9, 21
is restored back to:
7001, 7013, 7019, 7027, 7039, 7043, 7057, 7069, 7079, 7103, 7109, 7021
The libraries contain all Prime Numbers from 2 to 1.340.011
------------------------------------------------------------
Library "Primes_3"
Prime Numbers 713.021 - 1.095.989
primes_a()
Prime numbers 713.021 - 820.997
primes_b()
Prime numbers 821.003 - 928.979
primes_c()
Prime numbers 929.003 - 1.038.953
primes_d()
Prime numbers 1.039.001 - 1.095.989
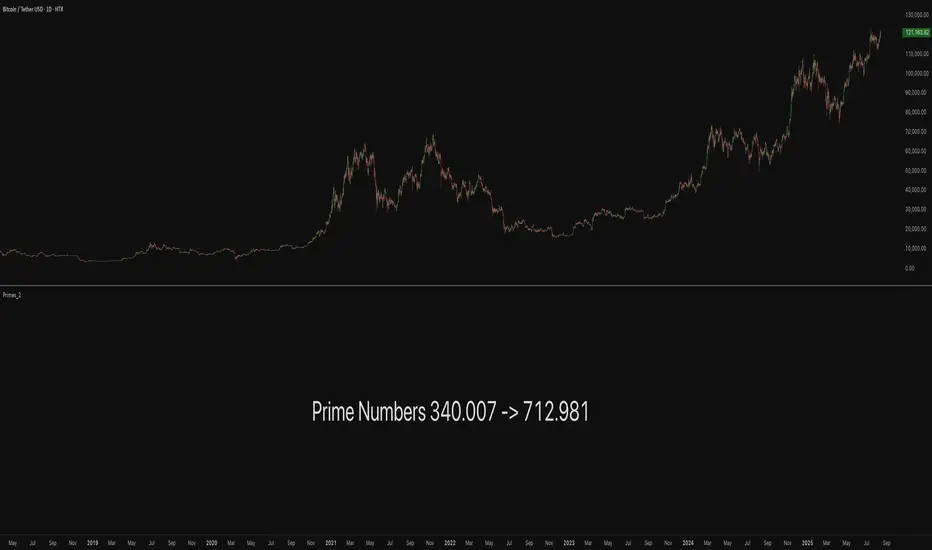
Primes_2These libraries (Primes_1 -> Primes_4) contain arrays of reduced Prime Numbers to minimize the amount of tokens, allowing more information to be exported.
Values, for example:
7001, 7013, 7019, 7027, 7039, 7043, 7057, 7069, 7079, 7103, 7109, 7021
are reduced to:
7001, 13, 19, 27, 39, 43, 57, 69, 79, 7103, 9, 21
With the restoreValues() function found in the Primes_4 library, the reduced values can be restored back to its original state.
7001, 13, 19, 27, 39, 43, 57, 69, 79, 7103, 9, 21
is restored back to:
7001, 7013, 7019, 7027, 7039, 7043, 7057, 7069, 7079, 7103, 7109, 7021
The libraries contain all Prime Numbers from 2 to 1.340.011
------------------------------------------------------------
Library "Primes_2"
Prime Numbers 340.007 - 712.981
primes_a()
Prime numbers 340.007 - 441.971
primes_b()
Prime numbers 442.003 - 545.959
primes_c()
Prime numbers 546.001 - 650.987
primes_d()
Prime numbers 651.017 - 712.981
Primes_1These libraries (Primes_1 -> Primes_4) contain arrays of reduced Prime Numbers to minimize the amount of tokens, allowing more information to be exported.
Values, for example:
7001, 7013, 7019, 7027, 7039, 7043, 7057, 7069, 7079, 7103, 7109, 7021
are reduced to:
7001, 13, 19, 27, 39, 43, 57, 69, 79, 7103, 9, 21
With the restoreValues() function found in the Primes_4 library, the reduced values can be restored back to its original state.
7001, 13, 19, 27, 39, 43, 57, 69, 79, 7103, 9, 21
is restored back to:
7001, 7013, 7019, 7027, 7039, 7043, 7057, 7069, 7079, 7103, 7109, 7021
The libraries contain all Prime Numbers from 2 to 1.340.011
------------------------------------------------------------
Library "Primes_1"
Prime Numbers 2 - 339.991
primes_a()
Prime numbers 2 - 81.689
primes_b()
Prime numbers 81.701 - 175.897
primes_c()
Prime numbers 175.909 - 273.997
primes_d()
Prime numbers 274.007 - 339.991

thors_forex_factory_decodingLibrary "forex_factory_decoding"
Supporting Utility Library for the Live Economic Calendar by toodegrees Indicator; responsible for formatting and saving Forex Factory News events.
isLeapYear()
Finds if it's currently a leap year or not.
Returns: Returns True if the current year is a leap year.
daysMonth(M)
Provides the days in a given month of the year, adjusted during leap years.
Parameters:
M (int) : Month in numerical integer format (i.e. Jan=1).
Returns: Days in the provided month.
MMM(M)
Converts a month from a numerical integer format to a MMM format (i.e. 'Jan').
Parameters:
M (int) : Month in numerical integer format (i.e. Jan=1).
Returns: Month in MMM format (i.e. 'Jan').
array2string(S, FWD)
Converts a string array to a simple string, concatenating its elements.
Parameters:
S (array) : String array, or string array slice, to turn into a simple string.
FWD (bool) : Boolean defaulted to True. If True the array will be concatenated from head to tail, reversed order if False.
Returns: Returns the simple string equivalent of the provided string array.
month2number(M)
Converts a month string in 'MMM' format to its integer equivalent.
Parameters:
M (string) : Month string, in 'MMM' format.
Returns: Returns the integer equivalent of the provided Month string in 'MMM' format.
shiftFWD_Days(D)
Shifts forward the current Date by N days.
Parameters:
D (int) : Number of days to forward-shift, default is 7.
Returns: Returns the forward-shifted date in 'MMM %D' format (i.e. Jan 8, Sep 12).
ff_dow(D)
Converts a numbered day of the week string in format to 'DDD' format (i.e. "1" = Sun).
Parameters:
D (string) : Numbered day of the week from 1 to 7, starting on Sunday.
Returns: Returns the day of the week in 'DDD' format (i.e. "Fri").
ff_currency(C)
Converts a numbered currency string in format to 'CCC' format (i.e. "1" = AUD).
Parameters:
C (string) : Numbered currency, where "1" = "AUD", "2" = "CAD", "3" = "CHF", "4" = "CNY", "5" = "EUR", "6" = "GBP", "7" = "JPY", "8" = "NZD", "9" = "USD".
Returns: Returns the currency in 'CCC' format (i.e. "USD").
ff_t(T)
Converts a time of the day in 'hhmm' format into an intger.
Parameters:
T (string) : Time of the day string in 'hhmm' format.
Returns: Returns the time of the day integer in 'hhmm' format, or -1 if all day.
ff_tod(T)
Converts a time of the day from an integer 'hhmm' format into 'hh:mm' format.
Parameters:
T (int)
Returns: Returns the N Forex Factory News array with time of the day string in 'hh:mm' format, or 'All Day'.
ff_impact(I)
Converts a number from 1 to 4 to a relative color based on Forex Factory Impact types.
Parameters:
I (string) : Impact number string from 1 to 4, where "1" = Holiday, "2" = Low Impact, "3" = Medium Impact, "4" = High Impact.
Returns: Returns the color associated to the impact number based on Forex Factory Impact types.
ff_tmst(D, T)
Parameters:
D (string)
T (string)
decode(ID)
Decodes TOODEGREES_FOREX_FACTORY_SLOT_n Symbols' Pine Seeds data into Forex Factory News Events.
Parameters:
ID (int) : Identifier of the Forex Factory News Event, in "DCHHMMI%T" format (D = day of the week from 1 to 7, C = currency from 1 to 9, HHMM = hour:minute in 24h, I = impact from 1 to 4, %T = event title ID) .
Returns: Returns the Forex Factory News Event.
method pullNews(N, n)
Decodes the Forex Factory News Event and adds it to the Forex Factory News array.
Namespace types: array
Parameters:
N (array type from cegb001/forex_factory_utility/1) : Forex Factory News array.
n (float) : imported data from custom feed.
Returns: void
method readNews(N, S)
Pulls the individual Forex Factory News Event from the custom data feed format (joint News string), decodes them and adds them to the Forex Factory News array.
Namespace types: array
Parameters:
N (array type from cegb001/forex_factory_utility/1) : Forex Factory News array.
S (string) : joint string of the imported data from custom feed.
Returns: void

MSFA_LibraryLibrary "MSFA_library"
TODO: add library description here
getDecimals()
Calculates how many decimals are on the quote price of the current market
Returns: The current decimal places on the market quote price
getPipSize(multiplier)
Calculates the pip size of the current market
Parameters:
multiplier (int) : The mintick point multiplier (1 by default, 10 for FX/Crypto/CFD but can be used to override when certain markets require)
Returns: The pip size for the current market
truncate(number, decimalPlaces)
Truncates (cuts) excess decimal places
Parameters:
number (float) : The number to truncate
decimalPlaces (simple float) : (default=2) The number of decimal places to truncate to
Returns: The given number truncated to the given decimalPlaces
toWhole(number)
Converts pips into whole numbers
Parameters:
number (float) : The pip number to convert into a whole number
Returns: The converted number
toPips(number)
Converts whole numbers back into pips
Parameters:
number (float) : The whole number to convert into pips
Returns: The converted number
getPctChange(value1, value2, lookback)
Gets the percentage change between 2 float values over a given lookback period
Parameters:
value1 (float) : The first value to reference
value2 (float) : The second value to reference
lookback (int) : The lookback period to analyze
Returns: The percent change over the two values and lookback period
random(minRange, maxRange)
Wichmann–Hill Pseudo-Random Number Generator
Parameters:
minRange (float) : The smallest possible number (default: 0)
maxRange (float) : The largest possible number (default: 1)
Returns: A random number between minRange and maxRange
bullFib(priceLow, priceHigh, fibRatio)
Calculates a bullish fibonacci value
Parameters:
priceLow (float) : The lowest price point
priceHigh (float) : The highest price point
fibRatio (float) : The fibonacci % ratio to calculate
Returns: The fibonacci value of the given ratio between the two price points
bearFib(priceLow, priceHigh, fibRatio)
Calculates a bearish fibonacci value
Parameters:
priceLow (float) : The lowest price point
priceHigh (float) : The highest price point
fibRatio (float) : The fibonacci % ratio to calculate
Returns: The fibonacci value of the given ratio between the two price points
getMA(length, maType)
Gets a Moving Average based on type (! MUST BE CALLED ON EVERY TICK TO BE ACCURATE, don't place in scopes)
Parameters:
length (simple int) : The MA period
maType (string) : The type of MA
Returns: A moving average with the given parameters
barsAboveMA(lookback, ma)
Counts how many candles are above the MA
Parameters:
lookback (int) : The lookback period to look back over
ma (float) : The moving average to check
Returns: The bar count of how many recent bars are above the MA
barsBelowMA(lookback, ma)
Counts how many candles are below the MA
Parameters:
lookback (int) : The lookback period to look back over
ma (float) : The moving average to reference
Returns: The bar count of how many recent bars are below the EMA
barsCrossedMA(lookback, ma)
Counts how many times the EMA was crossed recently (based on closing prices)
Parameters:
lookback (int) : The lookback period to look back over
ma (float) : The moving average to reference
Returns: The bar count of how many times price recently crossed the EMA (based on closing prices)
getPullbackBarCount(lookback, direction)
Counts how many green & red bars have printed recently (ie. pullback count)
Parameters:
lookback (int) : The lookback period to look back over
direction (int) : The color of the bar to count (1 = Green, -1 = Red)
Returns: The bar count of how many candles have retraced over the given lookback & direction
getBodySize()
Gets the current candle's body size (in POINTS, divide by 10 to get pips)
Returns: The current candle's body size in POINTS
getTopWickSize()
Gets the current candle's top wick size (in POINTS, divide by 10 to get pips)
Returns: The current candle's top wick size in POINTS
getBottomWickSize()
Gets the current candle's bottom wick size (in POINTS, divide by 10 to get pips)
Returns: The current candle's bottom wick size in POINTS
getBodyPercent()
Gets the current candle's body size as a percentage of its entire size including its wicks
Returns: The current candle's body size percentage
isHammer(fib, colorMatch)
Checks if the current bar is a hammer candle based on the given parameters
Parameters:
fib (float) : (default=0.382) The fib to base candle body on
colorMatch (bool) : (default=false) Does the candle need to be green? (true/false)
Returns: A boolean - true if the current bar matches the requirements of a hammer candle
isStar(fib, colorMatch)
Checks if the current bar is a shooting star candle based on the given parameters
Parameters:
fib (float) : (default=0.382) The fib to base candle body on
colorMatch (bool) : (default=false) Does the candle need to be red? (true/false)
Returns: A boolean - true if the current bar matches the requirements of a shooting star candle
isDoji(wickSize, bodySize)
Checks if the current bar is a doji candle based on the given parameters
Parameters:
wickSize (float) : (default=2) The maximum top wick size compared to the bottom (and vice versa)
bodySize (float) : (default=0.05) The maximum body size as a percentage compared to the entire candle size
Returns: A boolean - true if the current bar matches the requirements of a doji candle
isBullishEC(allowance, rejectionWickSize, engulfWick)
Checks if the current bar is a bullish engulfing candle
Parameters:
allowance (float) : (default=0) How many POINTS to allow the open to be off by (useful for markets with micro gaps)
rejectionWickSize (float) : (default=disabled) The maximum rejection wick size compared to the body as a percentage
engulfWick (bool) : (default=false) Does the engulfing candle require the wick to be engulfed as well?
Returns: A boolean - true if the current bar matches the requirements of a bullish engulfing candle
isBearishEC(allowance, rejectionWickSize, engulfWick)
Checks if the current bar is a bearish engulfing candle
Parameters:
allowance (float) : (default=0) How many POINTS to allow the open to be off by (useful for markets with micro gaps)
rejectionWickSize (float) : (default=disabled) The maximum rejection wick size compared to the body as a percentage
engulfWick (bool) : (default=false) Does the engulfing candle require the wick to be engulfed as well?
Returns: A boolean - true if the current bar matches the requirements of a bearish engulfing candle
isInsideBar()
Detects inside bars
Returns: Returns true if the current bar is an inside bar
isOutsideBar()
Detects outside bars
Returns: Returns true if the current bar is an outside bar
barInSession(sess, useFilter)
Determines if the current price bar falls inside the specified session
Parameters:
sess (simple string) : The session to check
useFilter (bool) : (default=true) Whether or not to actually use this filter
Returns: A boolean - true if the current bar falls within the given time session
barOutSession(sess, useFilter)
Determines if the current price bar falls outside the specified session
Parameters:
sess (simple string) : The session to check
useFilter (bool) : (default=true) Whether or not to actually use this filter
Returns: A boolean - true if the current bar falls outside the given time session
dateFilter(startTime, endTime)
Determines if this bar's time falls within date filter range
Parameters:
startTime (int) : The UNIX date timestamp to begin searching from
endTime (int) : the UNIX date timestamp to stop searching from
Returns: A boolean - true if the current bar falls within the given dates
dayFilter(monday, tuesday, wednesday, thursday, friday, saturday, sunday)
Checks if the current bar's day is in the list of given days to analyze
Parameters:
monday (bool) : Should the script analyze this day? (true/false)
tuesday (bool) : Should the script analyze this day? (true/false)
wednesday (bool) : Should the script analyze this day? (true/false)
thursday (bool) : Should the script analyze this day? (true/false)
friday (bool) : Should the script analyze this day? (true/false)
saturday (bool) : Should the script analyze this day? (true/false)
sunday (bool) : Should the script analyze this day? (true/false)
Returns: A boolean - true if the current bar's day is one of the given days
atrFilter(atrValue, maxSize)
Parameters:
atrValue (float)
maxSize (float)
tradeCount()
Calculate total trade count
Returns: Total closed trade count
isLong()
Check if we're currently in a long trade
Returns: True if our position size is positive
isShort()
Check if we're currently in a short trade
Returns: True if our position size is negative
isFlat()
Check if we're currentlyflat
Returns: True if our position size is zero
wonTrade()
Check if this bar falls after a winning trade
Returns: True if we just won a trade
lostTrade()
Check if this bar falls after a losing trade
Returns: True if we just lost a trade
maxDrawdownRealized()
Gets the max drawdown based on closed trades (ie. realized P&L). The strategy tester displays max drawdown as open P&L (unrealized).
Returns: The max drawdown based on closed trades (ie. realized P&L). The strategy tester displays max drawdown as open P&L (unrealized).
totalPipReturn()
Gets the total amount of pips won/lost (as a whole number)
Returns: Total amount of pips won/lost (as a whole number)
longWinCount()
Count how many winning long trades we've had
Returns: Long win count
shortWinCount()
Count how many winning short trades we've had
Returns: Short win count
longLossCount()
Count how many losing long trades we've had
Returns: Long loss count
shortLossCount()
Count how many losing short trades we've had
Returns: Short loss count
breakEvenCount(allowanceTicks)
Count how many break-even trades we've had
Parameters:
allowanceTicks (float) : Optional - how many ticks to allow between entry & exit price (default 0)
Returns: Break-even count
longCount()
Count how many long trades we've taken
Returns: Long trade count
shortCount()
Count how many short trades we've taken
Returns: Short trade count
longWinPercent()
Calculate win rate of long trades
Returns: Long win rate (0-100)
shortWinPercent()
Calculate win rate of short trades
Returns: Short win rate (0-100)
breakEvenPercent(allowanceTicks)
Calculate break even rate of all trades
Parameters:
allowanceTicks (float) : Optional - how many ticks to allow between entry & exit price (default 0)
Returns: Break-even win rate (0-100)
averageRR()
Calculate average risk:reward
Returns: Average winning trade divided by average losing trade
unitsToLots(units)
(Forex) Convert the given unit count to lots (multiples of 100,000)
Parameters:
units (float) : The units to convert into lots
Returns: Units converted to nearest lot size (as float)
skipTradeMonteCarlo(chance, debug)
Checks to see if trade should be skipped to emulate rudimentary Monte Carlo simulation
Parameters:
chance (float) : The chance to skip a trade (0-1 or 0-100, function will normalize to 0-1)
debug (bool) : Whether or not to display a label informing of the trade skip
Returns: True if the trade is skipped, false if it's not skipped (idea being to include this function in entry condition validation checks)
fillCell(tableID, column, row, title, value, bgcolor, txtcolor, tooltip)
This updates the given table's cell with the given values
Parameters:
tableID (table) : The table ID to update
column (int) : The column to update
row (int) : The row to update
title (string) : The title of this cell
value (string) : The value of this cell
bgcolor (color) : The background color of this cell
txtcolor (color) : The text color of this cell
tooltip (string)
Returns: Nothing.

thors_forex_factory_utilityLibrary "forex_factory_utility"
Supporting Utility Library for the Live Economic Calendar by toodegrees Indicator; responsible for data handling, and plotting news event data.
isLeapYear()
Finds if it's currently a leap year or not.
Returns: Returns True if the current year is a leap year.
daysMonth(M)
Provides the days in a given month of the year, adjusted during leap years.
Parameters:
M (int) : Month in numerical integer format (i.e. Jan=1).
Returns: Days in the provided month.
MMM(M)
Converts a month from a numerical integer format to a MMM format (i.e. 'Jan').
Parameters:
M (int) : Month in numerical integer format (i.e. Jan=1).
Returns: Month in MMM format (i.e. 'Jan').
dow(D)
Converts a numbered day of the week string in format to 'DDD' format (i.e. "1" = Sun).
Parameters:
D (string) : Numbered day of the week from 1 to 7, starting on Sunday.
Returns: Returns the day of the week in 'DDD' format (i.e. "Fri").
size(S, N)
Converts a size string into the corresponding Pine Script v5 format, or N times smaller/bigger.
Parameters:
S (string) : Size string: "Tiny", "Small", "Normal", "Large", or "Huge".
N (int) : Size variation, can be positive (larger than S), or negative (smaller than S).
Returns: Size string in Pine Script v5 format.
lineStyle(S)
Converts a line style string into the corresponding Pine Script v5 format.
Parameters:
S (string) : Line style string: "Dashed", "Dotted" or "Solid".
Returns: Line style string in Pine Script v5 format.
lineTrnsp(S)
Converts a transparency style string into the corresponding integer value.
Parameters:
S (string) : Line style string: "Light", "Medium" or "Heavy".
Returns: Transparency integer.
boxLoc(X, Y)
Converts position strings of X and Y into a table position in Pine Script v5 format.
Parameters:
X (string) : X-axis string: "Left", "Center", or "Right".
Y (string) : Y-axis string: "Top", "Middle", or "Bottom".
Returns: Table location string in Pine Script v5 format.
method bubbleSort_NewsTOD(N)
Performs bubble sort on a Forex Factory News array of all news from the same date, ordering them in ascending order based on the time of the day.
Namespace types: array
Parameters:
N (array) : Forex Factory News array.
Returns: void
bubbleSort_News(N)
Performs bubble sort on a Forex Factory News array, ordering them in ascending order based on the time of the day, and date.
Parameters:
N (array) : Forex Factory News array.
Returns: Sorted Forex Factory News array.
weekNews(N, C, I)
Creates a Forex Factory News array containing the current week's Forex Factory News.
Parameters:
N (array) : Forex Factory News array containing this week's unfiltered Forex Factory News.
C (array) : Currency filter array (string array).
I (array) : Impact filter array (color array).
Returns: Forex Factory News array containing the current week's Forex Factory News.
todayNews(W, D, M)
Creates a Forex Factory News array containing the current day's Forex Factory News.
Parameters:
W (array) : Forex Factory News array containing this week's Forex Factory News.
D (array) : Forex Factory News array for the current day's Forex Factory News.
M (bool) : Boolean that marks whether the current chart has a Day candle-switch at Midnight New York Time.
Returns: Forex Factory News array containing the current day's Forex Factory News.
adjustTimezone(N, TZH, TZM)
Transposes the Time of the Day, and Date, in the Forex Factory News Table to a custom Timezone.
Parameters:
N (array) : Forex Factory News array.
TZH (int) : Custom Timezone hour.
TZM (int) : Custom Timezone minute.
Returns: Reformatted Forex Factory News array.
NewsAMPM_TOD(N)
Reformats the Time of the Day in the Forex Factory News Table to AM/PM format.
Parameters:
N (array) : Forex Factory News array.
Returns: Reformatted Forex Factory News array.
impFilter(X, L, M, H)
Creates a filter array from the User's desired Forex Facory News to be shown based on Impact.
Parameters:
X (bool) : Boolean - if True Holidays listed on Forex Factory will be shown.
L (bool) : Boolean - if True Low Impact listed on Forex Factory News will be shown.
M (bool) : Boolean - if True Medium Impact listed on Forex Factory News will be shown.
H (bool) : Boolean - if True High Impact listed on Forex Factory News will be shown.
Returns: Color array with the colors corresponding to the Forex Factory News to be shown.
curFilter(A, C1, C2, C3, C4, C5, C6, C7, C8, C9)
Creates a filter array from the User's desired Forex Facory News to be shown based on Currency.
Parameters:
A (bool) : Boolean - if True News related to the current Chart's symbol listed on Forex Factory will be shown.
C1 (bool) : Boolean - if True News related to the Australian Dollar listed on Forex Factory will be shown.
C2 (bool) : Boolean - if True News related to the Canadian Dollar listed on Forex Factory will be shown.
C3 (bool) : Boolean - if True News related to the Swiss Franc listed on Forex Factory will be shown.
C4 (bool) : Boolean - if True News related to the Chinese Yuan listed on Forex Factory will be shown.
C5 (bool) : Boolean - if True News related to the Euro listed on Forex Factory will be shown.
C6 (bool) : Boolean - if True News related to the British Pound listed on Forex Factory will be shown.
C7 (bool) : Boolean - if True News related to the Japanese Yen listed on Forex Factory will be shown.
C8 (bool) : Boolean - if True News related to the New Zealand Dollar listed on Forex Factory will be shown.
C9 (bool) : Boolean - if True News related to the US Dollar listed on Forex Factory will be shown.
Returns: String array with the currencies corresponding to the Forex Factory News to be shown.
FF_OnChartLine(N, T, S)
Plots vertical lines where a Forex Factory News event will occur, or has already occurred.
Parameters:
N (array) : News-type array containing all the Forex Factory News.
T (int) : Transparency integer value (0-100) for the lines.
S (string) : Line style in Pine Script v5 format.
Returns: void
method updateStringMatrix(M, P, V)
Updates a string Matrix containing the tooltips for Forex Factory News Event information for a given candle.
Namespace types: matrix
Parameters:
M (matrix) : String matrix.
P (int) : Position (row) of the Matrix to update based on the impact.
V (string) : information to push to the Matrix.
Returns: void
FF_OnChartLabel(N, Y, S, O)
Plots labels where a Forex Factory News has already occurred based on its/their impact.
Parameters:
N (array) : News-type array containing all the Forex Factory News.
Y (string) : String that gives direction on where to plot the label (options= "Above", "Below", "Auto").
S (string) : Label size in Pine Script v5 format.
O (bool) : Show outline of labels?
Returns: void
historical(T, D, W, X)
Deletes Forex Factory News drawings which are ourside a specific Time window.
Parameters:
T (int) : Number of days input used for Forex Factory News drawings' history.
D (bool) : Boolean that when true will only display Forex Factory News drawings of the current day.
W (bool) : Boolean that when true will only display Forex Factory News drawings of the current week.
X (string) : String that gives direction on what lines to plot based on Time (options= "Future", "Both").
Returns: void
newTable(P, B)
Creates a new Table object with parameters tailored to the Forex Factory News Table.
Parameters:
P (string) : Position string for the Table, in Pine Script v5 format.
B (color) : Border and frame color for the News Table.
Returns: Empty Forex Factory News Table.
resetTable(P, S, headTextC, headBgC, B)
Resets a Table object with parameters and headers tailored to the Forex Factory News Table.
Parameters:
P (string) : Position string for the Table, in Pine Script v5 format.
S (string) : Size string for the Table's text, in Pine Script v5 format.
headTextC (color)
headBgC (color)
B (color) : Border and frame color for the News Table.
Returns: Empty Forex Factory News Table.
logNews(N, TBL, R, S, rowTextC, rowBgC)
Adds an event to the Forex Factory News Table.
Parameters:
N (News) : News-type object.
TBL (table) : Forex Factory News Table object to add the News to.
R (int) : Row to add the event to in the Forex Factory News Table.
S (string) : Size string for the event's text, in Pine Script v5 format.
rowTextC (color)
rowBgC (color)
Returns: void
FF_Table(N, P, S, headTextC, headBgC, rowTextC, rowBgC, B)
Creates the Forex Factory News Table.
Parameters:
N (array) : News-type array containing all the Forex Factory News.
P (string) : Position string for the Table, in Pine Script v5 format.
S (string) : Size string for the Table's text, in Pine Script v5 format.
headTextC (color)
headBgC (color)
rowTextC (color)
rowBgC (color)
B (color) : Border and frame color for the News Table.
Returns: Forex Factory News Table.
timeline(N, T, F, TZH, TZM, D)
Shades Forex Factory News events in the Forex Factory News Table after they occur.
Parameters:
N (array) : News-type array containing all the Forex Factory News.
T (table) : Forex Facory News table object.
F (color) : Color used as shading once the Forex Factory News has occurred.
TZH (int) : Custom Timezone hour, if any.
TZM (int) : Custom Timezone minute, if any.
D (bool) : Daily Forex Factory News flag.
Returns: Forex Factory News Table.
News
Custom News type which contains informatino about a Forex Factory News Event.
Fields:
dow (series string) : Day of the week, in DDD format (i.e. 'Mon').
dat (series string) : Date, in MMM D format (i.e. 'Jan 1').
_t (series int)
tod (series string) : Time of the day, in hh:mm 24-Hour format (i.e 17:10).
cur (series string) : Currency, in CCC format (i.e. "USD").
imp (series color) : Impact, the respective impact color for Forex Factory News Events.
ttl (series string) : Title, encoded in a custom number mapping (see the toodegrees/toodegrees_forex_factory library to learn more).
tmst (series int)
ln (series line)

vector0Library "vector0"
TODO: add library description here
test()
TODO: add function description here
Returns: TODO: add what function returns
CoreJuice001Library "CoreJuice001"
DrawingData
Fields:
kzone1Boxes (array)
kzone2Boxes (array)
kzone3Boxes (array)
kzone4Boxes (array)
kzone5Boxes (array)
kzone6Boxes (array)
kzone1Labels (array)
kzone2Labels (array)
kzone3Labels (array)
kzone4Labels (array)
kzone5Labels (array)
kzone6Labels (array)
kzone1TrendLines (array)
kzone2TrendLines (array)
kzone3TrendLines (array)
kzone4TrendLines (array)
kzone5TrendLines (array)
kzone6TrendLines (array)
kzone1PriceLabels (array)
kzone2PriceLabels (array)
kzone3PriceLabels (array)
kzone4PriceLabels (array)
kzone5PriceLabels (array)
kzone6PriceLabels (array)
AuthLibLibrary "AuthLib"
DrawingData
Fields:
kzone1Boxes (array)
kzone2Boxes (array)
kzone3Boxes (array)
kzone4Boxes (array)
kzone5Boxes (array)
kzone6Boxes (array)
kzone1Labels (array)
kzone2Labels (array)
kzone3Labels (array)
kzone4Labels (array)
kzone5Labels (array)
kzone6Labels (array)
kzone1TrendLines (array)
kzone2TrendLines (array)
kzone3TrendLines (array)
kzone4TrendLines (array)
kzone5TrendLines (array)
kzone6TrendLines (array)
kzone1PriceLabels (array)
kzone2PriceLabels (array)
kzone3PriceLabels (array)
kzone4PriceLabels (array)
kzone5PriceLabels (array)
kzone6PriceLabels (array)