Next Week & Daily CPRNext day and next week CPR with S1, S3, R1, R3. Next day and next week CPR with S1, S3, R1, R3. Next day and next week CPR with S1, S3, R1, R3.
Indicateurs et stratégies


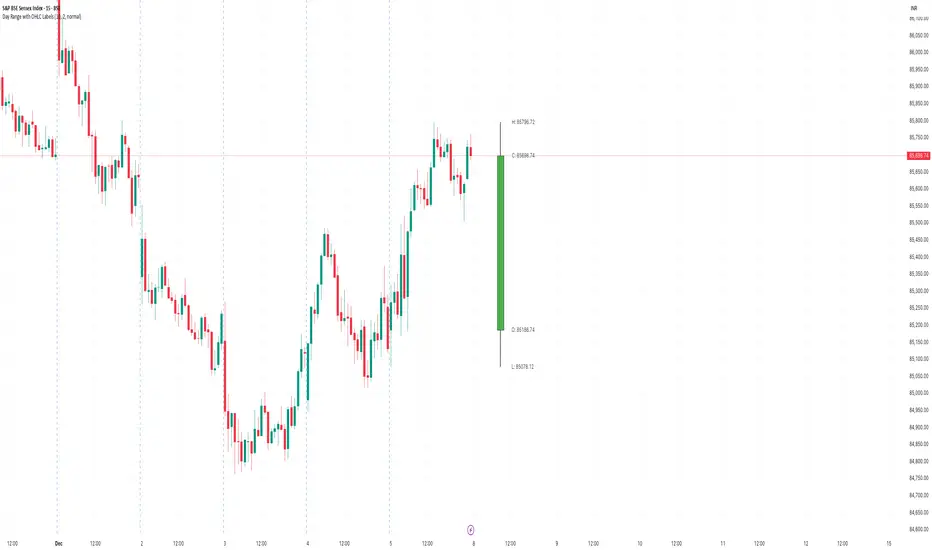
Day Range with OHLC LabelsThis indicator creates a synthetic daily candlestick that appears to the right of the chart, visually separated from real price bars.
It helps traders quickly view each day’s High, Low, Open, and Close without zooming, scrolling, or switching to higher timeframes.
What This Tool Does
✔ Draws a floating daily candle to the right of the current chart
✔ Displays the true Daily Open, High, Low, and Close
✔ Shows a center-aligned wick representing the full high-low range
✔ Shows a box-style candle body positioned using real OHLC values
✔ Labels the values (O, H, L, C) with large, clear fonts
✔ Automatically updates at each new day
✔ Works on any timeframe
✔ Helps intraday traders track daily structure visually
Why This Indicator Is Useful
This script is ideal for intraday traders who want instant awareness of the current day’s range.
Instead of guessing or drawing manual lines, you get a clean daily candlestick rendered off to the right side, avoiding chart clutter.
Great for:
Range traders
Breakout traders
Liquidity zone analysis
High/Low reference tracking
Traders who prefer non-intrusive visuals
Customization
Adjustable offset: position the candle further right
Configurable colors for wick + body
Large-font labels for easy reading
Automatically clears and redraws cleanly each day
Summary
This tool creates a clear, minimalistic, right-side daily candlestick complete with OHLC labels and centralized wick.
It’s designed to improve chart clarity and support quick decision-making without blocking price candles.
NY 9:30-9:35 High/Low Range📘 Script Description
This script automatically identifies and plots the high and low of the 5-minute candle formed between 9:30 AM and 9:35 AM New York time, which corresponds to the opening of the U.S. equity market.
The goal is to provide a clear reference level for intraday volatility, directional bias, and breakout levels.
🔍 Function Overview
■ 1. Detects the 9:30–9:35 NY Time Candle
The script converts chart timestamps into New York session time and automatically captures the 5-minute candle that forms between:
NY 9:30:00 → NY 9:35:00
■ 2. Automatically Draws Horizontal Lines
After identifying the high and low of this candle, the script draws:
High line → Red
Low line → Blue
Lines start exactly at the 9:30 timestamp
Lines extend 3 hours into the future (until NY 12:30)
Lines do not extend beyond 3 hours (prevents unwanted diagonal lines or lines from previous days)
■ 3. Label Display at NY 20:00
The script places a label at New York 20:00, marking:
“9:30 High” for the high line
“9:30 Low” for the low line
This allows you to instantly identify the key reference levels at the end of the trading day.
■ 4. Auto-Removal at NY 20:00
At NY 20:00, both the lines and the labels are automatically deleted.
No old lines remain on the chart, ensuring clarity and accuracy for each new trading day.
🎯 Purpose and Use Cases
This script is highly useful for:
Determining intraday direction after the NY open
Tracking volatility spikes at the U.S. equity market open
Identifying breakout levels
Using high/low as dynamic support and resistance throughout the day
Understanding market context during economic events or high-impact sessions
The 9:30–9:35 range is one of the most watched price zones in global markets, often serving as the day’s initial liquidity sweep.
📝 Key Features
Accurate New York time conversion
Clean horizontal lines (no previous-day diagonal lines)
Labels positioned clearly at NY 20:00
No unnecessary visuals—simple and effective
Lightweight script with minimal chart impact

Auto Reaction Zones (XAUUSD)
✅ Auto Reaction Zones (XAUUSD) OANDA:XAUUSD
Auto Reaction Zones (XAUUSD) is an advanced supply & demand mapping tool designed to detect high-probability reaction zones using price impulses, volatility filters, market structure, and adaptive confirmation logic.
This indicator automatically identifies strong bullish and bearish reaction bases formed before impulsive movements, then plots dynamic demand and supply zones that help traders anticipate future reactions, reversals, or continuation points.
🔍 Core Features
▪ Automatic Supply & Demand Zone Detection
Identifies zones based on structural breakout impulses using ATR-based thresholds, volume confirmation, and validated base levels.
▪ Adaptive Confirmation Distance (ADR-Based)
The zone becomes active/confirmed only after price moves a configurable number of points.
A unique 3-case ADR logic adjusts the required confirmation distance based on current market volatility:
Case 1: Low ADR → smaller confirmation required
Case 2: Moderate ADR → medium confirmation
Case 3: High ADR → higher confirmation (more filtering)
This ensures stronger zones in high-volatility conditions (e.g., XAUUSD).
▪ Smart Zone Management
Automatic extension until tested or consumed
Optional lifetime limits (bars or days)
Auto-delete unconfirmed zones if price violates them too early
Hide tested or consumed zones for a cleaner chart
▪ Adjustable Zone Size Filtering
Option to enforce a minimum or maximum zone size, useful for cleaning noise and ultra-small reaction levels.
▪ ADR-Based Zone Spacing Filter
Prevents the creation of zones that are too close to each other.
Different spacing rules for same-direction and opposite-direction zones.
▪ Multi-Timeframe Mode
Overlay zones detected from higher timeframes directly onto your current chart.
▪ Directional Bias (EMA Filter)
Optionally restrict long/short zones based on EMA trend alignment.
▪ Real-Time Alerts
Receive alerts when price touches any active zone or only fresh zones.
🎯 Why This Indicator Is Different
Unlike typical supply/demand indicators that print every swing,
Auto Reaction Zones focuses on:
Only strong reaction bases
Only valid impulse-generated levels
Only zones confirmed by price movement
Only zones that respect volatility and minimum spacing rules
This results in cleaner charting, fewer false zones, and far more reliable reaction levels, especially on volatile instruments like XAUUSD.
⚠️ Disclaimer
This tool is not financial advice. Always combine zone analysis with broader market context and risk management.

5-RSI HighSrc Buy/SellBest used on the 5 min chart, this indicator detects early intraday momentum reversals that occur within an alread-bullish trend using (source = high) RSI lengths 5, 8, 13, 21, & 34. This is primarily designed to catch the moment an uptrend resumes after a dip.

Volume Percentile Breakoutv2Indicates when the volume passes the desired percentile over a 3 day period of selected timeframe.

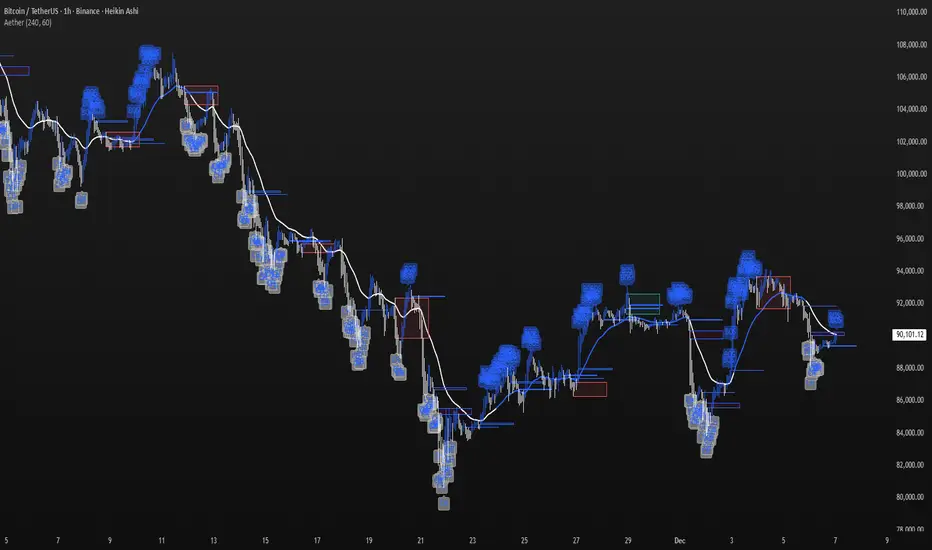
Aether Market MapAether Market Map A multi-component structure-based tool that aids chart analysis by visually displaying various market structure elements.
It combines order blocks, fair value gaps, liquidity segments, trend-shifting signals, and more to help users interpret the pricing structure more clearly.
This script does not provide specific trading strategies or investment advice and is a reference tool for chart analysis.
🔍 Key Features
1. Order Blocks (OB)
Displays the potential inflection sections in box form according to the specified conditions.
This feature helps to visually grasp the price segments that market participants have repeatedly responded to.
2. Fair Value Gaps (FVG)
It detects the area where the imbalance between the candles has occurred and displays it in a box form.
The area represents the section where there has been a fast movement or abnormal flow of prices.
3. Liquidity Levels
Shapes the points where liquidity was gathered through a short-term high-point and low-point pivot structure.
You can see the structural levels at which prices can react repeatedly.
4. BOS / CHOCH (Structural Change Detection)
Label changes in market structure based on recent high/low breakthroughs.
This is not just trend tracking, it helps us to visually grasp the changes in the structure itself.
📈 Analysis of multi-time frame trends
We compute the comprehensive trend state by leveraging the moving average slope of the swing and macro higher order time frames.
These values are reflected in chart background and EMA color changes to intuitively display the overall market mood.
Positive Environment (Regime > 0) → Green Family
Negative Environment (Regime < 0) → Red Series
This is a simple visualization of the flow of the market to the user, not a specific trading direction.
🔧 Signal Engine (Confluence-Based Visual Tool)
The script does not provide a transaction signal and does not induce a particular trading decision.
The Signal feature is a visual notification element that appears on the chart when a number of conditions overlap.
a change in the ratio of trading volume
Structural activities in recent analysis sections
Trending Environment
short-term momentum change
This feature is a reference visual element for interpreting market data from multiple perspectives.
🎛 Setting Items
Show Order Blocks — Visualize Order Blocks
Show Fair Value Gaps — Show FVG Detection
Show Liquidity Levels — Show pivot-based liquidity areas
Show BOS/CHoCH — Show Structural Switching Points
Show Trade Signals — Display visual signal notifications
HTF Settings — Enter parent timeframe analysis values
💡 Precautions for Use
This script is a market structure visualization tool and does not guarantee specific trading strategies, forecasts, or returns.
Components are calculated based on historical data and may not fully reflect real-time market changes.
All features are intended for research and chart analysis assistance purposes.
📌 Official Disclaimer
This script does not provide investment, finance, or trading advice.
All trading judgments made by the user and their consequences are the user's own responsibility.
This tool only provides a reference visualization function to assist with analysis.
Sree Daily RangeVery simple indicator to draw support and resistance levels given the price. It creates a given lebel at the level

⚪ SILVER — RISK MATRIX + UQ vC (Final HUD)Silver RISK MATRIX + UQ vC is an advanced Pine Script v5 indicator for silver futures (SIL) trading, featuring a 3-column bottom-right HUD combining a 7-factor risk matrix with UQ predictive scoring. It quantifies position, structure, trend conflicts, impulse, volume, fake breaks, and VWAP deviation into total risk levels (LOW/MEDIUM/HIGH) while fusing predictive BUY/SELL probabilities with directional risk and multi-timeframe trend boosts.
Risk Matrix Breakdown
Position Risk
Measures % distance to 18-period support/resistance: <0.10% resistance = high risk (🟥🟥), <0.25% = medium (🟧⬜), <0.10% support = safe (🟩⬜). Silver-tuned for tight proximity sensitivity.
Structure Risk
Detects pivot-based CHoCH conflicts (close breaks prior HH/HL but structure opposes) or fake breaks, scoring 2 for conflicts using tight 2-left/2-right pivots suited to silver's volatility.
Other Factors
Trend Conf: 5m vs 30m EMA40 mismatch (2 points).
Impulse: Body >1.2x 4-period EMA abs body (exhaustion).
Volume: >3.2x/2.2x 20-SMA thresholds for extreme/obvious surges.
Fake Break: Wick >1.2x body (top/bottom).
VWAP: >1.2%/0.6% deviation. Total ≥6=HIGH (red), ≥3=MEDIUM (orange).
UQ Predictive Engine
Base Prediction
Averages flow (OBV+price), momentum (RSI/MFI), VWAP, trend (EMA20/50), turbo (BB width expansion) into pred_buy/sell (0-1 normalized).
Directional Risk
BUY risk weights fakeUp wicks, impulse, bear vol, low position; SELL mirrors. Clamped 0-1.
Trend Boost
Adds 15% for 2H alignment, 10% for 30m, 5% for VWAP (directional).
Final Fusion
BUY_FINAL = 55% pred + 25% risk + 20% boost; normalized vs SELL counterpart. Displays blocks (🟩🟩🟩🟩=≥80%) and stars (⭐⭐⭐⭐⭐=≥85%).
HUD Layout & Usage
20-row table separates RISK MATRIX (rows 1-10) from UQ (11-18): metric | visual box/block | Chinese explanation. Perfect for silver's high-volatility scalping, balancing exhaustive risk scanning with probabilistic edge quantification. Ready in both English and Chinese

US Market Long Horizon Momentum Summary in one paragraph
US Market Long Horizon Momentum is a trend following strategy for US index ETFs and futures built around a single eighteen month time series momentum measure. It helps you stay long during persistent bull regimes and step aside or flip short when long term momentum turns negative.
Scope and intent
• Markets. Large cap US equity indices, liquid US index ETFs, index futures
• Timeframes. 4h/ Daily charts
• Default demo used in the publication. SPY on 4h timeframe chart
• Purpose. Provide a minimal long bias index timing model that can reduce deep drawdowns and capture major cycles without parameter mining
• Limits. This is a strategy. Orders are simulated on standard candles only
Originality and usefulness
• Unique concept or fusion. One unscaled multiple month log return of an external benchmark symbol drives all entries and exits, with optional volatility targeting as a single risk control switch.
• Failure mode addressed. Fully passive buy and hold ignores the sign of long horizon momentum and can sit through multi year drawdowns. This script offers a way to step down risk in prolonged negative momentum without chasing short term noise.
• Testability. All parameters are visible in Inputs and the momentum series is plotted so users can verify every regime change in the Tester and on price history.
• Portable yardstick. The log return over a fixed window is a unit that can be applied to any liquid symbol with daily data.
Method overview in plain language
The method looks at how far the benchmark symbol has moved in log return terms over an eighteen month window in our example. If that long horizon return is positive the strategy allows a long stance on the traded symbol. If it is negative and shorts are enabled the strategy can flip short, otherwise it goes flat. There is an optional realised volatility estimate on the traded symbol that can scale position size toward a target annual volatility, but in the default configuration the model uses unit leverage and only the sign of momentum matters.
Base measures
Return basis. The core yardstick is the natural log of close divided by the close eighteen months ago on the benchmark symbol. Daily log returns of the traded symbol feed the realised volatility estimate when volatility targeting is enabled.
Components
• Component one Momentum eighteen months. Log of benchmark close divided by its close mom_lookback bars ago. Its sign defines the trend regime. No extra smoothing is applied beyond the long window itself.
• Component two Realised volatility optional. Standard deviation of daily log returns on the traded symbol over sixty three days. Annualised by the square root of 252. Used only when volatility targeting is enabled.
• Optional component Volatility targeting. Converts target annual volatility and realised volatility into a leverage factor clipped by a maximum leverage setting.
Fusion rule
The model uses a simple gate. First compute the sign of eighteen month log momentum on the benchmark symbol. Optionally compute leverage from volatility. The sign decides whether the strategy wants to be long, short, or flat. Leverage only rescales position size when enabled and does not change direction.
Signal rule
• Long suggestion. When eighteen month log momentum on the benchmark symbol is greater than zero, the strategy wants to be long.
• Short suggestion. When that log momentum is less than zero and shorts are allowed, the strategy wants to be short. If shorts are disabled it stays flat instead.
• Wait state. When the log momentum is exactly zero or history is not long enough the strategy stays flat.
• In position. In practice the strategy sits IN LONG while the sign stays positive and flips to IN SHORT or flat only when the sign changes.
Inputs with guidance
Setup
• Momentum Lookback (months). Controls the horizon of the log return on the benchmark symbol. Typical range 6 to 24 months. Raising it makes the model slower and more selective. Lowering it makes it more reactive and sensitive to medium term noise.
• Symbol. External symbol used for the momentum calculation, SPY by default. Changing it lets you time other indices or run signals from a benchmark while trading a correlated instrument.
Logic
• Allow Shorts. When true the strategy will open short positions during negative momentum regimes. When false it will stay flat whenever momentum is negative. Practical setting is tied to whether you use a margin account or an ETF that supports shorting.
Internal risk parameters (not exposed as inputs in this version) are:
• Target Vol (annual). Target annual volatility for volatility targeting, default 0.2.
• Vol Lookback (days). Window for realised volatility, default 63 trading days.
• Max Leverage. Cap on leverage when volatility targeting is enabled, default 2.
Usage recipes
Swing continuation
• Signal timeframe. Use the daily chart.
• Benchmark symbol. Leave at SPY for US equity index exposure.
• Momentum lookback. Eighteen months as a default, with twelve months as an alternative preset for a faster swing bias.
Properties visible in this publication
• Initial capital. 100000
• Base currency. USD
• Default order size method. 5% of the total capital in this example
• Pyramiding. 0
• Commission. 0.03 percent
• Slippage. 3 ticks
• Process orders on close. On
• Bar magnifier. Off
• Recalculate after order is filled. Off
• Calc on every tick. Off
• All request.security calls use lookahead = barmerge.lookahead_off
Realism and responsible publication
The strategy is for education and research only. It does not claim any guaranteed edge or future performance. All results in Strategy Tester are hypothetical and depend on the data vendor, costs, and slippage assumptions. Intrabar motion is not modeled inside daily bars so extreme moves and gaps can lead to fills that differ from live trading. The logic is built for standard candles and should not be used on synthetic chart types for execution decisions.
Performance is sensitive to regime structure in the US equity market, which may change over time. The strategy does not protect against single day crash risk inside bars and does not model gap risk explicitly. Past behavior of SPY and the momentum effect does not guarantee future persistence.
Honest limitations and failure modes
• Long sideways regimes with small net change over eighteen months can lead to whipsaw around the zero line.
• Very sharp V shaped reversals after deep declines will often be missed because the model waits for momentum to turn positive again.
• The sample size in a full SPY history is small because regime changes are infrequent, so any test must be interpreted as indicative rather than statistically precise.
• The model is highly dependent on the chosen lookback. Users should test nearby values and validate that behavior is qualitatively stable.
Legal
Education and research only. Not investment advice. You are responsible for your own decisions. Always test on historical data and in simulation with realistic costs before any live use.

🟡 GOLD 4H HUD v8.9 — Loose ICT OB + Strong/Weak + FVG/HVN/LVNGOLD 4H HUD v8.9 is a clean, structured Smart Money Concepts (SMC)–based analysis tool designed exclusively for XAUUSD on the 4-hour timeframe.
It focuses on the three most important elements for institutional orderflow analysis:
✔ Loose ICT Order Blocks (Demand/Supply)
✔ Fair Value Gaps (FVG)
✔ Volume Profile Zones (HVN/LVN/POC)
The script builds a professional-style HUD that displays the key institutional regions and structural levels that matter most for gold traders.
📌 Key Features
1 — Market Structure Engine (HH/HL & BOS)
The indicator detects:
Minor swing Highs and Lows
Last confirmed HH / HL levels
Break of Structure (BOS) for directional bias
EMA-200 trend filter (UP / DOWN / NEUTRAL)
This gives traders a clean structural read without clutter or noise.
2 — Loose FVG Engine (Tolerance-Based ICT Gaps)
A soft-threshold FVG engine detects “loose” Fair Value Gaps using a 0.1% price tolerance.
This method ensures:
Fewer missed imbalances
Cleaner OB/FVG alignment
Higher accuracy on 4H gold displacement legs
FVGs automatically shift to the right side of the chart for clean visualization.
3 — Order Block Engine (Demand/Supply + Strong/Weak Classification)
A simplified ICT-style OB engine scans the past few candles whenever BOS is detected.
It identifies:
Demand OB during bullish BOS
Supply OB during bearish BOS
Strong OB if fully nested inside an active FVG
Weak OB otherwise
OB boxes include:
Clear color coding (strong vs. weak)
Price range labels inside each box
Automatic right-shift for visual clarity
4 — Volume Profile Engine (POC / HVN / LVN / VAH / VAL)
Based on a rolling window (default 120 bars), the script builds a lightweight volume distribution.
It displays:
POC (Point of Control)
HVN (High Volume Node)
LVN (Low Volume Node)
Value Area High / Low
HVN/LVN zones are shown as right-shifted colored boxes with price labels.
These zones help identify:
Institutional accumulation
Low-liquidity rejection points
Areas where price tends to react strongly
5 — Support / Resistance Mapping
The script automatically generates:
OB-based support/resistance
Swing-high/swing-low levels
HVN/LVN structural levels
These are displayed in the HUD for fast reference.
6 — Professional HUD Panel
A compact, easy-to-read HUD summarizes:
Trend direction
Latest HH/HL
OB ranges (Strong/Weak)
HVN/LVN price zones
POC
Multi-layer support & resistance
This turns the script into a fully functional analysis dashboard.
📌 What This Indicator Is NOT
To avoid misunderstanding:
It does not take entries or generate buy/sell signals
It does not auto-detect CHOCH, MSS, SMT, or sweeps
It is not a trading bot
This tool is designed as an institutional-style map and analysis HUD, not a strategy.
📌 Best Use Case
This indicator is ideal for traders who want to:
Read institutional structure on XAUUSD
Identify clean Demand/Supply zones
Visualize FVG/OB/HVN interactions
Track high-value liquidity levels
Build directional bias on 4H before dropping to execution timeframes
⚠ Important Note
This tool is designed exclusively for the 4H timeframe.
Using it on lower timeframes will display a warning.

Ultimate Trend System — FINAL MASTER EDITIONUltimate Trend System — FINAL MASTER EDITION
A complete, multi‑layered trend‑detection engine designed for precision execution and clarity.
This final edition fuses trend, momentum, volatility, and filtering into one symmetrical logic system — enabling traders to instantly visualize directional strength and avoid false signals during choppy markets.
🔹 System Overview
The Ultimate Trend System consolidates several classic trading frameworks into a unified model.
It dynamically generates BUY, SELL, and STOP tags directly on the chart — each derived from clean, interlinked conditions that measure both momentum and structure.
In addition, a built‑in information panel summarizes live indicator states for quick decision‑making without checking multiple indicators.
⚙️ Core Logic Components
SMA (20‑period): Identifies trend slope; rising → bullish bias, falling → bearish bias.
VWAP: Defines fair‑value position — Above, Below, or Inside volume‑weighted average price.
QQE‑Lite (RSI): Tracks internal momentum shifts by comparing RSI to its EMA smoothing.
ATR Strength: Classifies current volatility regime as Turbo, Strong, or Weak.
SuperTrend: Confirms structural trend direction using an ATR‑based trailing model.
Choppiness Filter: Suppresses signals when short‑term volatility contracts or range noise dominates.
Fakeout Detection: Prevents false triggers after deceptive breakouts or reversals.
🧩 Execution Logic
BUY Signal: All major trend engines align bullishly, with clean structure and momentum.
SELL Signal: All major engines align bearishly, with clean structure and momentum.
STOP Phase: Appears once per cycle to mark neutral or transition zones; automatically locks further stops until a new entry signal is confirmed.
🟩🟥 Visual Elements
Green Labels: Confirmed bullish entry (BUY).
Red Labels: Confirmed bearish entry (SELL).
Yellow Labels: STOP state (trend exhaustion or consolidation).
Panel: Displays live readings for VWAP, SMA, QQE, ATR regime, and SuperTrend direction.
🧠 Design Philosophy
Built for simplicity, speed, and precision — the Final Master Edition strips away noise without losing analytical depth.
It can serve as a standalone trend system or foundation layer for more advanced frameworks like auto‑execution or multi‑engine HUDs.

HL/2 Fast & Slow - Cloud Signals + Backtest + Exit AlarmsDescription:
This indicator plots two HL/2 moving averages—a fast and a slow line—on the chart, along with dynamic upper and lower bands based on the slow line and ATR. It features a colored cloud between the two averages to visualize trend direction, and it provides buy/sell signals based on the alignment of the two lines.
Key Features:
Fast & Slow HL/2 Averages
Fast and slow HL/2 lines calculated as simple moving averages.
Lines change color based on direction (up/down), configurable via style settings.
Dynamic Upper and Lower Bands
Bands calculated from the slow line using ATR to capture volatility.
Trend Cloud
Fills the area between fast and slow lines.
Green if both lines are rising, red if both are falling, gray if lines disagree.
Transparency adjustable for better visual clarity.
Buy/Sell Signals
Signals appear only when both lines align in the same direction.
Two modes available:
Series Signals: generates a signal whenever the cloud color changes.
Single Signal: generates a signal only when the slow line changes direction.
Signals are plotted as small triangles above/below bars.
Alerts can be set for both buy/sell signals.
Exit Modes and Alerts
Exit positions either on a reverse signal or when the cloud enters a neutral gray zone.
Exit alerts are available for both conditions.
Integrated Backtest Panel
Shows total trades, win rate, and cumulative profit in USD.
Considers position size and commission (configurable).
Panel color indicates profit (green) or loss (red).
Fixed position on chart for easy reference.
Inputs:
Fast and slow periods, ATR length, ATR multiplier.
Position size, commission percentage.
Signal mode (Series or Single).
Exit mode (Reverse Signal or Gray Area).
Style options for line colors and cloud colors.
Time window for backtesting (daily, weekly, monthly, or custom date range).
Usage:
Ideal for identifying trend direction and potential entry points.
Can be used for manual trading or as part of an automated strategy with alerts.
Provides a visual and statistical overview of trading performance via the backtest panel.

Ashok 07 Dec 25 updated scriptTried to fix the bugs in previous script. Even now improvements are needed, but for now it looks reasonably profiting.

DrCID CLUB (HM SYSTEM)Blank line is RSI (9 days) line
Green line is EMA (3 days) line
Red line is WMA (21 days) line
when RSI EMA line above 50 & WMA is below both ,it is buy signal
when RSI EMA line below 50 & WMA is above both ,it is sell signal

Next Day CPRnext day cpr for pivot, s1, s3, r1, s3 of the next day cpr. next day cpr for pivot, s1, s3, r1, s3 of the next day cpr.

SMC + OB + FVG + Reversal + UT Bot + Hull Suite – by Fatich.id🎯 7 INTEGRATED SYSTEMS:
✓ Mxwll Suite (SMC + Auto Fibs + CHoCH/BOS)
✓ UT Bot (Trend Signals + Label Management)
✓ Hull Suite (Momentum Analysis)
✓ LuxAlgo FVG (Fair Value Gaps)
✓ LuxAlgo Order Blocks (Volume Pivots) ⭐ NEW
✓ Three Bar Reversal (Pattern Recognition)
✓ Reversal Signals (Momentum Count Style)
⚡ KEY FEATURES:
• Smart Money Structure (CHoCH/BOS/I-CHoCH/I-BoS)
• Auto Fibonacci (10 customizable levels)
• Order Block Detection (Auto mitigation)
• Fair Value Gap Tracking
• Session Highlights (NY/London/Asia)
• Volume Activity Dashboard
• Multi-Timeframe Support
• Clean Label Management
🎨 PERFECT FOR:
• Smart Money Concept Traders
• Order Flow & Liquidity Analysis
• Support/Resistance Trading
• Trend Following & Reversals
• Multi-Timeframe Analysis
💡 RECOMMENDED SETTINGS:
Clean Charts: OB Count 3, UT Signals 3, FVG 5
Detailed Analysis: OB Count 5-10, All Signals
Scalping: Low sensitivity, Hull 20-30
Swing Trading: High sensitivity, Hull 55-100

AlphaTrend | APEX [Singularity]This is a customized Trend Tracer style system designed to capture high-quality moves while filtering out noise. It combines three core "Engines":
1. Kinetic Trend Engine (The "Ribbon")
Logic: Uses a Dual-ALMA Ribbon (Arnaud Legoux Moving Average).
Fast Line (Leader): Responsive, hugs price.
Slow Line (Laggard): Smooth, validates structure.
Signals: "BUY" and "SELL" labels trigger exactly when the ribbon twists (Crossover/Crossunder).
Filters:
Entropy & Hurst: Measures market chaos. The ribbon turns Gray/Faded during choppy conditions to warn against trading.
2. Flow Engine (Whale Validation)
Whale Volume: Checks for relative volume spikes (> 1.2x average) and Money Flow intensity.
Confirmation: Signals are stronger when accompanied by the Whale Icon (🐋), indicating institutional participation.
3. Liquidity Magnets (Targets)
Logic: Automatically detects recent Swing Highs and Lows.
Visuals: Dashed lines extend forward to act as dynamic Support/Resistance levels or Take Profit targets.
Behavior: Lines disappear when price tests (breaks) them, indicating "Liquidity Taken".
Visuals
Cloud: Dynamic Green/Red fill between the ribbon lines.
HUD: Heads-Up Display showing current Trend, Market State (Clean/Chop), Flow Status, and Active Magnets.
Labels: Clean "Tag" style labels for entry signa

DAILY AND WEEKLY MID LINESDAILY AND WEEKLY MID LINES INDICATOR
Description:
This indicator calculates and visualizes the dynamic midpoint (mid) of the current day and week in real-time. It provides traders with key reference levels based on developing price action.
Features:
Daily Mid Line:
Color: Orange
Thickness: 3 pixels
Style: Solid line
Updates: Automatically recalculates with each new candle
Calculation: Average of the day's highest high and lowest low from market open
Weekly Mid Line:
Color: Blue
Thickness: 3 pixels
Style: Dashed line
Updates: Continuously recalculates throughout the week
Calculation: Average of the week's highest high and lowest low from week start
How It Works:
At the start of each new trading day (00:00), the daily mid line resets and begins calculating from the first candle
At the start of each new trading week (typically Monday), the weekly mid line resets and begins fresh calculations
Both lines extend automatically to the right as new candles form
The lines are dynamic - they adjust as new highs/lows are made during the day/week
Trading Applications:
Support/Resistance Levels:
The mid lines act as natural equilibrium points where price may find temporary support or resistance
Daily mid can serve as intraday pivot, weekly mid as broader market balance point
Trend Analysis:
Price consistently above mid lines suggests bullish momentum
Price consistently below mid lines suggests bearish momentum
Relationship between daily and weekly mid lines shows multi-timeframe alignment
Entry/Exit Signals:
Price crossing above daily mid may indicate short-term bullish momentum
Price crossing below daily mid may indicate short-term bearish momentum
Weekly mid breaks can signal more significant trend changes
Market Context:
Distance between price and mid lines indicates market extremity
Steeper mid line slopes suggest stronger directional momentum
Flat mid lines suggest range-bound or consolidating markets
Confluence Trading:
Combine with other indicators (RSI, MACD, moving averages) for confirmation
Use as dynamic levels for stop-loss placement or take-profit targets
Best Practices:
More effective on higher timeframes (1H, 4H, Daily) for clearer signals
Works well in trending markets where mid lines act as moving support/resistance
Monitor for price rejection or acceptance at mid levels for trading decisions
Use in conjunction with volume analysis for confirmation
Psychological Significance:
Mid points often represent fair value areas where buyers and sellers find temporary equilibrium, making them natural decision points for market participants.
This indicator is particularly useful for day traders, swing traders, and position traders looking for dynamic, real-time reference points that adapt to current market conditions rather than relying on static historical levels.

Execution Heatmap v4.1 — AI EnhancedThis indicator is an AI‑style execution dashboard that compresses structure, momentum, volume, volatility, and risk into a compact heatmap panel plus BUY/SELL signals on the chart. It is specifically tuned for gold and silver, automatically adapting its thresholds to the volatility profile of XAU/GC and XAG/SI symbols.
Core architecture
The system builds a multi‑factor model in layers:
Adaptive structure engine: Tracks dynamic higher‑high / lower‑low progression using rolling reference highs and lows, classifying price as structural UP, DOWN, or NEUTRAL.
Precision VWAP bias: Uses VWAP with a small threshold band to filter out noise and label price as ABOVE, BELOW, or neutral relative to value.
Impulse & angle: Combines short‑term rate of change and normalized slope (price vs ATR over 5 bars) to detect directional thrust, then clamps values into
for stable scoring.
Volume, wicks, and patterns
Adaptive volume tiers: Uses a 20‑bar volume average with gold/silver‑specific multipliers to tag candles as SURGE, HIGH, NORMAL, or LOW volume, with distinct coloring for extremes.
Wick analytics: Measures upper/lower wick size vs total range to detect demand/supply style rejections and encode them as bullish or bearish wick signals.
AI pattern score: Blends structure, VWAP, impulse, wicks, and angle into a normalized pattern score, then classifies it as STRONG↑, NEU↑, NEU, NEU↓, or STRONG↓ with color‑coded emphasis.
AI scoring and prediction layer
Predictive engine: Uses a neural‑network‑style weighted sum of structure, VWAP, impulse, wicks, angle, volume, and pattern to generate a prediction score in
, then converts it into a percentage and arrow (↑, ↑↑, ↓, ↓↓, →) for intuitive directional bias.
Execution score: Aggregates key factors into an EXEC score (0–200+ style scale), color‑graded from weak (red) through medium (orange) to strong (green) execution context.
Uncertainty & risk: Separately models uncertainty (low impulse/angle or low conviction) and risk (fake breaks, VWAP position, uncertainty tier, low volume), then feeds them into a combined confidence calculation.
Final signal & confidence
Final classification:
BUY: High exec score, high confidence, and controlled risk.
SELL: Very low exec score, low confidence in upside, and acceptable risk.
WAIT: All other conditions where edge or clarity is insufficient.
Confidence bar: A textual mini‑bar (🟩 blocks) plus percentage shows how strong the current signal environment is, making it easy to visually gauge setup quality at a glance.
Professional heatmap panel
A two‑column table in the top‑right of the chart organizes the logic into layers:
Base layer: STRUCT, VWAP, IMPULSE, VOLUME.
AI layer: FAKE, REGIME (Trend/Pullback/Reverse/Chop), ANGLE.
Decision layer: PATTERN, PREDICT, EXEC, RISK, CONF, and FINAL direction.

Next Month/Week/Day CPRNext Month/Week/Day CPR Next Month/Week/Day CPR Next Month/Week/Day CPR Next Month/Week/Day CPR Next Month/Week/Day CPR

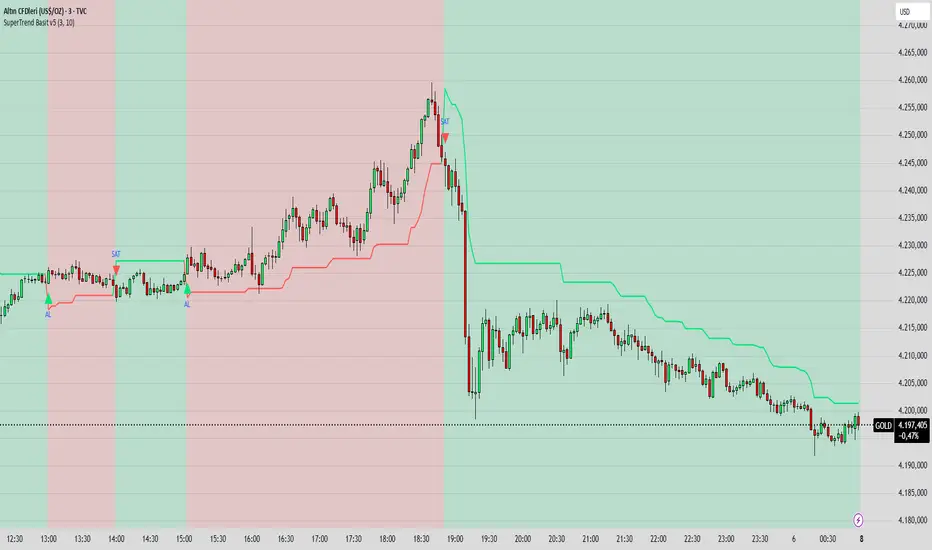
SuperTrend Basit BY İNCEBACAK//@version=5
indicator("SuperTrend Basit v5", overlay=true)
// === Girdi ayarları ===
factor = input.float(3.0, "ATR Katsayısı")
atrPeriod = input.int(10, "ATR Periyodu")
// === Hesaplamalar ===
= ta.supertrend(factor, atrPeriod)
// === Çizim ===
bodyColor = direction == 1 ? color.new(color.lime, 0) : color.new(color.red, 0)
bgcolor(direction == 1 ? color.new(color.lime, 85) : color.new(color.red, 85))
plot(supertrend, color=bodyColor, linewidth=2, title="SuperTrend Çizgisi")
// === Al/Sat sinyali ===
buySignal = ta.crossover(close, supertrend)
sellSignal = ta.crossunder(close, supertrend)
plotshape(buySignal, title="AL", location=location.belowbar, color=color.lime, style=shape.triangleup, size=size.small, text="AL")
plotshape(sellSignal, title="SAT", location=location.abovebar, color=color.red, style=shape.triangledown, size=size.small, text="SAT")