Range

Daily RangeHey traders,
at first thanks to the one and only Master Educator Stefan Kassing for sharing his legendary system with us!
And also credit to Mortdiggiddy , RootDuk and PineCoders for helping me with the script =)
This script is calculating the daily range (in pips) of the current market you are in, in relation to the last 70 days (10 weeks) .
It is used for a possible Take Profit in Stefan Kassing's System .
How to add the script to your chart:
1. Click " Add to Favorite Scripts "
-> i.imgur.com
2. Go in the Chart & click the little arrow in the upper bar and then click " Daily Range ", then the Daily Range appears in the top left corner
-> i.imgur.com
To avoid errors make sure to right-click the Y-Axis on the right side of the chart and then left-click "Scale Price Chart Only" .
-> i.imgur.com
Also be aware that the daily range is only showing up , if you are in the daily time interval or below and you are not hovering with the cursor over the past candles respectively above or below them .
If you are using this script in exotic currencypairs or uncommon other markets , the daily range can be incorrect or not showing up .
So don't hesitate contacting me , then I will try to add the markets that you want to.
To change the color or the decimal places of the number, you can click the gear in the upper left corner.
-> i.imgur.com
Happy Pips

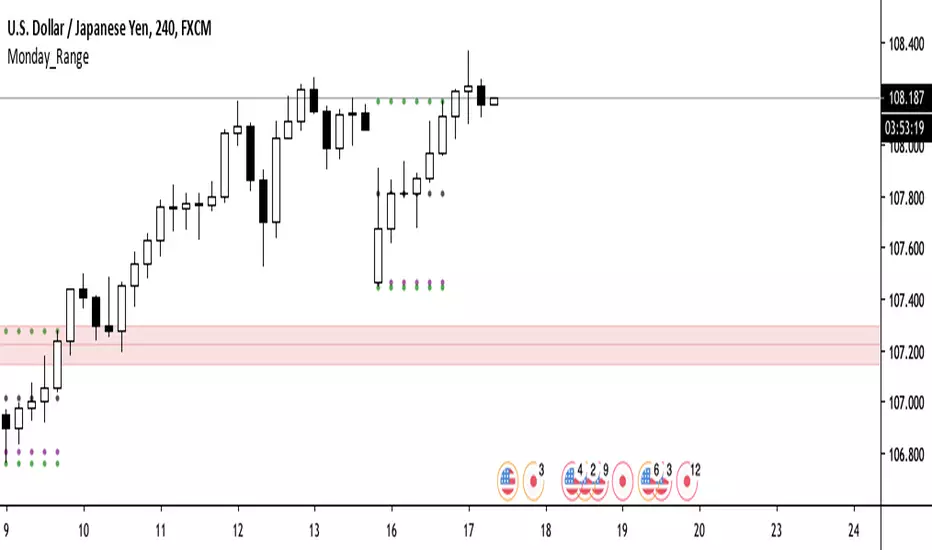
Monday Range - JasonT revisedA revision on the famous Monday Range Script, with the first day of the week goes to Monday for FX trading.
Any MA bands (TMA bands V2)Hi everyone
Website will be opening very shortly :) Sorting out the last details and we're so excited to finally roll-out our different Algorithm Builders for you guys
Forewords
This present script is an evolution of the TMA bands . I would never have expected that script to become so popular to be honest
This is not only a study or idea but a really proven method and I'm glad that many of you are using it already. But please, whenever you see a new script out there, even if it looks cool and promising, please test it on a demo account for a week or on a LIVE account but with tiny amounts every time.
Many times, what you see on the chart is not what will happen in reality. I know that most of you will agree and I know exactly why we see this behavior... I'll give more details in a later post
I have plenty of methods like that one and I'll detail them on my website (and a bit on TradingView) starting next month
TMA bands on steroids
Someone asked me privately to make a generic version of the TMA bands and make it compatible with other standards Moving Average types. That's it for the specifications really as I didn't do much than re-using some piece of my own code
Suggested (but not mandatory) methodology
1) The Take Profit 1 is the middle line, Take Profit 2 is the opposite band.
2) Once the TP1 is hit, set your Stop Loss to breakeven
3) Once the TP2 is hit, if you still want to stay in the trade, set your Stop Loss to the TP1
It will be a powerful tool in your arsenal for some scalp/intraday trades
Wishing you all of you a great and profitable day
PS
It's strictly forbidden to republish this script without my explicit approval. All my posts are copyrighted from now on
Obviously you can use but not republish and get the credit or even worse... some money from your own clients
Dave
____________________________________________________________
Be sure to hit the thumbs up. Building those indicators take a lot of time and likes are always rewarding for me :) (tips are accepted too)
- If you want to suggest some indicators that I can develop and share with the community, please use my personal TRELLO board
- I'm an officially approved PineEditor/LUA/MT4 approved mentor on codementor. You can request a coaching with me if you want and I'll teach you how to build kick-ass indicators and strategies
Jump on a 1 to 1 coaching with me
- You can also hire for a custom dev of your indicator/strategy/bot/chrome extension/python
Disclaimer:
Trading involves a high level of financial risk, and may not be appropriate because you may experience losses greater than your deposit. Leverage can be against you.
Do not trade with capital that you can not afford to lose. You must be aware and have a complete understanding of all the risks associated with the market and trading. We can not be held responsible for any loss you incur.
Trading also involves risks of gambling addiction.
Please notice I do not provide financial advice - my indicators, strategies, educational ideas are intended to provide only some source code for anyone interested in improving their trading
The proprietary indicators and strategies developed by Best Trading Indicator, the object of intellectual property rights are and remain the exclusive property of Best Trading Indicator, at the exclusion of images and videos and texts free of rights or provided by the Company or external legal or physical person.
No assignment of intellectual property rights is carried out through these Terms and Conditions.
Any total or partial reproduction, modification or use of these properties for any reason whatsoever is strictly prohibited without the express written authorization of the Company.


Smart Labelling - Range FilterThis is a labelling module based on a range filter . Notice that the trick here is to use fibonachi numbers . Use smaller range multiplier for higher TFs. This module may serve as a signal generator to be passed through a signal filter.
Quote from the original author:
This is an experimental study designed to filter out minor price action for a clearer view of trends. Inspired by the QQE's volatility filter, this filter applies the process directly to price rather than to a smoothed RSI. First, a smooth average price range is calculated for the basis of the filter and multiplied by a specified amount. Next, the filter is calculated by gating price movements that do not exceed the specified range. Lastly the target ranges are plotted to display the prices that will trigger filter movement.

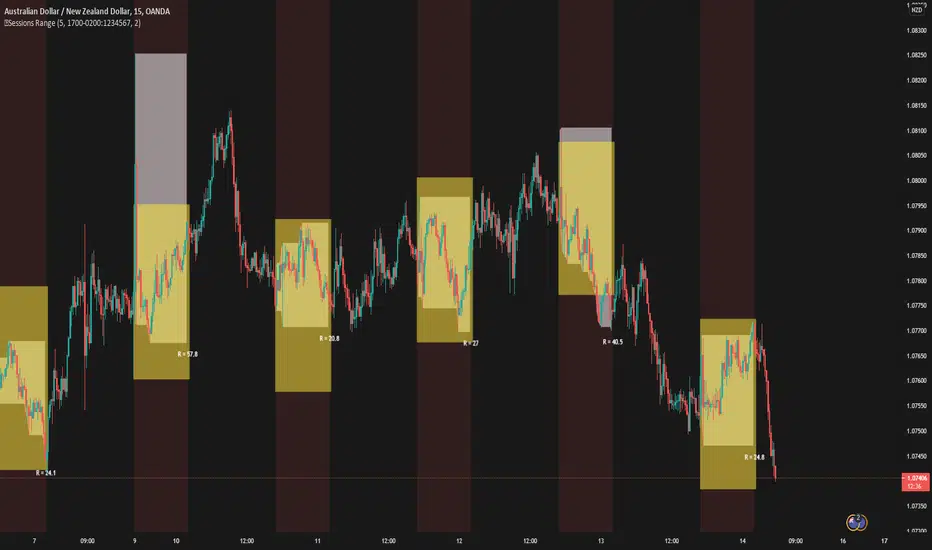
5 Sessions RangeThis script averages the range of the previous 5 sessions and displays it on the chart
The sessions are adjustable
Trend Channel [Gu5]SMA 200 determines the trend
Bullish trend, green candles. Down trend, red candles.
If the market value is narrow to the SMA200 channel, yellow candles.
Setting recommended for SMA Range
BTCUSD = 100
EURUSD = 1000
SPX = 100
ETHUSD = 10

RePaNoCHa V4 [Alerts]Script for automatic trading with Alerts.
LG --> Long (green: not confirmed) (lime: confirmed)
ST --> Short (maroon: not confirmed) (red: confirmed)
TS --> Trailing Stop
xL --> Close Long Position
xS --> Close Short Position
SL --> Stop Loss
The trailing stop closes the trade if the price changes direction by a specified percentage or offset. There is no ideal distance because markets and price are always changing and we know that is impossible to exit on the top or bottom. This script interpolate the trailing Stop Offset with profit, higher profit --> higher Trailing Stop Offset. Despite this, it's difficult to catch the price but not impossible. It has a TS delay too. It take a snapshot every X seconds, if the TS is activated the alert is triggered, otherwise the price keeps fluctuating until a new snapshot.
It can be easily converted to Backtest. Just delete "//" on the corresponding part.
Default settings for XBT:USD at 1H.

Range Candles - JDThis tool takes a "RANGE" chart and transforms it into "NORMAL" or "HEIKEN-ASHI" candles.
Instantly giving you a much better visual interpretation of the "range" information!!!
NOTE: due to the nature of Pinescript and how range charts are constructed it's possible the candles are not formed on every tick!!!
When formed though, they don't repaint and are calculated differently for every bar so you get approximately the most accurate view at the price action that Tradingview can offer you!
For compasrison:
this is a view of the "1 minute" chart:
this is the normal "1 range" chart without the candles
this is the same "1 range" chart with Heiken-Ashi candles
this is the normal "1000 range" chart (+/- equal to the 1 minute) without the candles
this is the same "1000 range" chart with Heiken-Ashi candles
JD.
#NotTradingAdvice #DYOR
Disclaimer.
I AM NOT A FINANCIAL ADVISOR.
THESE IDEAS ARE NOT ADVICE AND ARE FOR EDUCATION PURPOSES ONLY.
ALWAYS DO YOUR OWN RESEARCH!
I build these indicators for myself and provide them open source, to use for free to use and improve upon,
as I believe the best way to learn is toghether.

Combo Strategy 123 Reversal & Breakout Range Short This is combo strategies for get a cumulative signal.
First strategy
This System was created from the Book "How I Tripled My Money In The
Futures Market" by Ulf Jensen, Page 183. This is reverse type of strategies.
The strategy buys at market, if close price is higher than the previous close
during 2 days and the meaning of 9-days Stochastic Slow Oscillator is lower than 50.
The strategy sells at market, if close price is lower than the previous close price
during 2 days and the meaning of 9-days Stochastic Fast Oscillator is higher than 50.
Second strategy
Breakout Range Short Strategy
WARNING:
- For purpose educate only
- This script to change bars colors.

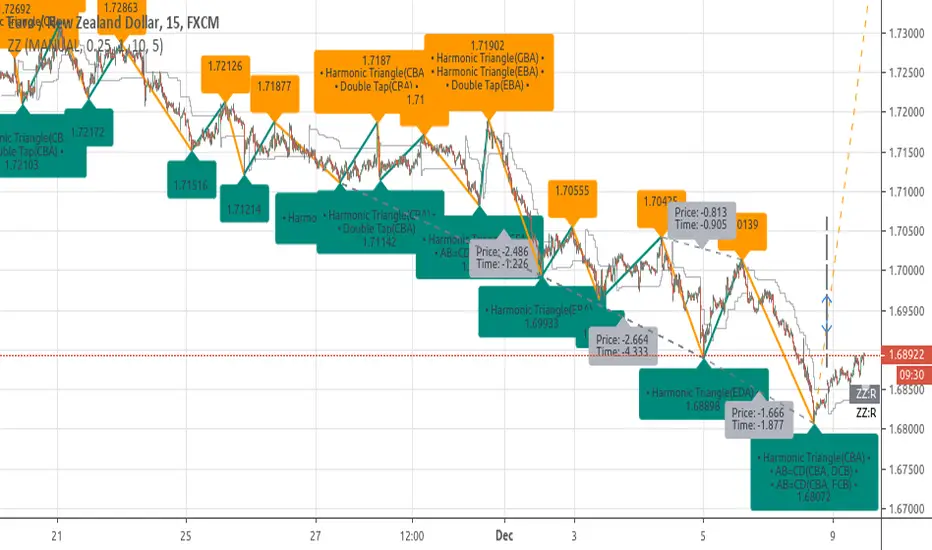
[RS]ZigZag Percent Reversal - Forecast - patterns - labels description:
• Zig Zag indicator plots points on the chart whenever prices reverse
by a percentage greater than a pre-chosen variable.
• Forecasts area based on zigzag statistics.
• Displays labels with detected patterns.
• Displays slope information rate of price, time diferentials and angle(experimental)
Combo Strategy 123 Reversal & Breakout Range Long This is combo strategies for get a cumulative signal.
First strategy
This System was created from the Book "How I Tripled My Money In The
Futures Market" by Ulf Jensen, Page 183. This is reverse type of strategies.
The strategy buys at market, if close price is higher than the previous close
during 2 days and the meaning of 9-days Stochastic Slow Oscillator is lower than 50.
The strategy sells at market, if close price is lower than the previous close price
during 2 days and the meaning of 9-days Stochastic Fast Oscillator is higher than 50.
Second strategy
Breakout Range Long Strategy
WARNING:
- For purpose educate only
- This script to change bars colors.

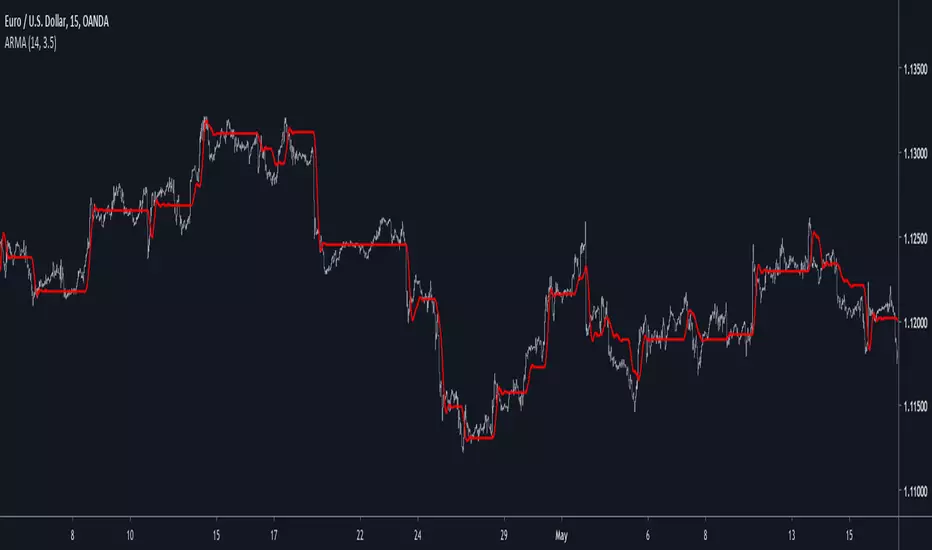
Autonomous Recursive Moving AverageIntroduction
People often ask me what is my best indicators, i can't really respond to this question with a straight answer but i would say you to check this indicator. The Autonomous Recursive Moving Average (ARMA) is an adaptive moving average that try to minimize the sum of squares thanks to a ternary operator, this choice can seem surprising since most of the adaptive moving averages adapt to a smoothing variable thanks to exponential averaging, but there are lot of downsides to this method, i really wanted to have a flat filter during flat markets and this is what i achieved.
The Indicator
length control the amount of smoothing during trending periods, gamma is the trend sensitivity threshold, higher values of gamma will make an overall flat filter, adjust gamma to skip ranging markets.
gamma = 2, we can adjust to 3 while preserving smoothing reactivity with trading periods.
gamma = 3
low length and higher gamma create more boxy result, the filter add overshoots directly in the output, its unfortunate.
The Zero-Lag option can reduce the lag as well as getting additional flat results without changing gamma.
Conclusion
The indicator need work, but i can't leave without publishing it, the overshoots are a big problems, changing sma for another stable filter can help. I hope you find an use to it, i really like this indicator.
Thanks for reading
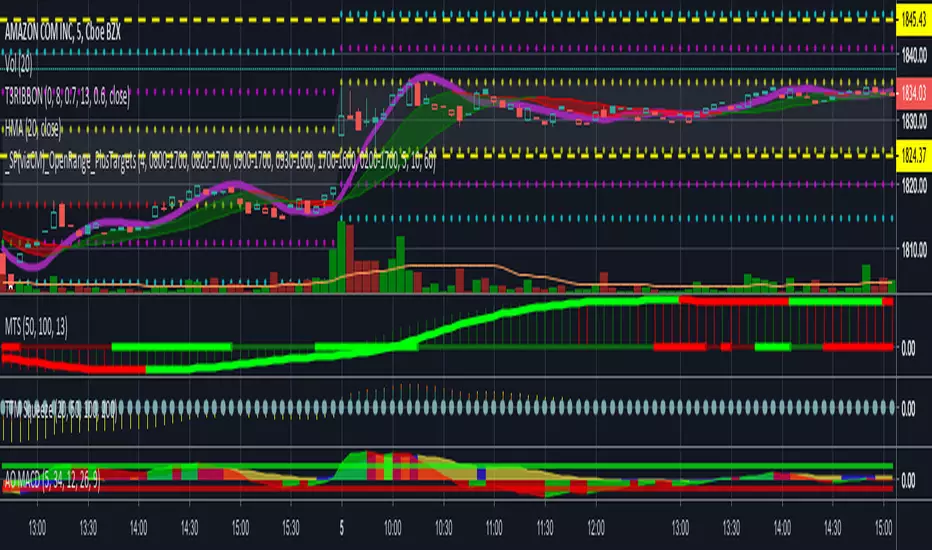
_SP(viaCM)_Opening-Range-FinalChris Moody's script. I just lessened the line/circle width, got rid of the highlighting overall, and reduced the highlighting between OR high and OR low.
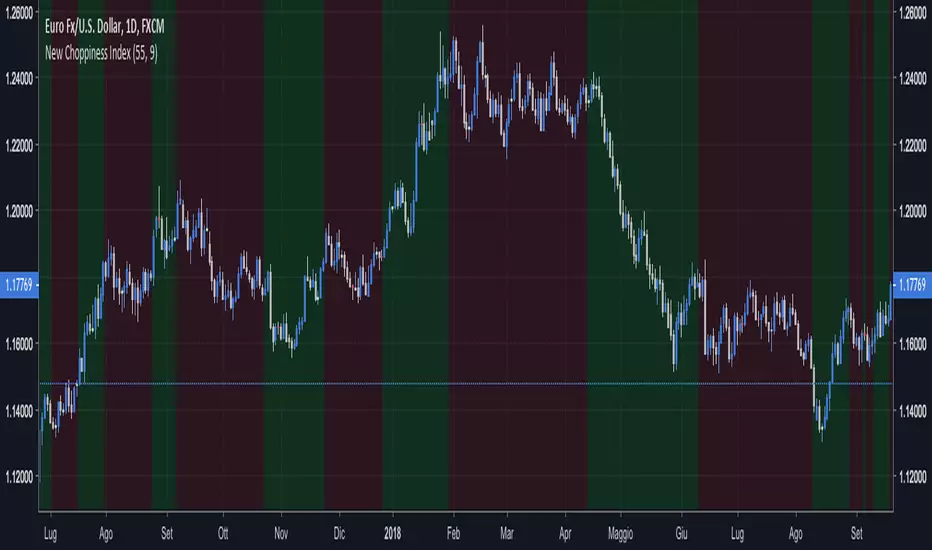
New Choppiness IndexThis script tries to identify trending regions and ranging choppy regions.
Green areas are trends; Red areas are consolidation areas.
If you are a trend follower trader you should focus on green areas;
If you are a harmonic pattern trader you should focus on red areas.
I did not play with the parameters extensively, but as a rule of thumb higher parameters
helps on long term trades.
This tool seems to work better for major currencies pairs, presumably due to the
high exchanged volumes that reduces weird fluctuations.
Good set of parameters are:
(55, 9) the default ones, doing impressively well in EURUSD Daily;
(8, 5) doing well in GBPCHF Daily, short trades to be set at lower timeframes.
Happy trading,
vitelot/yanez/Vts
January 2019
Hitting the like button is a free sign of gratitude.

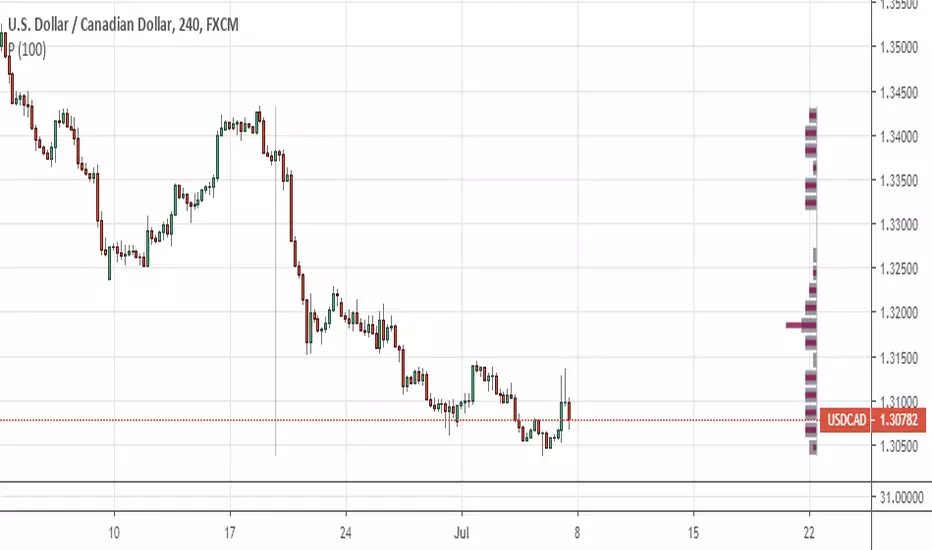
High-Low RangeThis script just shows a histogram of the daily range. You can change the interval to view the high/low range of any period, but I use it just to see what the day's range is and how it compares to prior days. Simple and straightforward.
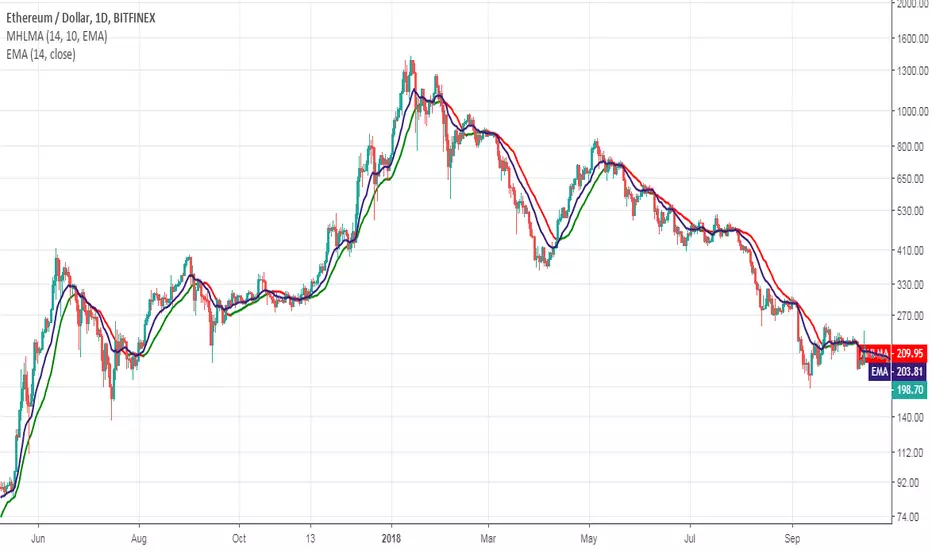
Middle-High-Low Moving AverageThis indicator was originally developed by Vitali Apirine (Stocks & Commodities , V.34:9 (August, 2016): "The Middle-High-Low Moving Average").
You can use it to create a crossover trading system in conjuction with EMA/SMA.
Good luck!
[ALERTS] Range Filter"This is an experimental study designed to filter out minor price action for a clearer view of trends.
Inspired by the QQE's volatility filter, this filter applies the process directly to price rather than to a smoothed RSI .
First, a smooth average price range is calculated for the basis of the filter and multiplied by a specified amount.
Next, the filter is calculated by gating price movements that do not exceed the specified range.
Lastly the target ranges are plotted to display the prices that will trigger filter movement.
Custom bar colors are included. The color scheme is based on the filtered price trend."
Thanks to Donovan Wall...
Enjoy!
