Implied Range from Options [SS]I have been promising to post this for a while, but I just needed to make sure that a) there were no similar indicators already available and b) make it a bit more user friendly.
So here it is, a basic indicator that will display the implied range from options.
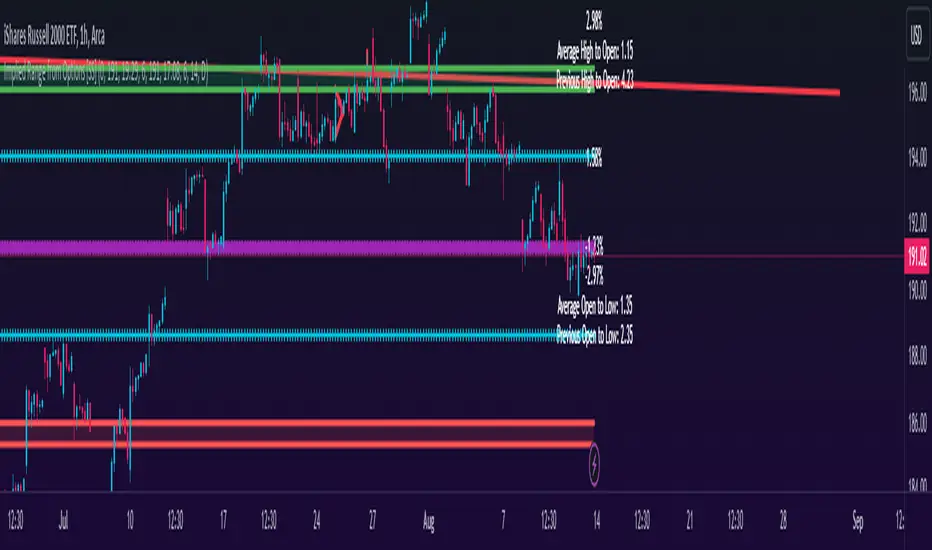
In addition to displaying the implied range from options, it will provide some secondary information to help add context to the implied range. Those are shown in the chart below:
The indicator will list various precents at each point to the upside and to the downside. This is the percent move required, based on the current close price, to obtain any point in the implied move range.
In addition, the indicator will display the average move from open to high and open to low over a user defined period (default to 14 candle period) as well as the previous open to high and open to low move from the previous day.
This is to give you context of:
a) How much of a % increase or decrease is required to reach the implied ranges; and
b) How does the implied range compare to the ticker's average moves.
An increased implied range that exceeds the ticker's average move can alert you that the market is pricing in an above average move. This can be helpful and alert you to potential news releases or other fundamental things that have the potential to move the market.
How to Use the indicator:
So unfortunately, this indicator requires a bit of manual input. I was going to do an auto IV calculcation using Black-Scholes Model but just to be more rigorous in accuracy, I decided to, for now, leave it at a manual input. So when you launch the settings menu, this is what you will see:
You can collect all of this required information from your broker. Inversely, you can collect it online for free from various services such as Barchart or COBE's exchange website. The easiest way is to just pull it from your broker though.
Make sure, if you are doing weekly options to see the weekly range, you set the timeframe to 1 week. The timeframe function will calculate the average move over the desired timeframe length. So if you are doing a 0 dte for the next day, you want to see the intra-day range and will select the 1 day timeframe. It will then present to you the range averages and information on the daily timeframe for you to compare to the implied options range.
Same for the weekly, monthly, yearly, etc.
Additional options:
The indicator provides the midline average and midway points, to add static targets if you are trading the implied range.
These can be toggled on or off in the settings menu:
As well, as you can see, you can also toggle off the range labels.
There is also an offset option. This allows you to extend the range into the future:
Simply select how many candles you would like to plot the range in advance.
Closing remarks
That is the indicator. Its very simple, but it is handy. I was never one to pay attention to option pricing data, but I have been plotting it out daily and weekly these past few weeks and it does add a bit of context in terms of what the market is thinking. So I do recommend actually adding it to your repertoire of analyses going into the weeks and months, and really just paying attention to how the average ranges compare to what the market is pricing in.
One quick suggestion, select the strike price that aligns with the closing price of the ticker. This gives you a better representation of the range.
Safe trades everyone and leave your comments, questions and suggestions below!
Range
Average Range LinesThis Average Range Lines indicator identifies high and low price levels based on a chosen time period (day, week, month, etc.) and then uses a simple moving average over the length of the lookback period chosen to project support and resistance levels, otherwise referred to as average range. The calculation of these levels are slightly different than Average True Range and I have found this to be more accurate for intraday price bounces.
Lines are plotted and labeled on the chart based on the following methodology:
+3.0: 3x the average high over the chosen timeframe and lookback period.
+2.5: 2.5x the average high over the chosen timeframe and lookback period.
+2.0: 2x the average high over the chosen timeframe and lookback period.
+1.5: 1.5x the average high over the chosen timeframe and lookback period.
+1.0: The average high over the chosen timeframe and lookback period.
+0.5: One-half the average high over the chosen timeframe and lookback period.
Open: Opening price for the chosen time period.
-0.5: One-half the average low over the chosen timeframe and lookback period.
-1.0: The average low over the chosen timeframe and lookback period.
-1.5: 1.5x the average low over the chosen timeframe and lookback period.
-2.0: 2x the average low over the chosen timeframe and lookback period.
-2.5: 2.5x the average low over the chosen timeframe and lookback period.
-3.0: 3x the average low over the chosen timeframe and lookback period.
Look for price to find support or resistance at these levels for either entries or to take profit. When price crosses the +/- 2.0 or beyond, the likelihood of a reversal is very high, especially if set to weekly and monthly levels.
This indicator can be used/viewed on any timeframe. For intraday trading and viewing on a 15 minute or less timeframe, I recommend using the 4 hour, 1 day, and/or 1 week levels. For swing trading and viewing on a 30 minute or higher timeframe, I recommend using the 1 week, 1 month, or longer timeframes. I don’t believe this would be useful on a 1 hour or less timeframe, but let me know if the comments if you find otherwise.
Based on my testing, recommended lookback periods by timeframe include:
Timeframe: 4 hour; Lookback period: 60 (recommend viewing on a 5 minute or less timeframe)
Timeframe: 1 day; Lookback period: 10 (also check out 25 if your chart doesn’t show good support/resistance at 10 days lookback – I have found 25 to be useful on charts like SPX)
Timeframe: 1 week; Lookback period: 14
Timeframe: 1 month; Lookback period: 10
The line style and colors are all editable. You can apply a global coloring scheme in the event you want to add this indicator to your chart multiple times with different time frames like I do for the weekly and monthly.
I appreciate your comments/feedback on this indicator to improve. Also let me know if you find this useful, and what settings/ticker you find it works best with!
Also check out my profile for more indicators!

DTR & ATR
Description
This ATR and DTR label is update of Existing Label provided by © ssksubam
Please See Notes on original Script Here :
Original Code is not mine but I have done few code changes which I believe will help everyone who are looking to add more labels together and save space on the chart
ATR & DTR Script is very helpful for Day Traders as I will explain in detail bellow
Following are changes I have incorporated
Previous Label took more space on the charts with Header and Footer.
I removed the Header and moved both DTR vs ATR descriptions on the same line, saving space on the chart.
I updated the code to remove => signs, which are self-explanatory as I will explain below.
I made the label in 1 single compact line for maximum space efficiency and aesthetics.
These changes improve the content's clarity and conciseness while optimizing space on the charts. If you have any further requests or need additional assistance, feel free to let me know!
What Does DTR Signify?
Stock ATR stands for Average True Range, which is a technical indicator used in trading and investment analysis. The Average True Range measures the volatility of a stock over a given period of time. It provides insights into the price movement and potential price ranges of the stock.
The ATR is calculated as the average of the true ranges over a specific number of periods. The true range is the greatest of the following three values:
The difference between the current high and the current low.
The absolute value of the difference between the current high and the previous close.
The absolute value of the difference between the current low and the previous close.
Traders and investors use ATR to assess the potential risk and reward of a stock. A higher ATR value indicates higher volatility and larger price swings, while a lower ATR value suggests lower volatility and smaller price movements. By understanding the ATR, traders can set appropriate stop-loss levels and make informed decisions about position sizing and risk management.
It's important to note that the ATR is not a directional indicator like moving averages or oscillators. Instead, it provides a measure of volatility, helping traders adapt their strategies to suit the current market conditions.
What Does ATR Signify?
The Average True Range (ATR) signifies the level of volatility or price variability in a particular financial asset, such as a stock, currency pair, or commodity, over a specific period of time. It provides valuable information to traders and investors regarding the potential risk and reward associated with the asset.
Here are the key significances of ATR:
Volatility Measurement: ATR measures the average price range between high and low prices over a specified timeframe. Higher ATR values indicate greater volatility, while lower values suggest lower volatility. Traders use this information to gauge the potential price movements and adjust their strategies accordingly.
Risk Assessment: A higher ATR value implies larger price swings, indicating increased market uncertainty and risk. Traders can use ATR to set appropriate stop-loss levels and manage risk by adjusting position sizes based on the current volatility.
Trend Strength: ATR can also be used to assess the strength of a trend. In an uptrend or downtrend, ATR tends to increase, indicating a more powerful price movement. Conversely, a declining ATR might signify a weakening trend or a consolidation period.
Range-Bound Market Identification: In a range-bound or sideways market, the ATR value tends to be relatively low, reflecting the lack of significant price movements. This information can be helpful for range-trading strategies.
Volatility Breakouts: Traders often use ATR to identify potential breakouts from consolidation patterns. When the ATR value expands significantly, it may indicate the beginning of a new trend or a breakout move.
Comparison between Assets: ATR allows traders to compare the volatility of different
How to use DTR & ATR for Trading
Using Average True Range (ATR) and Daily Trading Range (DTR) can be beneficial for day trading to assess potential price movements, manage risk, and identify trading opportunities. Here's how you can use both indicators effectively:
Calculate ATR and DTR: First, calculate the ATR and DTR values for the asset you are interested in trading. ATR is the average of true ranges over a specified period (e.g., 14 days), while DTR is the difference between the high and low prices of a single trading day.
Assess Volatility: Compare the ATR and DTR values to understand the current volatility of the asset. Higher values indicate increased volatility, while lower values suggest reduced volatility.
Setting Stop-Loss: Use ATR to set appropriate stop-loss levels. For example, you might decide to set your stop-loss a certain number of ATR points away from your entry point. This approach allows you to factor in market volatility when determining your risk tolerance.
Identify Trading Range: Analyze DTR to determine the typical daily price range of the asset. This information can help you identify potential support and resistance levels, which are essential for day trading strategies such as breakout or range trading.
Breakout Strategies: ATR can assist in identifying potential breakout opportunities. When ATR values increase significantly, it suggests an expansion in volatility, which may indicate an upcoming breakout from a trading range. Look for breakouts above resistance or below support levels with higher than usual ATR values.
Scalping Strategies: For scalping strategies, where traders aim to profit from small price movements within a single trading session, knowing the typical DTR can help set reasonable profit targets and stop-loss levels.
Confirming Trend Strength: In day trading, you may encounter short-term trends. Use ATR to assess the strength of these trends. If the ATR is rising, it suggests a strong trend, while a declining ATR may indicate a weakening trend or potential reversal.
Risk Management: Both ATR and DTR can aid in risk management. Determine your position size based on the current ATR value to align it with your risk tolerance. Additionally, understanding the DTR can help you avoid overtrading during periods of low volatility.
Combine with Other Indicators: ATR and DTR work well when used in conjunction with other technical indicators like moving averages, Bollinger Bands, or RSI. Combining multiple indicators can provide a mor

Average True Range Trailing Mean [Alifer]Upgrade of the Average True Range default indicator by TradingView. It adds and plots a trailing mean to show periods of increased volatility more clearly.
ATR TRAILING MEAN
A trailing mean, also known as a moving average, is a statistical calculation used to smooth out data over time and identify trends or patterns in a time series.
In our indicator, it clearly shows when the ATR value spikes outside of it's average range, making it easier to identify periods of increased volatility.
Here's how the ATR Trailing Mean (atr_mean) is calculated:
atr_mean = ta.cum(atr) / (bar_index + 1) * atr_mult
The ta.cum() function calculates the cumulative sum of the ATR over all bars up to the current bar.
(bar_index + 1) represents the number of bars processed up to the current bar, including the current one.
By dividing the cumulative ATR ta.cum(atr) by (bar_index + 1) and then multiplying it by atr_mult (Multiplier), we obtain the ATR Trailing Mean value.
If atr_mult is set to 1.0, the ATR Trailing Mean will be equal to the simple average of the ATR values, and it will follow the ATR's general trend.
However, if atr_mult is increased, the ATR Trailing Mean will react more strongly to the ATR's recent changes, making it more sensitive to short-term fluctuations.
On the other hand, reducing atr_mult will make the ATR Trailing Mean less responsive to recent changes in ATR, making it smoother and less prone to reacting to short-term volatility.
In summary, adjusting the atr_mult input allows traders to fine-tune the ATR Trailing Mean's responsiveness based on their preferred level of sensitivity to recent changes in market volatility.
IMPLEMENTATION IN A STRATEGY
You can easily implement this indicator in an existing strategy, to only enter positions when the ATR is above the ATR Trailing Mean (with Multiplier-adjusted sensitivity). To do so, add the following lines of codes.
Under Inputs:
length = input.int(title="Length", defval=20, minval=1)
atr_mult = input.float(defval=1.0, step = 0.1, title = "Multiplier", tooltip = "Adjust the sensitivity of the ATR Trailing Mean line.")
smoothing = input.string(title="Smoothing", defval="RMA", options= )
ma_function(source, length) =>
switch smoothing
"RMA" => ta.rma(source, length)
"SMA" => ta.sma(source, length)
"EMA" => ta.ema(source, length)
=> ta.wma(source, length)
This will allow you to define the Length of the ATR (lookback length over which the ATR is calculated), the Multiplier to adjust the Trailing Mean's sensitivity and the type of Smoothing to be used for the ATR.
Under Calculations:
atr= ma_function(ta.tr(true), length)
atr_mean = ta.cum(atr) / (bar_index+1) * atr_mult
This will calculate the ATR based on Length and Smoothing, and the resulting ATR Trailing Mean.
Under Entry Conditions, add the following to your existing conditions:
and atr > atr_mean
This will make it so that entries are only triggered when the ATR is above the ATR Trailing Mean (adjusted by the Multiplier value you defined earlier).
ATR - DEFINITION AND HISTORY
The Average True Range (ATR) is a technical indicator used to measure market volatility, regardless of the direction of the price. It was developed by J. Welles Wilder and introduced in his book "New Concepts in Technical Trading Systems" in 1978. ATR provides valuable insights into the degree of price movement or volatility experienced by a financial asset, such as a stock, currency pair, commodity, or cryptocurrency, over a specific period.
ATR - CALCULATION AND USAGE
The ATR calculation involves three components:
1 — True Range (TR): The True Range is a measure of the asset's price movement for a given period. It takes into account the following factors:
The difference between the high and low prices of the current period.
The absolute value of the difference between the high price of the current period and the closing price of the previous period.
The absolute value of the difference between the low price of the current period and the closing price of the previous period.
Mathematically, the True Range (TR) for the current period is calculated as follows:
TR = max(high - low, abs(high - previous_close), abs(low - previous_close))
2 — ATR Calculation: The ATR is calculated as a Moving Average (MA) of the True Range over a specified period.
The ATR is calculated as follows:
ATR = MA(TR, length)
3 — ATR Interpretation: The ATR value represents the average volatility of the asset over the chosen period. Higher ATR values indicate higher volatility, while lower ATR values suggest lower volatility.
Traders and investors can use ATR in various ways:
Setting Stop Loss and Take Profit Levels: ATR can help determine appropriate stop-loss and take-profit levels in trading strategies. A larger ATR value might require wider stop-loss levels to allow for the asset's natural price fluctuations, while a smaller ATR value might allow for tighter stop-loss levels.
Identifying Market Volatility: A sharp increase in ATR might indicate heightened market uncertainty or the potential for significant price movements. Conversely, a decreasing ATR might suggest a period of low volatility and possible consolidation.
Comparing Volatility Between Assets: Since ATR uses absolute values, it shouldn't be used to compare volatility between different assets, as assets with higher prices will consistently have higher ATR values, while assets with lower prices will consistently have lower ATR values. However, the addition of a trailing mean makes such a comparison possible. An asset whose ATR is consistently close to its ATR Trailing Mean will have a lower volatility than an asset whose ATR continuously moves far above and below its ATR Trailing Mean. This can help traders and investors decide which markets to trade based on their risk tolerance and trading strategies.
Determining Position Size: ATR can be used to adjust position sizes, taking into account the asset's volatility. Smaller position sizes might be appropriate for more volatile assets to manage risk effectively.

Buyers & Sellers / RangeBuyers & Sellers / Range
Volatility oscillator that measures the relationship of Buying & Selling Pressure to True Range.
In other words, how much % Buyers and Sellers separately occupy the Bar
BSP is a part of Bar Range. Entire bar metrics will always have bigger value than its composite elements (body and wicks).
Since there will be NO chance of BP or SP being more than ATR, their ratio would serve crucial Volatility details.
Hence, we can relate each of them to the overall range.
As a result we have simultaneous measurements of proportions buyers and sellers to the bar.
Default mode shows BP/ATR and SP/ATR mirrored. When one rises, the other falls to compensate.
Buying Pressure / True Range ⬆️🟢 ⬇️🔵
Selling Pressure / True Range ⬆️🔴 ⬇️🟠
They are being averaged in 2 different ways:
Pre-average first, then relate as ratio
Related first, then Averaged
Enable "Preaveraged" to use already averaged BSP and Ranges in ratio instead of averaging the ratio of BSP to individual bar. For example, we're looking BP/ATR, in calculation of buyers / Range it will use "MA(Buying Pressure) / MA(True Range)" instead of "MA(Buying Pressure / True Range)".
Due such calculation, it is going to be more lagging than in off mode. Nevertheless, it reduces noise from the impact of individual bar change.
Second way of noise reduction is enabling "Body / Range"
BSP Body / Range where Bullish & Bearish Body = Buying & Selling Pressure - Relevant Wick
Buying Body = Buying Pressure - Lower Wick
Selling Body = Selling Pressure - Upper Wick
And only then it is divided to ATR.
Note that Balance line differs because body is less than it used to be with wicks. So change in wicks won't play any role in computing the ratio anymore. Thus, signals of their crossings will be more reliable than in default mode.

20/200MAs+LTF+4HTF and HighLowBox+3HTF20/200MAs
Shows 20 and 200 MAs in each TFs(tfChart,1 Lower and 4 Higher).
TFs:
current TF
Lower TF (default: lower1)
Higher TF1 (default: higher1)
Higher TF2 (default: higher1)
Higher TF3 (default: higher1)
Higher TF4 (default: higher1)
MAs:
20MA (default: sma)
1st 200MA (default: sma)
2nd 200MA (default: ema)
VWAP (optional)
HighLowBox+3HTF
Enclose in a square high and low range in each timeframe.
Shows price range and duration of each box.
In current timeframe, shows Fibonacci Scale inside(23.6%, 38.2%, 50.0%, 61.8%, 76.4%)/outside of each box.
Outside(161.8%,261.8,361.8%) would be shown as next target, if break top/bottom of each box.
1st box for current timeframe.
2nd box for higher timeframe.(default: higher1)
3rd box for higher timeframe.(default: higher2)
4th box for higher timeframe.(default: higher3)
static timeframes can also be used.

RAINBOW AVERAGES - INDICATOR - (AS) - 1/3
-INTRODUCTION:
This is the first of three scripts I intend to publish using rainbow indicators. This script serves as a groundwork for the other two. It is a RAINBOW MOVING AVERAGES indicator primarily designed for trend detection. The upcoming script will also be an indicator but with overlay=false (below the chart, not on it) and will utilize RAINBOW BANDS and RAINBOW OSCILLATOR. The third script will be a strategy combining all of them.
RAINBOW moving averages can be used in various ways, but this script is mainly intended for trend analysis. It is meant to be used with overlay=true, but if the user wishes, it can be viewed below the chart. To achieve this, you need to change the code from overlay=true to false and turn off the first switch that plots the rainbow on the chart (or simply move the indicator to a new pane below). By doing this, you will be able to see how all four conditions used to detect trends work on the chart. But let's not get ahead of ourselves.
-WHAT IS IT:
In its simplest form, this indicator uses 10 moving averages colored like a rainbow. The calculation is as follows:
MA0: This is the main moving average and can be defined with the type (SMA, EMA, RMA, WMA, SINE), length, and price source. However, the second moving average (MA1) is calculated using MA0 as its source, MA2 uses MA1 as the data source, and so on, until the last one, MA9. Hence, there are 10 moving averages. The first moving average is special as all the others derive from it. This indicator has many potential uses, such as entry/exit signals, volatility indication, and stop-loss placement, but for now, we will focus on trend detection.
-TREND DETECTION:
The indicator offers four different background color options based on the user's preference:
0-NONE: No background color is applied as no trend detection tools is being used (boring)
1-CHANGE: The background color is determined by summing the changes of all 10 moving averages (from two bars). If the sum is positive and not falling, the background color is GREEN. If the sum is negative and not rising, the background color is RED. From early testing, it works well for the beginning of a movement but not so much for a lasting trend.
2-RAINBW: The background color is green when all the moving averages are in ascending order, indicating a bullish trend. It is red when all the moving averages are in descending order, indicating a bearish trend. For example, if MA1>MA2>MA3>MA4..., the background color is green. If MA1 threshold, and red indicates width < -threshold.
4-DIRECT: The background color is determined by counting the number of moving averages that are either above or below the input source. If the specified number of moving averages is above the source, the background color is green. If the specified number of moving averages is below the source, the background color is red. If all ten MAs are below the price source, the indicator will show 10, and if all ten MAs are above, it will show -10. The specific value will be set later in the settings (same for 3-TSHOLD variant). This method works well for lasting trends.
Note: If the indicator is turned into a below-chart version, all four color options can be seen as separate indicators.
-PARAMETERS - SETTINGS:
The first line is an on/off switch to plot the skittles indicator (and some info in the tooltip). The second line has already been discussed, which is the background color and the selection of the source (only used for MA0!).
The line "MA1: TYP/LEN" is where we define the parameters of MA0 (important). We choose from the types of moving averages (SMA, EMA, RMA, WMA, SINE) and set the length.
Important Note: It says MA1, but it should be MA0!.
The next line defines whether we want to smooth MA1 (which is actually MA0) and the period for smoothing. When smoothing is turned on, MA0 will be smoothed using a 3-pole super smoother. It's worth noting that although this only applies to MA0, as the other MAs are derived from it, they will also be smoothed.
In the line below, we define the type and length of MAs for MA2 (and other MAs except MA0). The same type and length are used for MA1 to MA9. It's important to remember that these values should be smaller. For example, if we set 55, it means that MA1 is the average of 55 periods of MA0, MA2 will be 55 periods of MA1, and so on. I encourage trying different combinations of MA types as it can be easily adjusted for ur type of trading. RMA looks quirky.
Moving on to the last line, we define some inputs for the background color:
TSH: The threshold value when using 3-TSHOLD-BGC. It's a good idea to change the chart to a pane below for easier adjustment. The default values are based on EURUSD-5M.
BG_DIR: The value that must be crossed or equal to the MA score if using 4-DIRECT-BGC. There are 10 MAs, so the maximum value is also 10. For example, if you set it to 9, it means that at least 9 MAs must be below/above the price for the script to detect a trend. Higher values are recommended as most of the time, this indicator oscillates either around the maximum or minimum value.
-SUMMARY OF SETTINGS:
L1 - PLOT MAs and general info tooltip
L2 - Select the source for MA0 and type of trend detection.
L3 - Set the type and length of MA0 (important).
L4 - Turn smoothing on/off for MA0 and set the period for super smoothing.
L5 - Set the type and length for the rest of the MAs.
L6 - Set values if using 4-DIRECT or 3-TSHOLD for the trend detection.
-OTHERS:
To see trend indicators, you need to turn off the plotting of MAs (first line), and then choose the variant you want for the background color. This will plot it on the chart below.
Keep in mind that M1 int settings stands for MA0 and MA2 for all of the 9 MAs left.
Yes, it may seem more complicated than it actually is. In a nutshell, these are 10 MAs, and each one after MA0 uses the previous one as its source. Plus few conditions for range detection. rest is mainly plots and colors.
There are tooltips to help you with the parameters.
I hope this will be useful to someone. If you have any ideas, feedback, or spot errors in the code, LET ME KNOW.
Stay tuned for the remaining two scripts using skittles indicators and check out my other scripts.
-ALSO:
I'm always looking for ideas for interesting indicators and strategies that I could code, so if you don't know Pinescript, just message me, and I would be glad to write your own indicator/strategy for free, obviously.
-----May the force of the market be with you, and until we meet again,

HighLowBox 1+3TF Enclose in a square high and low range in each timeframe.
Shows price range and duration of each box.
In current timeframe, shows Fibonacci Scale inside(23.6%, 38.2%, 50.0%, 61.8%, 76.4%)/outside of each box.
Outside(161.8%,261.8,361.8%) would be shown as next target, if break top/bottom of each box.
1st box for current timeframe.(default: Chart)
2nd-4th box for higher timeframes.(default: higher1,higher2,higher3)
static timeframes can also be used.
Predictive Ranges [LuxAlgo]The Predictive Ranges indicator aims to efficiently predict future trading ranges in real-time, providing multiple effective support & resistance levels as well as indications of the current trend direction.
Predictive Ranges was a premium feature originally released by LuxAlgo in 2020.
The feature was discontinued & made legacy, however, due to its popularity and reproduction attempts, we deemed it necessary to release it open source to the community.
🔶 USAGE
The primary purpose of this indicator is to provide potential support & resistance levels on the chart by estimating future trading ranges.
When the price reaches one of the upper/lower levels of the Predictive Ranges we can expect the price to reverse.
If the price exits the predicted range, new levels are given in real-time & they do not repaint. Higher "Factor" values allow returning longer term and wider ranges less susceptible to be exited.
🔹 Estimating Trend Directions
Users are able to easily estimate trend directions by looking at the central levels of the predictive ranges, which represent an estimate of the price central tendency.
If this central level increases it means the price is up-trending, if it is decreasing price is down-trending.
🔶 SETTINGS
Length: ATR Length used for the indicator calculation. Higher values will tend to return ranges of equal width.
Factor: Control the ranges width. Higher values will return less frequent ranges, each having a higher width.
Timeframe: Indicator timeframe output.
Source: Input source of the indicator. It is recommended to use input sources on the same scale as the price.

Simple Grid Lines VisualizerAbout Grid Bots
A grid bot is a type of trading bot or algorithm that is designed to automatically execute trades within a predefined price range or grid. It is commonly used in markets that exhibit ranging or sideways movement, where prices tend to fluctuate within a specific range without a clear trend.
The grid bot strategy involves placing a series of buy and sell orders at regular intervals within the predefined price range or grid. The bot essentially creates a grid of orders, hence the name. When the price reaches one of these levels, the bot will execute the corresponding trade. For example, if the price reaches a predefined lower level, the bot will buy, and if it reaches a predefined upper level, it will sell.
The purpose of the grid bot strategy is to take advantage of the price oscillations within the range. As the price moves up and down, the bot aims to generate profits by buying at the lower end of the range and selling at the higher end. By repeatedly buying and selling at these predetermined levels, the bot attempts to capture gains from the price fluctuations.
About this Script
Simple Grid Lines Visualizer is designed to assist traders in visualizing and implementing automated price grids on their charts. With just a few inputs, this script generates gridlines based on your specified top price, bottom price, and the number of grids or profit per grid.
How it Works:
Specify Top and Bottom Prices: Start by setting the top and bottom prices that define the range within which the gridlines will be generated. These prices can be based on support and resistance levels, historical data, or any other factors you consider relevant to your analysis.
Determine Grid Parameters: Choose either the number of grids or profit per grid, depending on your preference and trading strategy. If you select the number of grids, the script will evenly distribute the gridlines within the specified price range. Alternatively, if you opt for profit per grid, the script will calculate the price increment required to achieve your desired profit level per grid.
Note that when choosing Profit per Grid , an approximation usually is performed, as all grid lines must be evenly distributed. To achieve that, the script computes the grid distance using the mean price between top and bottom, then computes how many of those complete distances may enter the entire range, and lastly, creates a grid with evenly distributed distances as close as possible to the previously computed.
Customize Styling and Display: Adjust the line color, line style, transparency, and other visual aspects to ensure clear visibility on your charts.
Analyze and Trade: Once the gridlines are plotted on your chart, carefully observe how the market interacts with them. The gridlines can act as reference points for potential support and resistance levels, as well as simple buy/sell orders for a trading bot.
Try to find gridlines that intersect prices as frequently as possible from one to another.
A grid with too many lines will make lots of potential trades, but the amount traded will be minimal (as the total amount invested is divided over the number of grids).
A grid with too few lines will make lots of profits with each trade, but the trades will be less likely to occur (depending on the top/bottom distance).
This tool aims to help visually which grid parameters seem to optimize this problem.
Future versions may include automatic profit computation.

Moving Average - TREND POWER v1.1- (AS)0)NOTE:
This is first version of this indicator. It's way more complicated than it should be. Check out Moving Average-TREND POWER v2.1-(AS), its waaaaay less complicated and might be better.Enjoy...
1)INTRODUCTION/MAIN IDEA:
In simpliest form this script is a trend indicator that rises if Moving average if below price or falling if above and going back to zero if there is a crossover with a price. To use this indicator you will have to adjust settings of MAs and choose conditions for calculation.
While using the indicator we might have to define CROSS types or which MAs to use. List of what cross types are defined in the script and Conditiones to choose from.The list will be below.
2) COMPOSITION:
-MA1 can be defined by user in settings, possible types: SMA, EMA, RMA, HMA, TEMA, DEMA, LSMA, WMA.
-MA2 is always ALMA
3) OVERLAY:
Default is false but if you want to see MA1/2 on chart you can change code to true and then turn on overlay in settings. Most plot settings are avalible only in OV=false.
if OV=true possible plots ->MA1/2, plotshape when choosen cross type
if OV=false -> main indicator,TSHs,Cross counter
4)PRESETS :
Indicator has three modes that can be selected in settings. First two are presets and do not require selecting conditions as they set be default.
-SIMPLE - most basic
-ABSOLUTE - shows only positive values when market is trending or zero when in range
-CUSTOM - main and the most advanced form that will require setting conditions to use in calculating trend
4.1)SIMPLE – this is the most basic form of conditions that uses only First MA. If MA1 is below selected source (High/Low(High for Uptrend and Low for DNtrend or OHLC4) on every bar value rises by 0.02. if it above Low or OHLC4 it falls by 0.02 with every bar. If there is a cross of MA with price value is zero. This preset uses CROSS_1_ULT(list of all cross types below)
4.2) ABSOLUTE – does not show direction of the trend unlike others and uses both MA1 and MA2. Uses CROSS type 123_ULT
4.3) CUSTOM – here we define conditions manually. This mode is defined in parts (5-8 of description)
5)SETTINGS:
SOURCE/OVERLAY(line1) – select source of calculation form MA1/MA2, select for overlay true (look point 3)
TRESHOLDS(line2). – set upper and lower THS, turn TSHs on/off
MA1(line3) – Length/type of MA/Offset(only if MA type is LSM)
MA2(line4) – length/offset/sigma -(remember to set ma in the way that in Uptrend MA2MA1 in DNtrend)
Use faster MA types for short term trends and slower types / bigger periods for longer term trends, defval MA1/2 settings
are pretty much random so using them is not recomended.
CROSSshape(line5) – choose which cross type you want to plot on chart(only in OV=true) or what type you want to use in counting via for loops,
CROSScount(line6) – set lookback for type of cross choosen above
BOOLs in lines 5 and 6 - plotshape if OV=true/plot CROSScount histogram (if OV=false)
Lines 7 and 8 – PRESET we want to use /SRC for calculation of indicator/are conditions described below/which MAs to use/Condition for
reducing value t 0 - (if PRESET is ABSOLUTE or SIMPLE only SRC should be set(Line 8 does not matter if not CUSTOM))
5)SOURCE for CONDS:
Here you can choose between H/L and OHLC. If H/L value grow when MAlow. If OHLC MAOHLC. H/L is set by default and recommended. This can be selected for all presets not only CUSTOM
6)CROSS types LIST:
“1 means MA1, 2 is MA2 and 3 I cross of MA1/MA2. L stands for low and H for high so for example 2H means cross of MA2 and high”
NAME -DEFINITION Number of possible crosses
1L - cross of MA1 and low 1
1H - cross of MA1 and high 1
1HL - cross of MA1 and low or MA1 and high 2 -1L/1H
2L - cross of MA2 and low 1
2H - cross of MA2 and high 1
2HL - cross of MA2 and low or MA1 and high 2 -2L/2H
12L - cross of MA1 and low or MA2 and low 2 -1L/2L
12H - cross of MA1 and high or MA2 and high 2 -1H/2H
12HL - MA1/2 and high/low 4 -1H/1L/2H/2L
3 -cross of MA1 and MA2 1
123HL -crosses from 12HL or 3 5 -12HL/3
1_ULT - cross of MA1 with any of price sources(close,low,high,ohlc4 etc…)
2_ULT - cross of MA2 with any of price sources(close,low,high,ohlc4 etc…)
123_ULT – all crosses possible of MA1/2 (all of the above so a lot)
7)CRS CONDS:
“conditions to reduce value back to zero”
>/< - 0 if indicator shows Uptrend and there’s a cross with high of selected MA or 0 if in DNtrend and cross with low. Better for UP/DN trend detection
ALL – 0 if cross of MA with high or low no matter the trend, better for detecting consolidation
ULT – if any cross of selected MA, most crosses so goes to 0 most often
8)MA selection and CONDS:
-MA1: only MA1 is used,if MA1 below price value grows and the other way around
MA1price =-0.02
-MA2 – only MA2 is used, same conditions as MA1 but using MA2
MA2price =-0.02
-BOTH – MA1 and MA2 used, grows when MA1 if below, grows faster if MA1 and MA2 are below and fastest when MA1 and MA2 are below and MA2price=-0.02
-MA1 and MA2 >price=-0.03
-MA1 and MA2 ?price and MA2>MA1=-0.04
9)CONDITIONS SELECTION SUMMARRY:
So when CUSTOM we choose :
1)SOURCE – H/L or OHLC
2)MAs – MA1/MA2/BOTH
3)CRS CONDS (>/<,ALL,ULT)
So for example...
if we take MA1 and ALL value will go to zero if 1HL
if MA1 and >/< - 0 if 1L or 1H (depending if value is positive or negative).(1L or 1H)
If ALL and BOTH zero when 12HL
If BOTH and ULT value goes back to zero if Theres any cross of MA1/MA2 with price or cross of MA1 and MA2.(123_ULT)
If >/< and BOTH – 0 if 12L in DNtrend or 12H if UPtrend
10) OTHERS
-script was created on EURUSD 5M and wasn't tested on different markets
-default values of MA1/MA2 aren't optimalized so do not
-There might be a logical error in the script so let me know if you find it (most probably in 'BOTH')
-thanks to @AlifeToMake for help
-if you have any ideas to improve let me know
-there are also tooltips to help

REVE Cohorts - Range Extension Volume Expansion CohortsREVE Cohorts stands for Range Extensions Volume Expansions Cohorts.
Volume is divided in four cohorts, these are depicted in the middle band with colors and histogram spikes.
0-80 percent i.e. low volumes; these get a green color and a narrow histogram bar
80-120 percent, normal volumes, these get a blue color and a narrow histogram bar
120-200 percent, high volume, these get an orange color and a wide histogram bar
200 and more percent is extreme volume, maroon color and wide bar.
All histogram bars have the same length. They point to the exact candle where the volume occurs.
Range is divided in two cohorts, these are depicted as candles above and below the middle band.
0-120 percent: small and normal range, depicted as single size, square candles
120 percent and more, wide range depicted as double size, rectangular candles.
The range candles are placed and colored according to the Advanced Price Algorithm (published script). If the trend is up, the candles are in the uptrend area, which is above the volume band, , downtrend candles below in the downtrend area. Dark blue candles depict a price movement which confirms the uptrend, these are of course in the uptrend area. In this area are also light red candles with a blue border, these depict a faltering price movement countering the uptrend. In the downtrend area, which is below the volume band, are red candles which depict a price movement confirming the downtrend and light blue candles with a red border depicting price movement countering the downtrend. A trend in the Advanced Price Algorithm is in equal to the direction of a simple moving average with the same lookback. The indicator has the same lagging.as this SMA.
Signals are placed in the vacated spaces, e.g. during an uptrend the downtrend area is vacated.
There are six signals, which arise as follows:
1 Two blue triangles up on top of each other: high or extreme volume in combination with wide range confirming uptrend. This indicates strong and effective up pressure in uptrend
2 Two pink tringles down on top of each other: high or extreme volume in combination with wide range down confirming downtrend. This indicates strong and effective down pressure in downtrend
3 Blue square above pink down triangle down: extreme volume in combination with wide range countering uptrend. This indicates a change of heart, down trend is imminent, e.g. during a reversal pattern. Down Pressure in uptrend
4 Pink square below blue triangle up: extreme volume in combination with wide range countering downtrend. This indicates a change of heart, reversal to uptrend is imminent. Up Pressure in downtrend
5 single blue square: a. extreme volume in combination with small range confirming uptrend, b. extreme volume in combination with small range countering downtrend, c. high volume in combination with wide range countering uptrend. This indicates halting upward price movement, occurs often at tops or during distribution periods. Unresolved pressure in uptrend
6 Single pink square: a extreme volume in combination with small range confirming downtrend, b extreme volume in combination with small range countering uptrend, c high volume in combination with wide range countering downtrend. This indicated halting downward price movement. Occurs often at bottoms or during accumulation periods. Unresolved pressure in downtrend.
The signals 5 and 6 are introduced to prevent flipping of signals into their opposite when the lookback is changed. Now signals may only change from unresolved in directional or vice versa. Signals 3 and 4 were introduced to make sure that all occurrences of extreme volume will result in a signal. Occurrences of wide volume only partly lead to a signal.
Use of REVE Cohorts.
This is the indicator for volume-range analyses that I always wanted to have. Now that I managed to create it, I put it in all my charts, it is often the first part I look at, In my momentum investment system I use it primarily in the layout for following open positions. It helps me a lot to decide whether to close or hold a position. The advantage over my previous attempts to create a REVE indicator (published scripts), is that this version is concise because it reports and classifies all possible volumes and ranges, you see periods of drying out of volume, sequences of falter candles, occurrences of high morning volume, warning and confirming signals.. The assessment by script whether some volume should be considered low, normal, high or extreme gives an edge over using the standard volume bars.
Settings of REVE Cohorts
The default setting for lookback is ‘script sets lookback’ I put this in my indicators because I want them harmonized, the script sets lookback according to timeframe. The tooltip informs which lookback will be set at which timeframe, you can enable a feedback label to show the current lookback. If you switch ‘script sets lookback’ off, you can set your own preferred user lookback. The script self-adapts its settings in such a way that it will show up from the very first bar of historical chart data, it adds volume starting at the fourth bar.
You can switch off volume cohorts, only range candles will show while the middle band disappears. Signals will remain if volume is present in the data. Some Instruments have no volume data, e.g. SPX-S&P 500 Index,, then only range candles will be shown.
Colors can be adapted in the inputs. Because the script calculates matching colors with more transparency it is advised to use 100 percent opacity in these settings.
Take care, Eykpunter

ICT Killzones + Pivots [TFO]Designed with the help of TTrades and with inspiration from the ICT Everything indicator by coldbrewrosh, the purpose of this script is to identify ICT Killzones while also storing their highs and lows for future reference, until traded through.
There are 5 Killzones / sessions whose times and labels can all be changed to one's liking. Some prefer slight alterations to traditional ICT Killzones, or use different time windows altogether. Either way, the sessions are fully customizable. The sessions will auto fit to keep track of the highs and lows made during their respective times, and these pivots will be extended until they are invalidated.
There are also 4 optional Open Price lines and 4 vertical Timestamps, where the user can change the time and style of each one as well.
To help maintain a clean chart, we can implement a Cutoff Time where all drawings will stop extending past a certain point. The indicator will apply this logic by default, as it can get messy with multiple drawings starting and stopping throughout the day at different times.
Given the amount of interest I've received about this indicator, I intend to leave it open to suggestions for further improvements. Let me know what you think & what you want to see added!

Range Deviations @joshuuuThis indicator is able to show ranges, the equlibrium (50%) and range deviations.
It has four pre-defined options and one custom version.
Asia (2000-0000) ny time
CBDR(1400-2000) ny time
Flout(1400-0000) ny time
ONS (OverNightSession)(0400-0800) chicago time
Custom (you can choose the times)
ICT (Inner Circle Traders) teaches, that those range deviations of asia,cbdr,flout can be used to find the daily high/low.
TCM (The Currency Merchant) teaches, that a move out of the range often is a false move to trap traders into the wrong direction.

Average Variation Bands OscillatorSimilar to how a donchian% of channel helps to visualize trend and volatility, this tool helps identify those same characteristics, if the oscillator is generally above the 50 mark, it is considered to be trending upwards, and the reverse if it is generally bellow 50.
4H RangeThis script visualizes certain key values based on a 4-hour timeframe of the selected market on the chart. These values include the High, Mid, and Low price levels during each 4-hour period.
These levels can be helpful to identify inside range price action, chop, and consolidation. They can sometimes act as pivots and can be a great reference for potential entries and exits if price continues to hold the same range.
Here's a step-by-step overview of what this indicator does:
1. Inputs: At the beginning of the script, users are allowed to customize some inputs:
Choose the color of lines and labels.
Decide whether to show labels on the chart.
Choose the size of labels ("tiny", "small", "normal", or "large").
Choose whether to display price values in labels.
Set the number of bars to offset the labels to the right.
Set a threshold for the number of ticks that triggers a new calculation of high, mid, and low values.
* Tick settings may need to be increased on equity charts as one tick is usually equal to one cent.
For example, if you want to clear the range when there is a close one point/one dollar above or below the range high/low then on ES
that would be 4 ticks but one whole point on AAPL would be 100 ticks. 100 ticks on an equity chart may or may not be ideal due to
different % change of 100 ticks might be too excessive depending on the price per share.
So be aware that user preferred thresholds can vary greatly depending on which chart you're using.
2. Retrieving Price Data: The script retrieves the high, low, and closing price for every 4-hour period for the current market.
The script also calculates the mid-price of each 4-hour period (the average of the high and low prices).
3. Line Drawing: At the start of the script (first run), it draws three lines (high, mid, and low) at the levels corresponding to the high,
mid, and low prices. Users can also change transparency settings on historical lines to view them. Default setting for historical lines
is for them to be hidden.
4. Updating Lines and Labels: For each subsequent 4-hour period, the script checks whether the close price of the period has gone
beyond a certain threshold (set by user input) above the previous high or below the previous low. If it has, the script deletes the
previous lines and labels, draws new lines at the new high, mid, and low levels, and creates new labels (if the user has opted to
show labels).
5. Displaying Values in the Data Window: In addition to the visual representation on the chart, the script also plots the high, mid, and
low prices. These plotted values appear in the Data Window of TradingView, allowing users to see the exact price levels even when
they're not directly labeled on the chart.
6. Updating Lines and Labels Position: At the end of each period, the script moves the lines and labels (if they're shown) to the right,
keeping them aligned with the current period.
Please note: This script operates based on a 4-hour timeframe, regardless of the timeframe selected on the chart. If a shorter timeframe is selected on the chart, the lines and labels will appear to extend across multiple bars because they represent 4-hour price levels. If a longer timeframe is selected, the lines and labels may not accurately represent high, mid, and low levels within that longer timeframe.

SuperTrend with Chebyshev FilterModified Super Trend with Chebyshev Filter
The Modified Super Trend is an innovative take on the classic Super Trend indicator. This advanced version incorporates a Chebyshev filter, which significantly enhances its capabilities by reducing false signals and improving overall signal quality. In this post, we'll dive deep into the Modified Super Trend, exploring its history, the benefits of the Chebyshev filter, and how it effectively addresses the challenges associated with smoothing, delay, and noise.
History of the Super Trend
The Super Trend indicator, developed by Olivier Seban, has been a popular tool among traders since its inception. It helps traders identify market trends and potential entry and exit points. The Super Trend uses average true range (ATR) and a multiplier to create a volatility-based trailing stop, providing traders with a dynamic tool that adapts to changing market conditions. However, the original Super Trend has its limitations, such as the tendency to produce false signals during periods of low volatility or sideways trading.
The Chebyshev Filter
The Chebyshev filter is a powerful mathematical tool that makes an excellent addition to the Super Trend indicator. It effectively addresses the issues of smoothing, delay, and noise associated with traditional moving averages. Chebyshev filters are named after Pafnuty Chebyshev, a renowned Russian mathematician who made significant contributions to the field of approximation theory.
The Chebyshev filter is capable of producing smoother, more responsive moving averages without introducing additional lag. This is possible because the filter minimizes the worst-case error between the ideal and the actual frequency response. There are two types of Chebyshev filters: Type I and Type II. Type I Chebyshev filters are designed to have an equiripple response in the passband, while Type II Chebyshev filters have an equiripple response in the stopband. The Modified Super Trend allows users to choose between these two types based on their preferences.
Overcoming the Challenges
The Modified Super Trend addresses several challenges associated with the original Super Trend:
Smoothing: The Chebyshev filter produces a smoother moving average without introducing additional lag. This feature is particularly beneficial during periods of low volatility or sideways trading, as it reduces the number of false signals.
Delay: The Chebyshev filter helps minimize the delay between price action and the generated signal, allowing traders to make timely decisions based on more accurate information.
Noise Reduction: The Chebyshev filter's ability to minimize the worst-case error between the ideal and actual frequency response reduces the impact of noise on the generated signals. This feature is especially useful when using the true range as an offset for the price, as it helps generate more reliable signals within a reasonable time frame.
The Great Replacement
The Modified Super Trend with Chebyshev filter is an excellent replacement for the original Super Trend indicator. It offers significant improvements in terms of signal quality, responsiveness, and accuracy. By incorporating the Chebyshev filter, the Modified Super Trend effectively reduces the number of false signals during low volatility or sideways trading, making it a more reliable tool for identifying market trends and potential entry and exit points.
In-Depth Guide to the Modified Super Trend Settings
The Modified Super Trend with Chebyshev filter offers a wide range of settings that allow traders to fine-tune the indicator to suit their specific trading styles and objectives. In this section, we will discuss each setting in detail, explaining its purpose and how to use it effectively.
Source
The source setting determines the price data used for calculations. The default setting is hl2, which calculates the average of the high and low prices. You can choose other price data sources such as close, open, or ohlc4 (average of open, high, low, and close prices) based on your preference.
Up Color and Down Color
These settings control the color of the trend line when the market is in an uptrend (up_color) and a downtrend (down_color). You can customize these colors to your liking, making it easier to visually identify the current market trend.
Text Color
This setting controls the color of the text displayed on the chart when using labels to indicate trend changes. You can choose any color that contrasts well with your chart background for better readability.
Mean Length
The mean_length setting determines the length (number of bars) used for the Chebyshev moving average calculation. A shorter length will make the moving average more responsive to price changes, while a longer length will produce a smoother moving average. It is crucial to find the right balance between responsiveness and smoothness, as a too-short length may generate false signals, while a too-long length might produce lagging signals. The default value is 64, but you can experiment with different values to find the optimal setting for your trading strategy.
Mean Ripple
The mean_ripple setting influences the Chebyshev filter's ripple effect in the passband (Type I) or stopband (Type II). The ripple effect represents small oscillations in the frequency response, which can impact the moving average's smoothness. The default value is 0.01, but you can experiment with different values to find the best balance between smoothness and responsiveness.
Chebyshev Type: Type I or Type II
The style setting allows you to choose between Type I and Type II Chebyshev filters. Type I filters have an equiripple response in the passband, while Type II filters have an equiripple response in the stopband. Depending on your preference for smoothness and responsiveness, you can choose the type that best fits your trading style.
ATR Style
The atr_style setting determines the method used for calculating the Average True Range (ATR). By default (false), it uses the traditional high-low range. When set to true, it uses the absolute difference between the open and close prices. You can choose the method that works best for your trading strategy and the market you are trading.
ATR Length
The atr_length setting controls the length (number of bars) used for calculating the ATR. Similar to the mean_length, a shorter length will make the ATR more responsive to price changes, while a longer length will produce a smoother ATR. The default value is 64, but you can experiment with different values to find the optimal setting for your trading strategy.
ATR Ripple
The atr_ripple setting, like the mean_ripple, influences the ripple effect of the Chebyshev filter used in the ATR calculation. The default value is 0.05, but you can experiment with different values to find the best balance between smoothness and responsiveness.
Multiplier
The multiplier setting determines the factor by which the ATR is multiplied before being added
Super Trend Logic and Signal Optimization
The Modified Super Trend with Chebyshev filter is designed to minimize false signals and provide a clear indication of market trends. It does so by using a combination of moving averages, Average True Range (ATR), and a multiplier. In this section, we will discuss the Super Trend's logic, its ability to prevent false signals, and the early warning crosses added to the indicator.
Super Trend Logic
The Super Trend's logic is based on a combination of the Chebyshev moving average and ATR. The Chebyshev moving average is a smooth moving average that effectively filters out market noise, while the ATR is a measure of market volatility.
The Super Trend is calculated by adding or subtracting a multiple of the ATR from the Chebyshev moving average. The multiplier is a user-defined value that determines the distance between the trend line and the price action. A larger multiplier results in a wider channel, reducing the likelihood of false signals but potentially missing out on valid trend changes.
Preventing False Signals
The Super Trend is designed to minimize false signals by maintaining its trend direction until a significant change in the market occurs. In a downtrend, the trend line will only decrease in value, and in an uptrend, it will only increase. This helps prevent false signals caused by temporary price fluctuations or market noise.
When the price crosses the trend line, the Super Trend does not immediately change its direction. Instead, it employs a safety logic to ensure that the trend change is genuine. The safety logic checks if the new trend line (calculated using the updated moving average and ATR) is more extreme than the previous one. If it is, the trend line is updated; otherwise, the previous trend line is maintained. This mechanism further reduces the likelihood of false signals by ensuring that the trend line only changes when there is a significant shift in the market.
Early Warning Crosses
To provide traders with additional insight, the Modified Super Trend with Chebyshev filter includes early warning crosses. These crosses are plotted on the chart when the price crosses the trend line without the safety logic. Although these crosses do not necessarily indicate a trend change, they can serve as a valuable heads-up for traders to monitor the market closely and prepare for potential trend reversals.
In conclusion, the Modified Super Trend with Chebyshev filter offers a significant improvement over the original Super Trend indicator. By incorporating the Chebyshev filter, this modified version effectively addresses the challenges of smoothing, delay, and noise reduction while minimizing false signals. The wide range of customizable settings allows traders to tailor the indicator to their specific needs, while the inclusion of early warning crosses provides valuable insight into potential trend reversals.
Ultimately, the Modified Super Trend with Chebyshev filter is an excellent tool for traders looking to enhance their trend identification and decision-making abilities. With its advanced features, this indicator can help traders navigate volatile markets with confidence, making more informed decisions based on accurate, timely information.

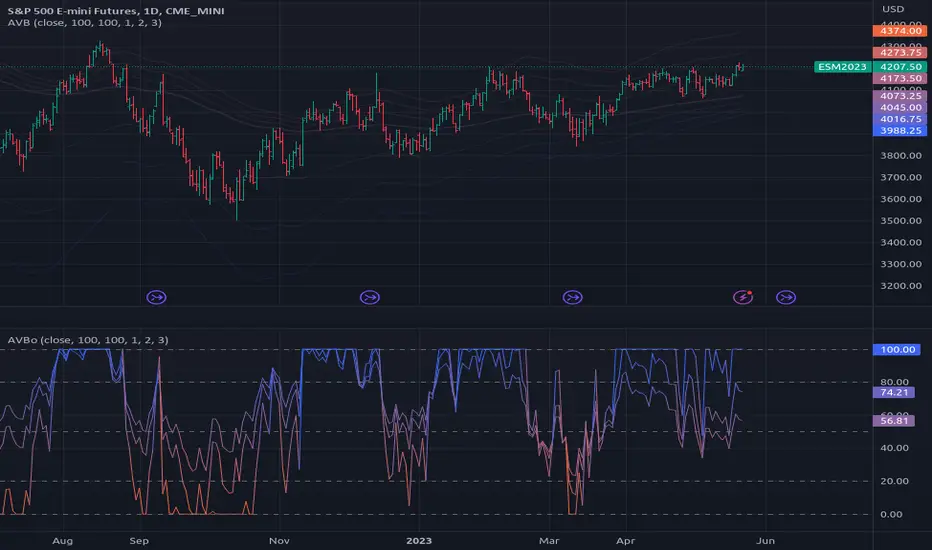
Range Sentiment Profile [LuxAlgo]The Range Sentiment Profile indicator is inspired from the volume profile and aims to indicate the degree of bullish/bearish variations within equidistant price areas inside the most recent price range.
The most bullish/bearish price areas are highlighted through lines extending over the entire range.
🔶 SETTINGS
Length: Most recent bars used for the calculation of the indicator.
Rows: Number of price areas the price range is divided into.
Use Intrabar: Use intrabar data to compute the range sentiment profile.
Timeframe: Intrabar data timeframe.
🔶 USAGE
This tool can be used to easily determine if a certain price area contain more significant bullish or bearish price variations. This is done by obtaining an estimate of the accumulation of all the close to open variations occurring within a specific profile area.
A blue range background indicates a majority of bullish variations within each area while an orange background indicates a majority of bearish variations within each area.
Users can easily identify the areas with the most bullish/bearish price variations by looking at the bullish/bearish maximums.
It can be of interest to see where profile bins might have no length, these can indicate price areas with price variations with alternating signs (bullish variations are followed by a bearish sign) and similar body. They can also indicate a majority of either bullish or bearish variations alongside a minority of more significant opposite variations.
These areas can also provide support/resistance, as such price entering these areas could reverse.
Users can obtain more precise results by allowing the profile to use intrabar data. This will change the calculation of the profile, see the details section for more information.
🔶 DETAILS
The Range Sentiment Profile's design is similar to the way a volume profile is constructed.
First the maximum/minimum values over the most recent Length bars are obtained, these define the calculation range of the profile.
The range is divided into Rows equidistant areas. We then see if price lied within a specific area, if it's the case we accumulate the difference between the closing and opening price for that specific area.
Let d = close - open . The length of the bin associated to a specific area is determined as follows:
length = Width / 100 * Area / Max
Where Area is the accumulated d within the area, and Max the maximum value between the absolute value of each accumulated d of all areas.
The percentage visible on each bin is determined as 100 multiplied by the accumulated d within the area divided by the total absolute value of d over the entire range.
🔹 Intrabar Calculation
When using intrabar data the range sentiment profile is calculated differently.
For a specific area and candle within the interval, the accumulated close to open difference is accumulated only if the intrabar candle of the user selected timeframe lies within the area.
This can return more precise results compared to the standard method, at the cost of a higher computation time.

Days in rangeThis script is a little widget that I made to do some homework on the VIX.
As you can see in the chart I was analyzing the 2008 market crash and the stats that followed it after until the market started to recover.
You can see that theory in my "Ideas" tab.
This is an interactive set of lines that you can use to count the the bars inside and outside of your chosen range, and the percentage outside that range.
You should initially enter the price range of your product in the menu and set some arbitrary dates that you can easily see on your chart.
Drag and drop the lines around to suit what price and the dates you are analyzing.
The table will display the bar count inside and outside of the range, the total bars, and the percentage outside that range.
I personally used this as a tool to study the overall average of the product, compared with the behavior during major market events.
It is currently my opinion that post 2020 analysis needs to take into account the behavior of any given product prior to 2020 when the
VIX was in its comfort zone. Not to say that a price valuation hasn't been set, but that the movement to that price was outside of "Normal Market Conditions,"
and the time factor to return to that value might be skewed. Other factors would need to be considered at that point pertaining to your specific product or corelating indicator.
I could see this tool being useful to Forex and commodities traders. But that isn't my field so that that for what it is. I do think it would perform best on something that is more
pegged to a price range. I personally would use it on product's, like the VIX, that I use as an indicator product. That is what it was designed for.
But I suppose it could be used for Mean price and time related analysis, maybe with a Vwap, SMA or other breakout style indicators.
Volume analysis might be pretty sporty. Possibly time patterns... the possibilities could be endless. Or... limited.
I am publishing this for my trade group so that it can be tinkered with to find other helpful ways to use it.
If anyone finds something interesting with other indicators, please drop a comment below and I could consider creating a script to integrate with this tool.

Range Filter x Hull SuiteRange Filter x Hull Suite
This indicator is a hybrid of two popular indicators, with a twist; namely the Range Filter (Guikroth version) and the Hull Suite (by Insilico) .
Originally developed as a 1 minute trend following strategy and traded during the New York Session for it's typically high volume / likely trending nature, it provides entry signals based on the following logic:
For bullish entry signals:
The first bullish* candle (*defined by the Range Filter bar color logic, blue by default - which is not necessarily technically a bullish candle as defined by the OHLC values) which appears after the consolidation candles (also defined by the Range Filter bar color logic, orange by default), and where the Hull Suite moving average is also bullish.
For bearish entry signals:
The first bearish* candle (*defined by the Range Filter bar color logic, red by default - which is not necessarily technically a bearish candle as defined by the OHLC values) which appears after the consolidation candles (also defined by the Range Filter bar color logic, orange by default), and where the Hull Suite moving average is also bearish.
The indicator aims to filter out signals where possible consolidation is occurring and comes with styling options and alternative filter options such as a triple moving average trend detection method. Signals can also be filtered by a specific trading session. Standard options for the Range Filter and Hull Suite settings are also able to be customised within the settings menu.
Alerts
Various alerts are built-in, including the custom entry signals unique to this strategy.
Note : The above features listed above are accurate at the time of publishing, but may be altered in future.
Many thanks to guikroth & Insilico for sharing their open source indicators, and also to the original developer of the strategy itself for sharing it.

Range of a source displayed in thirdsThis indicator will take the value of any external source input and display how it has changed over time (the lookback period in settings). For the purposes of display here I'm using the WT1 line from Wavetrend with Crosses by LazyBear to provide a source input.
The highest and lowest value of the source over the lookback period are used to determine the highest and lowest point - the green and red lines at the top and bottom of the bands. This region is then mathematically split into three, such that the source (and its optional moving average line) can be defined as being in the top third, the middle or the bottom third.
Applications for this could be in risk management where you may wish to take on a larger position size when a certain indicator is in the top third, or decide that you want to enter / leave positions when the source crosses in / out of the extreme points.

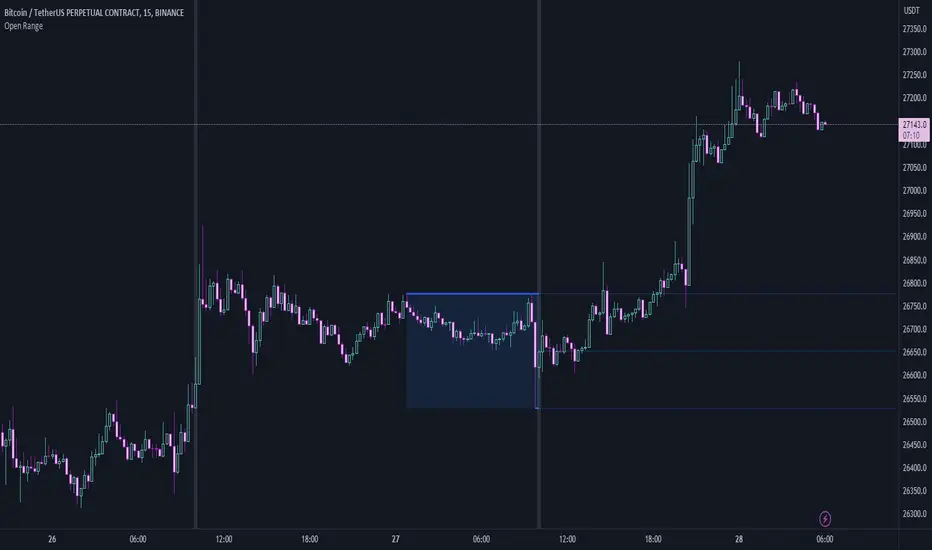
Open RangeThis is a simple script that will look back a set number of candles at a specified time (example: Ny Open) and find the "High and Low " of the range/ market in the given look back period. It will then draw two lines and the range zone as a box. Breakout traders can use these levels to help find interesting areas for a breakout. Reversal traders can use these levels to help locate false breakouts.
Simple type in your time zone Example: GMT-4
Set the time you want the indicator to draw the start line Example: 8:30am
then set the candle look back Example: 60
Hope this script helps spark some ideas
Happy trading
TradeEasy - KintroThe TradingView script provided is a custom indicator named "TradeEasy - Kintro". It is created by the author Kintro and is designed to help traders identify potential buy and sell signals in the market. The indicator is based on the Exponential Moving Average (EMA) and uses two different EMAs, one with a period of 20 and the other with a period of 50.
The indicator is meant to be used on the 5-minute timeframe and it is recommended to use TradingView in Dark Mode for better appearance. The author also reminds users that no strategy works 100% accurately and backtesting should be done before trading with a real account. The author is not responsible for any losses incurred by traders.
The indicator uses a simple set of rules to generate trading signals. The thick line on the chart represents the 50 EMA while the thin line represents the 20 EMA. When the thin line crosses upwards over the thick line, it indicates a bullish signal. After the crossover, traders are advised to wait for the price to pullback between the two lines. A range should then be created while the price moves through the thin line.
On the break of the range, an entry signal is generated, and the stop loss should be set below the range. The author advises traders to exit their profits according to their own analysis or price action and not to re-enter on the next pullback of the same trend. The same rules apply when the thin line crosses downwards over the thick line.
The author emphasizes that range creation is mandatory on crossing and that traders should not try to go against the trend. If the price is above both lines, traders should only go for buy orders, and vice versa.
If there is no range created while crossing, traders are advised not to enter the market. Traders should wait for the opportunity and not force a trade.
The indicator also includes a plot of the 34 EMA, and a range is created above and below the price action using the "up" and "down" variables. The author uses the "fill" function to color the background of the chart to highlight the range. The "dummy" variable is used to plot circles above or below the price action, depending on the trend.
In summary, the "TradeEasy - Kintro" indicator is a custom indicator designed to help traders identify potential buy and sell signals based on the crossing of two EMAs. The author provides a set of rules to generate trading signals and advises traders to wait for the opportunity and not force a trade. The indicator also includes a visual representation of the range created on the chart. As always, traders are advised to conduct their own research and analysis before entering any trades.
