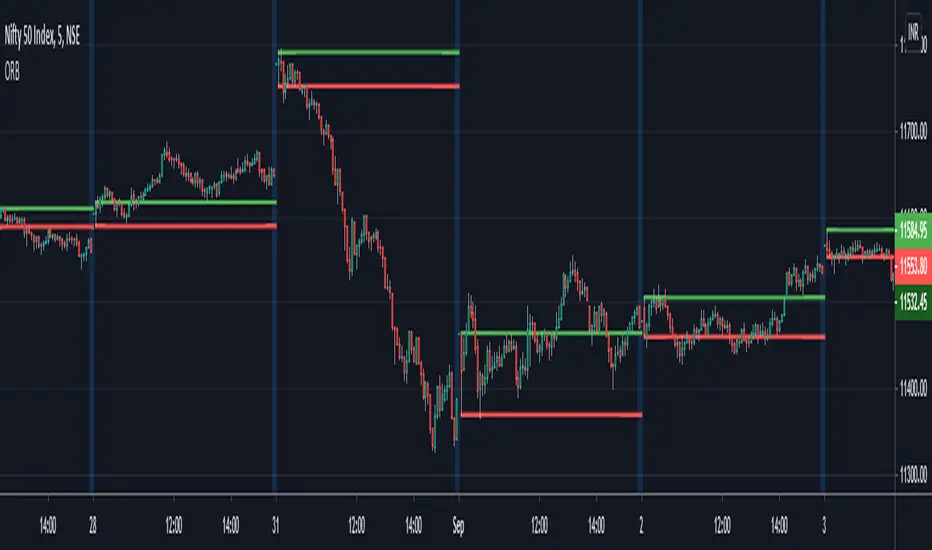
ORB - Opening Range BreakoutThis script plots the high/low of any custom session and extends it until the daily close. It does not show on the timeframe higher than the length of custom opening session by default.
The time period of opening range & the max timeframe to display it on can be adjusted from the settings.
So for eg. if want to use 5m ORB to trade, then set "ORB total time" as 5min & "Session Time" as whatever is the opening 5mins time period of ticker that are trading.
Range
ATR Daily LevelsPlots the daily ATR on the chart as upper and lower levels.
It can be use to adapt your trading in high and low periods of market volatility, determine reasonable target or take profit, entry at likely mean reversion, stop loss beyond normal flows etc...
More on the script behavior:
- Daily ATR upper/lower levels are applied on the current day low/high;
- The ATR value is defined by the last D1 bar;
- Shows up to D1 timeframe;
- Configuration for the indicator's period (default: 20 period ATR);
- Configuration for plotting the indicator on the the x axis with an offset/at begining of the day (default: offset);

Dynamic Range here comes open source version of notorious JFT Indicator ( the indicator access you can get in some bucks ) on various telegram channels however they will not give code.
Now how it works
1. 2 ranges derived from indicator are supposed to be a consolidation zone and any close above or below is supposed to give a good move.
2. I personally consider it as may be addition to price analysis. ( i don't believe much in indicators,even simple MA gives fruitful results when there is good move in market )
3. Range can be drawn on chart with various resolution ( Daily/Monthly/Weekly )
PS: I coded myself based on data analysis shown by access only indicator. In case you use it for your publication don't forget to give credits.
Thanks,
daytraderph

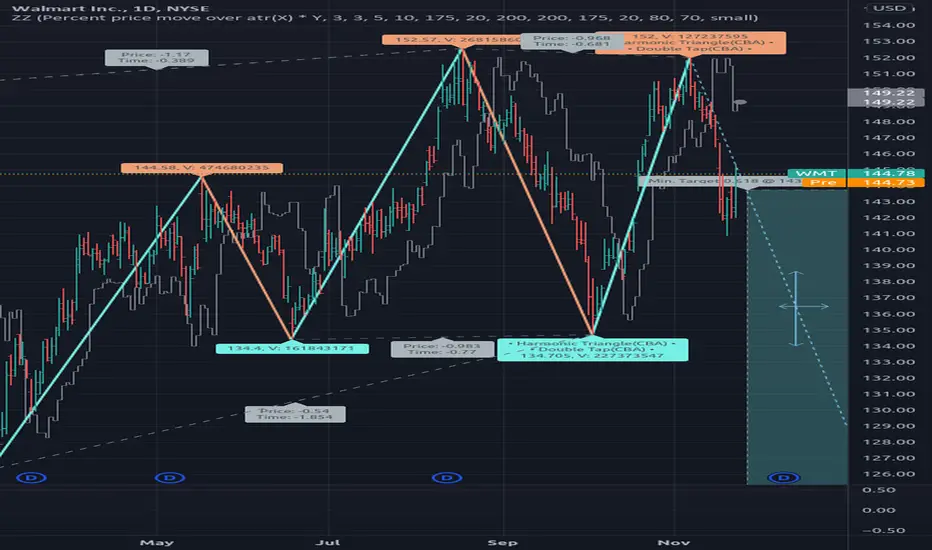
[RS]ZigZag Multiple Methods - Forecast - patterns - labelsexperimental:
zigzag indicator with all the zigzag methods that im aware of(that matter atleast), theres something for all tastes there :P
this will be the basis for zigzag tools i make in the future.
note: some zigzags REPAINT.
Hancock - Renko Brick ProductionThis is the accompanying script that shows how many renko bricks were produced in each direction per candle. It gives a basic indication of volatility, some might find it useful.
Happy trading
Hancock

Hancock - RenkoThis is the first release of Renko indicator.
Renko is plotted over candles and best calculates the number of Renko bricks printed up or down per candle which can be viewed from the data window. It plots the high and low of a the bricks, if numerous bricks are printed on a candle, as well as the open and close of a Renko brick.
This will be actively developed and improved over the next few months and i will be basing other indicators from this Renko.
Happy trading
Hancock

High & Low Of Custom Session - OpeningRange Breakout (Expo)High & Low Of Custom Session - OpeningRange Breakout (Expo) prints the high and the low of a custom session.
I use the indicator to trade the re-test of opening range (high/low) as well as breakouts from the opening range. The same logic can be applied to the session you have chosen.
HOW TO USE
1. Use the indicator to trade the re-tests of the session range.
2. Use the indicator to trade breakouts of session range.
INDICATOR IN ACTION
1-min chart
I hope you find this indicator useful , and please comment or contact me if you like the script or have any questions/suggestions for future improvements. Thanks!
I will continually work on this indicator, so please share your experience and feedback as it will enable me to make even better improvements. Thanks to everyone that has already contacted me regarding my scripts. Your feedback is valuable for future developments!
-----------------
Disclaimer
Copyright by Zeiierman.
The information contained in my scripts/indicators/ideas does not constitute financial advice or a solicitation to buy or sell any securities of any type. I will not accept liability for any loss or damage, including without limitation any loss of profit, which may arise directly or indirectly from the use of or reliance on such information.
All investments involve risk, and the past performance of a security, industry, sector, market, financial product, trading strategy, or individual’s trading does not guarantee future results or returns. Investors are fully responsible for any investment decisions they make. Such decisions should be based solely on an evaluation of their financial circumstances, investment objectives, risk tolerance, and liquidity needs.
My scripts/indicators/ideas are only for educational purposes!

[RS]Standardized Trend Mapnothing excessively new here..
a map of standardized trend over multiple lengths, extra parameter for smoothing the input source(close) will remove noise.

Range identifier by medianThis study tries to highlight ranges
as they are defined by
TradingLatino TradingView user.
The study uses median values.
A range is defined as periods when the price does not move a lot.
Its default values are aimed at BTCUSDT pair and 4h timeframe.
HOW IT WORKS
For each of the bars a '5' median is calculated based on the 'highest of open and close'
For each of the bars a '5' median is calculated based on the 'lowest of open and close'
Thanks to the desviation setting both medians
have a tolerated maximum and a minimum
Condition 1:
The bar current 'highest of open and close'
needs to be between the respective tolerated
maximum and minimum
Condition 2:
The bar current 'lowest of open and close'
needs to be between the respective tolerated
maximum and minimum
If both conditions are met
then the bar is in a range
SETTINGS
Price range periods : How many previous periods are used to calculate the medians
Price range maximum desviation (%) ( > 0 ): Maximum positive desviation for range detection
Price range minimum desviation (%) ( > 0 ): Mininum negative desviation for range detection
Desviations should be both of them a positive number
WARNING
Despite the name indicator does not identify the entire range.
It identifies when you realise you are inside a range.
E.g. If a range length is 8 periods length this range indicator
will highlight only the last 6 periods of the range.
USAGE
If your strategy signals you an upwards trend
then you might use this range detector
to know when to exit your long position
Why?
Because most of the times
the price is found to be
in a range it goes down
FEEDBACK 1
My former attempt on calculating ranges
felt too much over complex that is why
I decided to implement it with medians.
It should be easier to modify if
I want to desviation inputs to be calculated
automatically in the future.
I'm interested on different approaches on how to detect ranges.
FEEDBACK 2
I have only used this identifier in BTCUSDT 4h timeframe.
Feel free to comment down below with your suggested settings
for your favourite pair and timeframe
PINE SCRIPT TRICK
This script simulates looping an string char by char
in pine script.

Range identifier by angleThis study tries to highlight ranges
as they are defined by
TradingLatino TradingView user.
A range according to its definition would consist of
periods when the price does not move a lot.
It's aimed at BTCUSDT pair and 4h timeframe.
HOW IT WORKS
Price source is the middle between open and close values.
For each of the bars a '5' periods regression line is calculated
The regression line has an angle with the 0-axis line
which might be between 0 and 90.
0 angle would mean price is always the same
90 angle would mean price going to infinity
When '2' of those periods in a row
have their angles between a maximum angle
and a minimum angle then you have the range
SETTINGS
Price range bar periods : How many previous periods are used to calculate the bar regression line
Price range range periods : How many periods in a row should be used to say that there is a range
Price range maximum angle ( < 90.0 !!! ): Maximum angle for range detection
Price range minimum angle ( > -90.0 !!! ): Mininum angle for range detection
Angles should be set from -89.99 for the minimum angle to +89.99 for the maximum angle
WARNING
Despite the name indicator does not identify the entire range.
It identifies when you realise you are inside a range.
E.g. If a range length is 8 periods length this range indicator
will highlight only the last 6 periods of the range.
USAGE
If your strategy signals you an upwards trend
then you might use this range detector
to know when to exit your long position
Why?
Because most of the times
the price is found to be
in a range it goes down
FEEDBACK 1
I'm quite sure this range approach by comparing angles is a novel one.
I have checked Range Identifier script from TradingView LazyBear user
and it uses another approach.
I'm interested on different approaches on how to detect ranges.
FEEDBACK 2
I have only used this identifier in BTCUSDT 4h timeframe.
I'm interested to know if applying it more traditional
stocks the degrees need to be adjusted to something
more smaller.
PINE SCRIPT TRICK
This script simulates looping an string char by char
in pine script.
CREDITS
I have reused and adapted some code from
'TF Segmented Linear Regression' script
which it's from TradingView alexgrover user.

Volume DensityA group of two indicators:
The "Volume Density" shows how much volume was thrown out relative to the covered price range.
The "Volume Density Bars" shows the same, but with colour on top of the bar chart.

Multiple SuperTrends - evoSupertrend is one of the most popular and easy to use indicators out there. Here are 15 supertrends each having a different ATR multiple from price. This can be used to find ranges (often followed by a reversal) or to create a filter for fake signals.
In the input tab "Spacing" you can change the space between each supertrend, setting this to 0 would be a normal supertrend. You can also change style, color, line width and transparency all in the input tab.
Pine code tip: Change line 21 to 'true' to make editable true.
Enjoy! :)

Rolling midpointsThe script made for research purposes which plots these statistics of a given window: Mid-range (max + min)/2, Lower midpoint (mid-range + min)/2, and Higher midpoint (mid-range + max)/2.
This could be interesting when checking periods with sample size <= 0, or checking distros with srs kurtosis values.
Mean & median are also there.

Time Range StatisticsA good amount of users requested a text box showing various price statistics, the following script returns various of these stats in a user-selected range, and include classical ones such as a central tendency measurement (mean), dispersion (normalized range) and percent change, but also include less common statistics such as average traded volume and number of gaps. The script also calculates the correlation between the closing price and another user-selected instrument.
The script is currently the longest one I ever made and took some efforts, as I wasn't satisfied with the statistics to be originally included. Big thx to Gael for the enormous feedback and the idea of the normalized range, to user @Cookiecrush for the feedback ( without ya I would have posted something bad you know umu ? ), and Lulidolce for the support, friendship is magic!
Selected Range
The setting Start determine the bar at which the range starts, while End determine at which bar the range end. To help you select these values, the current bar number (bar index) is displayed at the right of the indicator title in blue.
The setting evaluate to last bar will use a range starting at Start and ending at the last bar, as such you can use a full range by using Start = 0 and select evaluate to last bar
The range is highlighted by an area on the chart. By default Start = 9000 and End = 10000, you might not have this amount of data in your chart, as such use the displayed bar index to select Start and End, then set the settings as default.
Displayed Statistics
The statistics panel is displayed on the right side of the last bar, the panel has 3 sections, a title section who shows the symbol ticker, timeframe, and overall trends represented by a chart emoji, the overall trends are determined by comparing the number of higher highs with the number of lower low.
Below are displayed the date ranges with time format: year/month/day/hour:minute.
The second section shows the general statistics. The first one is the mean, also represented by the orange line in the chart, the blue line displayed represent the highest price value in the range, while the red one represents the lowest price value.
The second stat is the normalized range, and determine how spread is the price in the user-selected range, why not the standard deviation? Because the standard deviation might return results varying widely depending on the scale of the closing price, you could get measures such as 0.0156 or 16 or even 56 depending on the instrument, as such using a normalized range can be more appropriate as it lays in a range of (0,1). Lower values indicate a low degree of price variation. Note that I still want to find another measure in the future.
The percentage change (or relative change) indicates at which percentage the price has increased or decreased, and is calculated by subtracting the closing at bar Start with the price at bar End , divided by the price at bar End , the result is then multiplied by 100.
The average traded volume calculate the mean of the volume in the selected range, I used the same format used by the original volume indicator for clarity.
Finally, the last stats of the section is the number of gaps, this stat is by default hidden. An up gap is detected when the open price is superior to the previous high, while a down gap is detected when the open price is inferior to the previous low, this allow to only retain significant gaps.
The last section of the indicator panel shows the correlation between the closing price and another instrument, by default GOOG, this correlation is also calculated within the user-selected range. Positive values indicate a positive relationship, that is the two instruments tend to move in the same direction. Negative values indicate a negative relationship, both instruments tend to move in a direction opposite to each other. Values closer to 1 or -1 indicate a stronger relationship, while values closer to 0 indicate no relationship.
In Summary
The script shows various stats, each calculated within a user-selected range, in general one would be more interested in how these stats might evolve with time, but checking them in a custom range can be quite interesting.
Thx for reading. umu

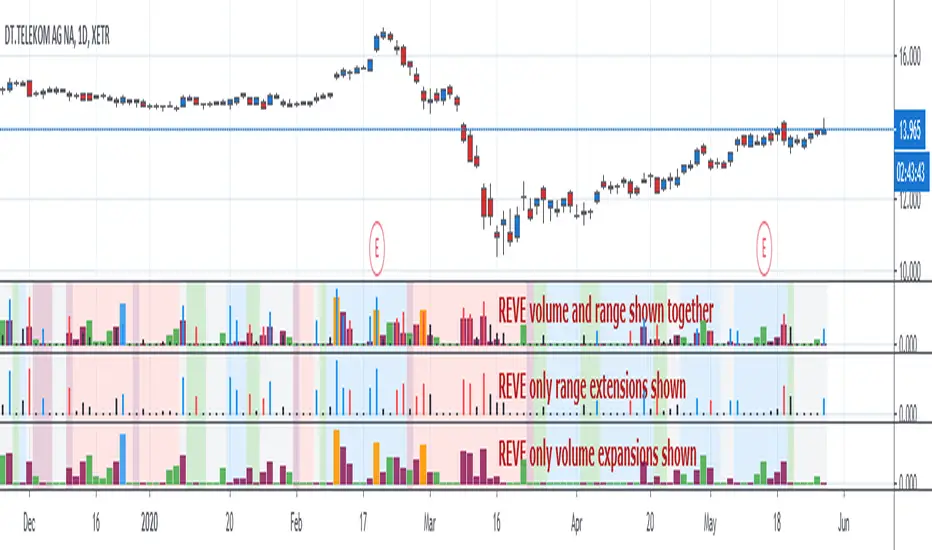
REVEREVE is abbreviation from Range Extension Volume Expansion. This indicator shows these against a background of momentum. The histogram and columns for the range and volume rises ara calculated with the same algorithm as I use in the Volume Range Events indicator, which I published before. Because this algorithm uses the same special function to assess 'normal' levels for volume and range and uses the same calculation for depicting the rises on a scale of zero through 100, it becomes possible to compare volume and range rises in the same chart panel and come to meaningful conclusions. Different from VolumeRangeEvents is that I don't attempt to show direction of the bars and columns by actually pointing up or down. However I did color the bars for range events according to direction if Close jumps more than 20 percent of ATR up or down either blue or red. If the wider range leads to nothing, i.e. a smaller jump than 20 percent, the color is black. You can teak this in the inputs. The volume colums ar colored according to two criteria, resulting in four colors (orange, blue, maroon, green). The first criterium is whether the expansion is climactic (orange, blue) or moderate (maroon, green). I assume that climactic (i.e. more than twice as much) volume marks the beginning or end of a trend. The second criterium looks at the range event that goes together with the volume event. If lots of volume lead to little change in range (blue, green), I assume that this volume originates from institutional traders who are accumulating or distributing. If wild price jumps occur with comparatively little volume (orange, maroon, or even no volume event) I assume that opportunistic are active, some times attributing to more volume.
For the background I use the same colors calculated with the same algorithm as in the Hull Agreement Indicator, which I published before. This way I try to predict trend changes by observation of REVE.
Separated ATR - evoThis script plots two ATR (Average True Range) values, one based on only bullish and the other based on only bearish bars. If the current bar is positive, the negative ATR will use its last known negative bar for the calculation. You can smooth bar directions by using the Heikin Ashi setting.
Use this the same way how you would use the regular ATR indicator, but with the added value of knowing which side of the market has more volatility.

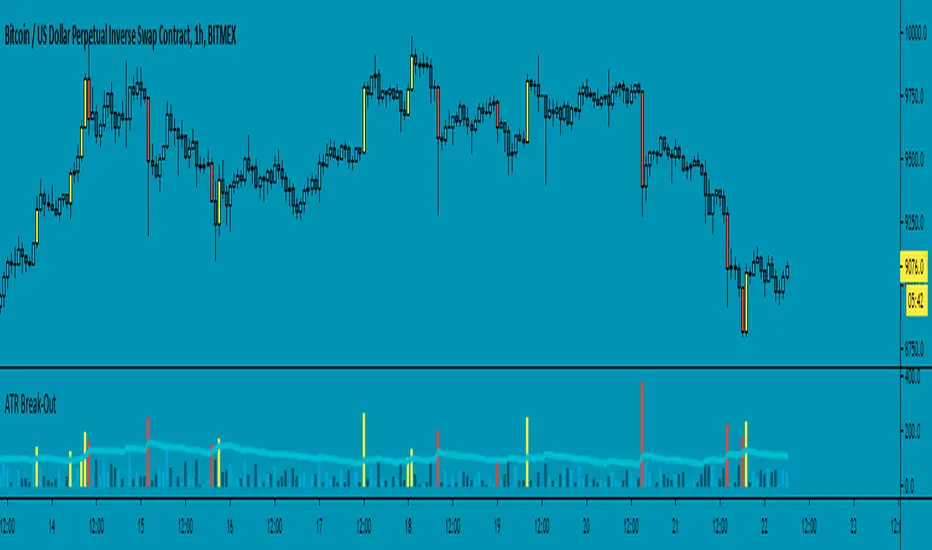
ATR Break-Out - evoThis script measures candle length and average true range (ATR). A break out occurs when a candle is larger than the given ATR value. You can choose to calculate length from wicks or from the body (open & close).
You can use this as trend direction indicator by following the last break out candle or open a position after a break out with a stop just above or below the candle. Enjoy!
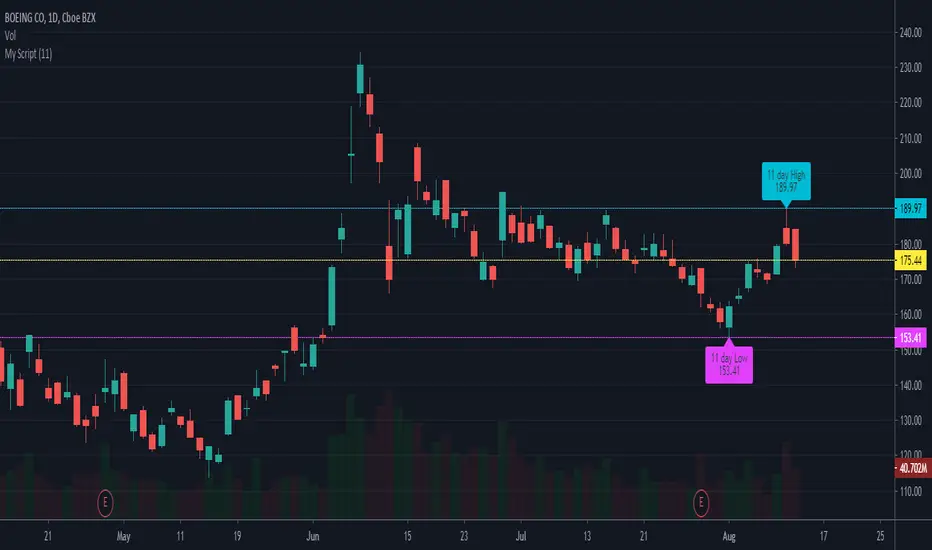
ATR Timeframe RangeThis indicator shows the ATR range on the daily or any other timeframe on your current chart. All settings are fully customize-able.

Ranged Candle Length - evoSimilar to one of my previous scripts 'Ranged Volume', but instead of using volume, this script uses candle length mirrored. It creates a range using highest and lowest of a given period. When the range gets larger, it means the current candle is bigger than the largest candle of your given period (break-out).
Yellow = Bullish break out
Red = Bearish break out
A good way to use this is to follow the direction of the last break-out candle or open a position with a stop just below or above the candle (that's how I tested it real time).
Good luck!

[FN] Session Range & Date Range For BacktestingThis has been done before in different ways, however, my goal is to publish a single, simplified copy/paste version of the idea so you can quickly and easily incorporate it into your strategy backtesting.
You can designate weekdays, weekdays + weekends for 24/7 markets, and also session range.
So, you trade bitcoin? It works. CME futures? It works. You are a discretionary trader so the only signals that matter are the ones that happen when you're awake? It works. Copy and paste.
The goal is that its that easy. You'll have to let me know if it is. glhf everyone.
If I'm not mistaken, you should be able to copy/paste this directly into your strategy script (Paste it in before your entry declarations). Just leave out the last 2 lines where the bgcolor() is declared... unless you want the background color lit up, that's up to you. It's just for demonstration purposes in this script.
After you've pasted it in, then in your strategy.entry() function you are adding: to the strategy.entry() function.
e.g:
strategy.entry("Long", strategy.long, qty=1, when = ENTRY_SIGNAL and signal_backtest())
Shoutouts to @zenandtheartoftrading and @allanster for providing the basis of this code that I put together here. We stand on the shoulders of giants.

ATR _NormalizedThis script is good to use with Williams %R indicator, to find out when price has bottomed out.
ATR has to be over 90 and Williams %R ( lenght 52 ) has to be over 95 to find out level around which one is good to buy.
You can check back, to see that this worked very well over history. Best way to use this 2 indicators is with DCA ( dollar cost average ), as area where to buy can go a little bit down and up for as long as few months. So dont just jump in, use DCA .
