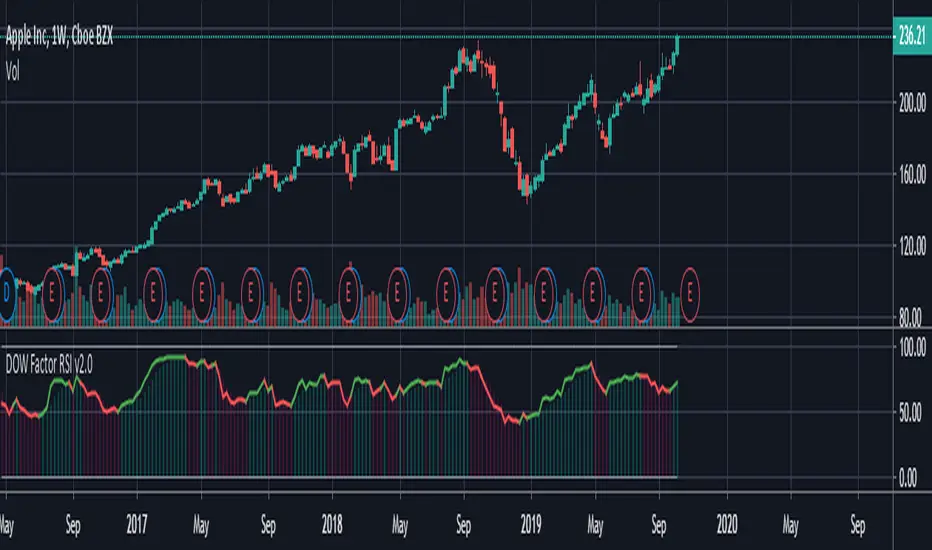
Dow Factor Relative Strength IndexThis script was written to create a new, rapid relative strength index inspired by the Dow Theory.
More info about Dow Theory : www.investopedia.com
According to the Dow Theory, volume should confirm market trends.
The correlation coefficient between prices and volume is negative in weakening trends and negative trends , positive in strengthening or positive trends.a factor was formed based on the correlation coefficient between volume and prices.
This factor was added to the relative strength index.
Period 5 is selected because the volume is very volatile and can be slow.
You can use the period you want, but I recommend the period as a minimum of 5.
It is suitable for all instruments and timeframes and thanks to its design, it provides control over gradual buying and selling points.
I haven't fully tested it, it's open to updates. For now, just use it to create ideas.
If I find it necessary,
I'll update after the tests.
If you have suggestions on these issues,
Leave your comments in the comment window.
This code is open source under the MIT license. If you have any improvements or corrections to suggest, please send me a pull request via the github repository github.com
Stay tuned , best regards.
Rsi_oversold
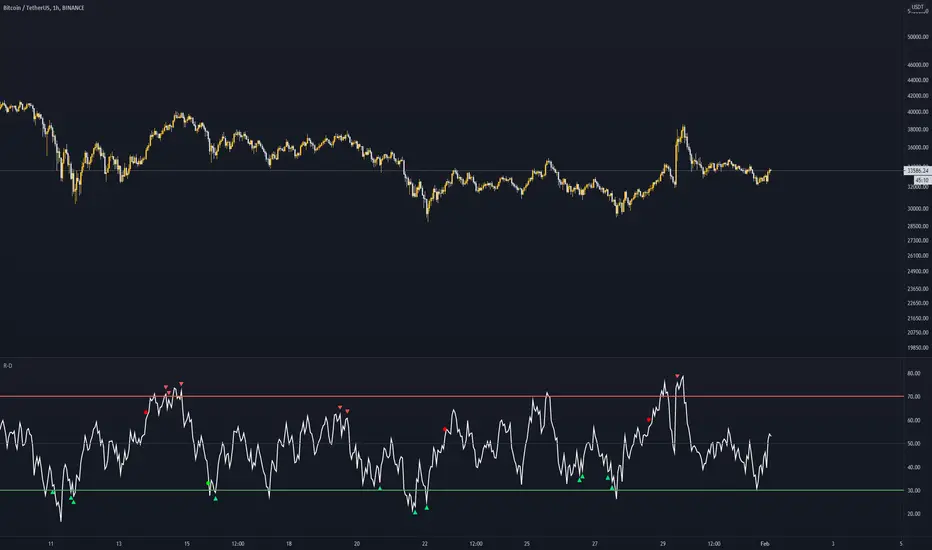
Liens Standar Rsi - Divergence Rsi Divergence
This script is signaling
Bearish Divergence
Bullish Divergence
Hidden Bearish Divergence
Hidden Bullish Divergence
Alerts for all conditions.
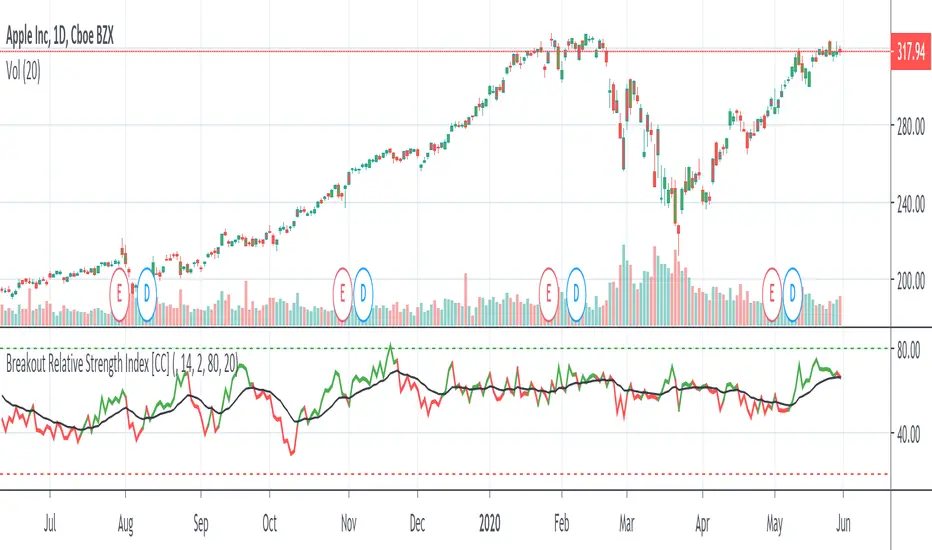
Breakout Relative Strength IndexIt isn't easy to determine if the price of a stock is about to break out. Here’s one way you can determine the relative strength of a breakout, enabling you to act early and realize higher profits.
This indicator was originally developed by Howard Wang Stocks & Commodities V. 33:09 (60–62)
BOSS Relative Strength MeterTHE BEST FOREX, STOCKS, COMMODITIES , AND CRYPTO INDICATORS FOR TRADINGVIEW.COM
The relative strength meter (RSM) is a momentum indicator that measures the magnitude of recent price changes to evaluate overbought or oversold conditions in the price of a stock or other asset.
The RSM is displayed as a color coded meter.
GREEN: Bullish Uptrend
RED: Bearish Downtrend
YELLOW: Disbursement
Highlights:
Add to any chart or time frame
Prints on the current bar in real time
DOES NOT repaint several bars after the fact
Freedom to Tune
User can change colors
Available Here: bosscripts.com
7_Day Trial: bosscripts.com

NIFTY_BANKNIFTY_RSINIFTY and Bank NIFTY index RSI 14 comparison indicator.
I often check for RSI of both index to take long or short position based on oversold rsi and overbought rsi. instead of checking in different charts i developed this indicator.

Multi-Time Frame MonitorThis script monitors the RSI on all timeframes; no matter what chart or timeframe you are viewing.
Currently it's setup with a basic Buy/Sell indicator based off of common rsi overbought and oversold levels.
You can choose to show all the data or only have the data show up when there is a buy/sell condition.
In the future, I will be adding more multitimeframe indicators to monitor. Suggestions and feedback are welcomed!

RSI Top & Bottom Warning [aamonkey]An enhancement of my RSI Bottom Indicator.
This one finds you Tops & Bottoms.
This indicator uses the RSI and prints you top & bottom warnings directly on the price chart.
The other special thing about this is that the RSI pulls the data from the weekly chart no matter on what timeframe you are on.
The preferred timeframe can, of course, be changed in the settings as well as any thresholds for tops and bottoms.
The default settings are very good for btc, but be free to try and test this indicator with different settings on different charts.

BOSS Smooth Stochastic-RSI And RSI Oscillators With Alerts THE BEST FOREX, BINARY OPTIONS, STOCK AND CRYPTO INDICATORS FOR TRADINGVIEW.COM
Our Smooth Stochastic RSI indicator and our RSI indicator all combined in one!
BACKGROUND AND BAR COLOR
Green=BULLISH
Yellow= NEUTRAL/TRANSITIONAL
Red= BEARISH
ALERTS
GET ALERTS FOR BULLISH AND BEARISH CROSSOVERS ON STOCHASTIC RSI
GET ALERTS WHEN RSI LINE IS GREEN AND RED

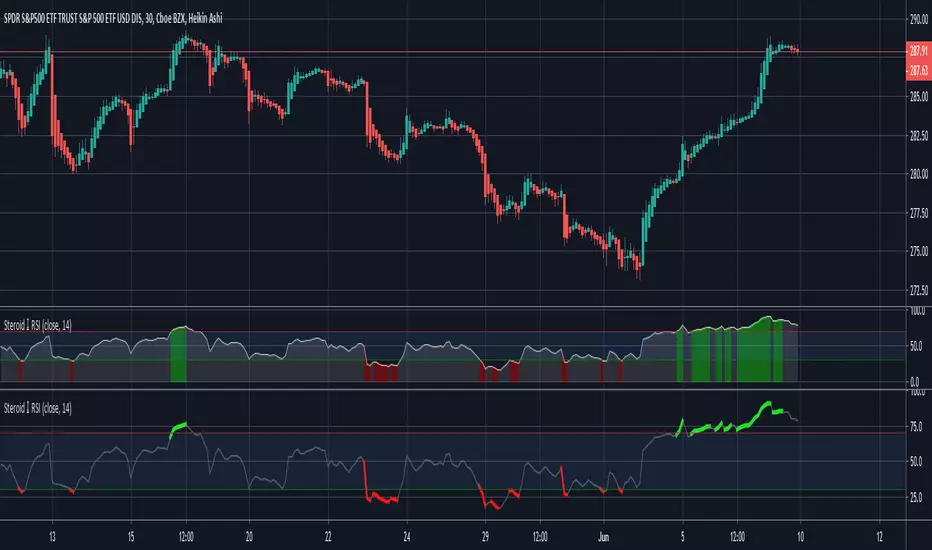
Steroid RSI w/ Overbought & Oversold Alert/@version=2
//By Tantamount
//RSI with overbought and oversold alert features! Highly configurable indicator that includes a Topography map feature, used to detect & easily show threshold crossovers.
//RSI is used to measure the velocity and change of directional price movements. It is very useful to help determine when an asset is reaching an overbought or oversold condition.
//This RSI tool comes loaded with features and is easily configurable back to standard RSI or configure with your own preferences.
Customize to your liking:
Topo map view or standard with highlighted crossover color.
If you like this tool and would like to DONATE/TIP:
Stellar XLM address: GA5XIGA5C7QTPTWXQHY6MCJRMTRZDOSHR6EFIBNDQTCQHG262N4GGKTM
Bitcoin BTC address: 3QwPUnZvAKBXBMU7WMckNgDyfv6PApYduA
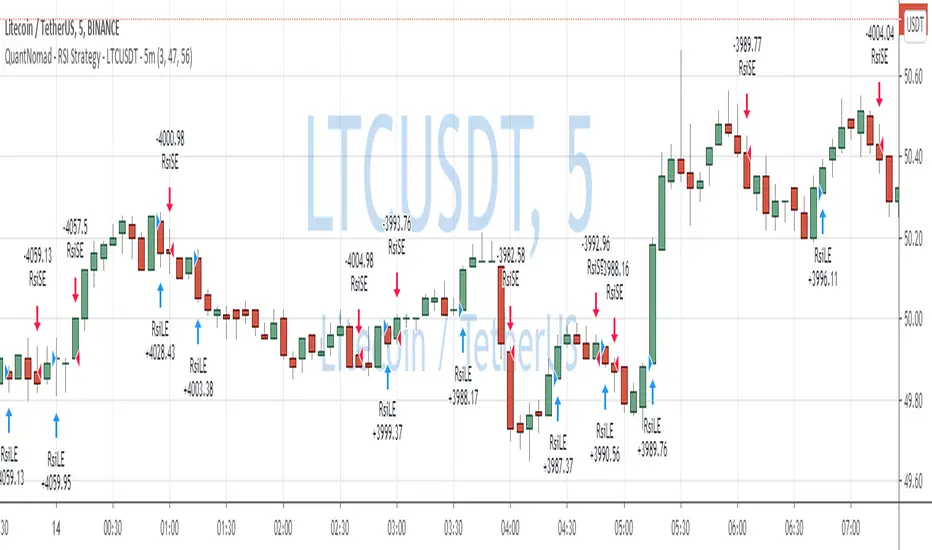
QuantNomad - RSI Strategy - LTCUSDT - 5mReally nice performance of Simple RSI Strategy for LTCUSDT ( Binance ) 5m chart.
Params: RSI Length: 3, RSI OverSold level: 47, RSI OverBought Level: 56
Performance: 391% profit, 2400 trades, 42% prof, 14.6% dd , 0.65 sharpe.
I think this strategy can be a really nice base for a pretty good strategy. We have quite a lot of trades here you can add additional filters that will improve strategy a bit.
And remember:
Past performance does not guarantee future results.
QuantNomad - RSI Strategy - NKE - 5mReally good performance of Simple RSI Strategy for Nike (NKE) 5m chart.
Params: RSI Length: 30, RSI OverSold level: 45, RSI OverBought Level: 60
Performance:57% profit, 112 trades, 73% prof, 6.7% dd, 1.36 sharpe.
And remember:
Past performance does not guarantee future results.

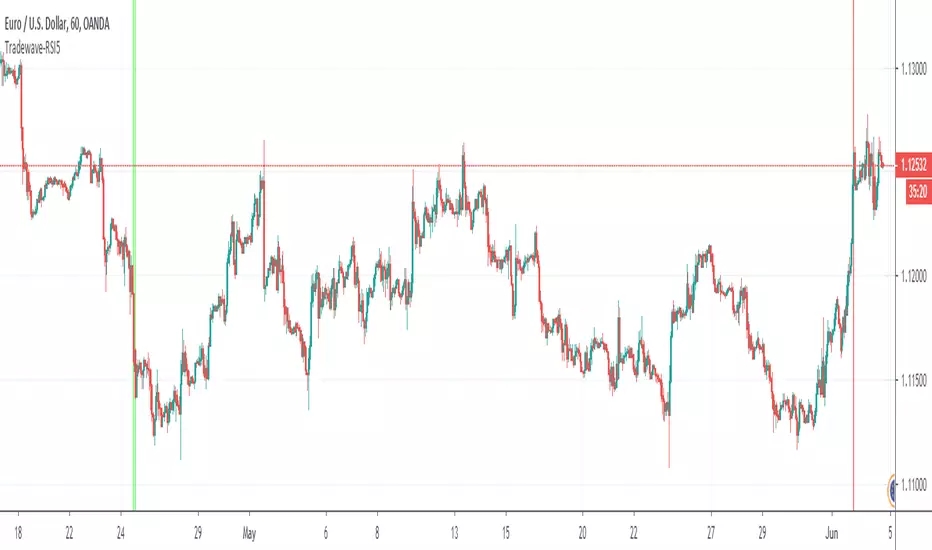
Tradewave-RSI5Calculates the Multi Time Frame RSI Overbought Oversold Conditions.
- Draws a vertical green line when RSI is oversold across 5 time frames of your choice
- Draws a vertical red line when RSI is overbought across 5 time frames of your choice.
Time frames can be modified in indicator settings.
Kozlod - RSI Strategy - 1 minute - ETHUSDTrying to find simple strategies with optimal parameters which work well for certain symbols/timeframe.
Found that basic RSI strategy without any position management works pretty good for 1m chart for BTCUSDT.
It might not work very good on it's not but can give you a pretty good base for more complicated indicators.
Also, some position management as simple as static SL and PT can improve performance quite a lot.
And remember:
Past performance does not guarantee future results.
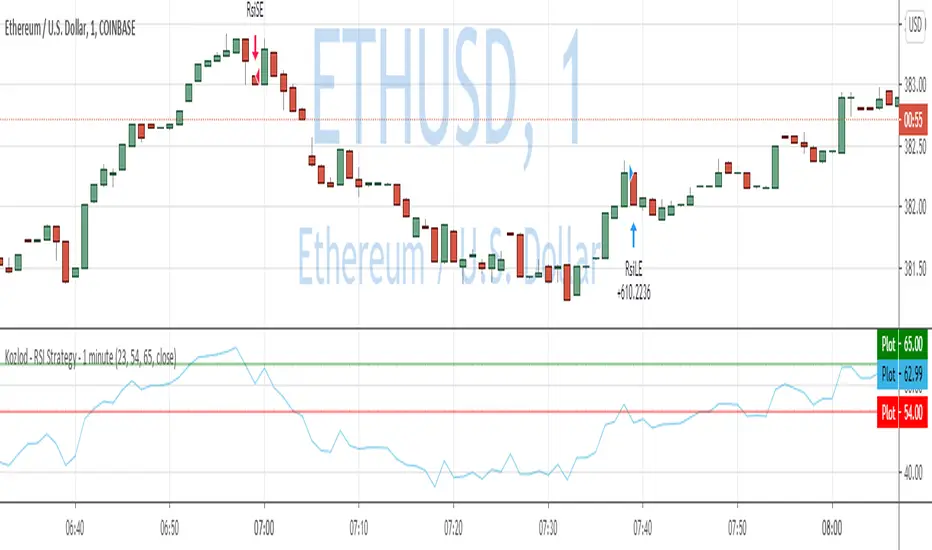
Kozlod - RSI Strategy - 1 minuteStarted to play with very simple strategies. Trying to find ones with optimal parameters which work well for certain symbols/timeframe.
Found that basic RSI strategy without any position management with high RSI length (65 in this script) works pretty good for 1m chart for few stocks.
It's also not bad for AAPL , SPY .
It might not work very good on it's not but can give you a pretty good base for more complicated indicators.
And remember:
Past performance does not guarantee future results.

~Sexy RSI~Fellow sexy traders,
Wrote this to save time from constantly having to add my own horizontals/MAs to the default RSI so I decided to make this modification.
The default settings include channels from 40-80 (green horizontals) for a bullish range, and 20-60 (red horizontals) for the bearish range.
Also includes white line at 50 level, and blue horizontals at extremes (90 and 10).
If RSI stays in one of the red or green range that can signify the trend direction, as directed by Andrew Cardwell (inventor of the RSI ).
If you wish for other levels to be included, just let me know. Comment on here or dm me on twitter @boss_charts and I might add the settings for you.
Additionally, in order to tell the level of the RSI and how overextended it might be, I added the setting for the RSI to change color depending on its level. Current settings are as follows:
Normal RSI (30-70) = PURPLE
Conventional Overbought/Oversold (30-20 + 70-80) = RED
1st extended (20-15 + 80-85) = PINK
2nd extended (15-10 + 85-90) = ORANGE
VERY EXTENDED (<10 + >90) = YELLOW
That way you can get an idea of how drastic a move is by the color alone.
Finally, there are the default MAs added that Mr. Cardwell defines as useful for defining the trend. These being the 9 MA and 45 EMA/WMA.
The strategy with these is to have the MAs on both price and RSI . If the 9MA is above the 45 MA on both price and RSI , then this is bullish and you can look for longs.
Conversely, if the 9 is below the 45 on both RSI and price that is bearish , and you can look for shorts.
I added the background color change for the points where the MAs cross each other, so you do not have to have the MAs fogging up your charts to know where they are relative to one another. This is similar to my MA cross indicator which contains the same functionality.
Never financial advice. Back test it for yourself and find MA configurations that work for you.

Sexy RSI for sexy tradersHello fellow sexy traders.
I was tired of constantly having to add my own horizontals/MAs to the default RSI so I decided to make this modification.
The default settings include channels from 40-80 (green horizontals) for a bullish range, and 20-60 (red horizontals) for the bearish range.
Also includes white line at 50 level, and blue horizontals at extremes (90 and 10).
If RSI stays in one of the red or green range that can signify the trend direction, as directed by Andrew Cardwell (inventor of the RSI).
If you wish for other levels to be included, just let me know! Comment on here or dm me on twitter @boss_charts and I can add the settings for you, so all you have to do is click a button and it will set it to your desired config. I want this to be a tool that is useful for heavy traders to save them time.
Additionally, in order to tell the level of the RSI and how overextended it might be, I added the setting for the RSI to change color depending on its level. Current settings are as follows:
Normal RSI (30-70) = PURPLE
Conventional Overbought/Oversold (30-20 + 70-80) = RED
1st extended (20-15 + 80-85) = PINK
2nd extended (15-10 + 85-90) = ORANGE
VERY EXTENDED (<10 + >90) = YELLOW
That way you can get an idea of how drastic a move is by the color alone. According to Dr. Cardwell, a drastic move to over/under extended can be a sign of strength.
Finally, there are the default MAs added that Mr. Cardwell defines as useful for defining the trend. These being the 9 MA and 45 EMA/WMA.
The strategy with these is to have the MAs on both price and RSI. If the 9MA is above the 45 MA on both price and RSI, then this is bullish and you can look for longs.
Conversely, if the 9 is below the 45 on both RSI and price that is bearish, and you can look for shorts.
I added the background color change for the points where the MAs cross each other, so you do not have to have the MAs fogging up your charts to know where they are relative to one another. This is similar to my MA cross indicator which contains the same functionality.
Never financial advice. Backtest it for yourself and find MA configurations that work for you.
Enjoy! Feel free to send feedback/requests whenever.

RSI simple Long ShortSimple indicator when RSI goes above 75 or below 25. It gives signal at next proper candle.

Combination RSI & PPO%Shows signal bullish when RSI < 30 and MACD fast is below MACD slow and MACD fast is below -0.5


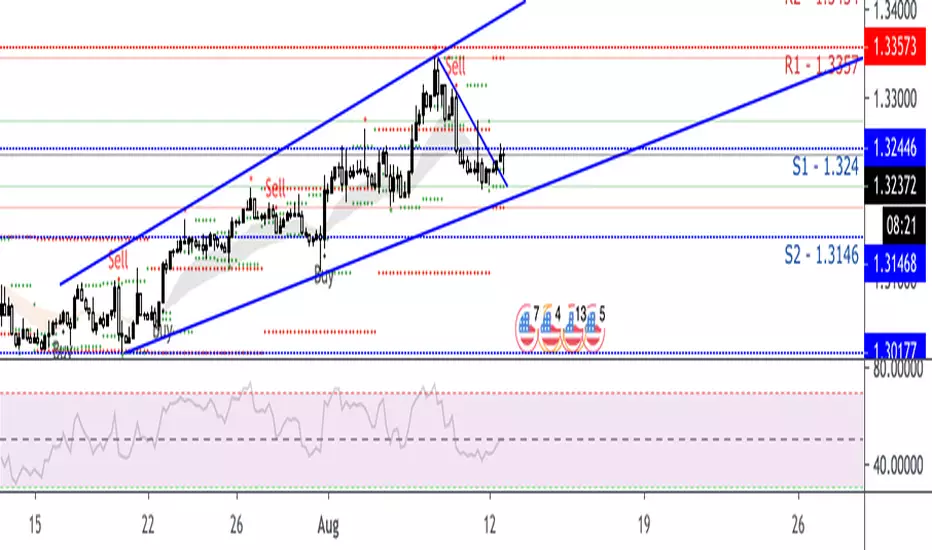
Spiky Iguana Multi RSI Bands (Reverse RSI for the Price) by RRBSpiky Iguana Multi RSI Bands by RagingRocketBull 2018
Version 1.0
This indicator shows multiple RSI Bands with prices corresponding to specified overbought/oversold RSI levels.
It is used to extrapolate the exact price levels currently matching a given set of RSI levels based on prior price/RSI levels action.
You can think of it as a reverse RSI where RSI levels are moving dynamically around the price instead of price bouncing between straight lines.
Features:
- 6+6 = 12 customizable Overbought(R)/Oversold(S) RSI Levels + 6 Mean(M) lines
- Multicolor levels/fill ranges
- Show/Hide specific S/R/M levels and fill ranges
1. uses plot*, fill and is based on RSIBANDS_LB
Good Luck! Feel free to explore and learn from the code

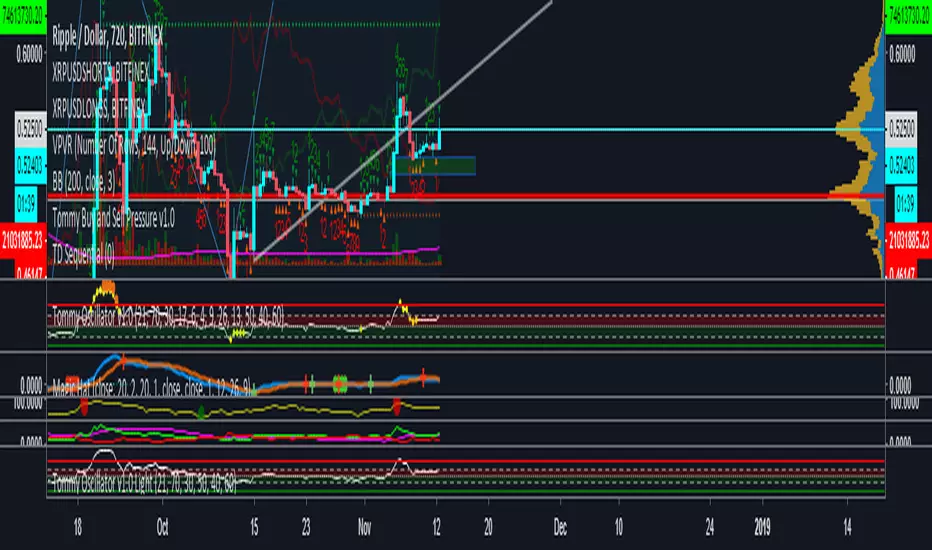
Tommy Oscillator v1.0 LightRSI rules: If we break above 70 RSI, 40-50 RSI acts as support,
If we break below 30 RSI, 50-60 RSI acts as resistance
I color coded the support/resistance areas to make visuals easier. This is part of my private indicator, but I removed the buy/sell part (which is the private part). I think this will help a lot with your guy's trading.