Renko scalp (buy/sell) indicatorThis script is based on some variations of Rocket (from Until1Mil group) scalping strategies.
It uses Renko to determine buy/sell areas.
More details can be found on my steemit page (same user as here).
Rsi_oversold

RSI StrapFollowers, this RSI is for you!
RSI Strap uses a normal Relative Strength Index (RSI) to determine what price level is in the over-bought or over-sold range.
This minimalist overlay improves the technical trading experience as indicators take up a lot of space and leave your chart area cluttered.
Change the RSI length, as well as the overbought and oversold levels in the indicator settings panel.
The default RSI length is set at 14, and the overbought and oversold levels are 70% and 30% respectively.
Happy Trading!
Find this indicator by searching "RSI Strap" in the public indicator library.
Don't forget to like!

Merge Of RSI & Stochastic RSI [salar88]This Indicator Include Stochastic RSI And Multiple Time Frame RSI
I Wish Its gonna useful for tradingview users

TTM Apollo 11 RSIColor coded RSI to give a better indication of when to buy or sell based on the RSI level along with an included EMA signal to help describe the trend.

RSI Swing SignalThis indicator is a tool designed to be used with Steven Hart's RSI Exhaustion strategy. For more information google TheTradingChannel or look him up on YouTube :)
The default RSI settings for this strategy are:
RSI Overbought: 80
RSI Oversold: 20
Length: 7
When the RSI gets above 80, the line will turn red and the script will begin looking for a specific type of engulfing candle to go short. The same is true when the RSI gets below 20, but the line will turn green and look for longs. It is best used as a back-testing aid, but it can also be used to send emails or SMS alerts whenever the conditions are met. It can also be used as an alternative colored RSI indicator by removing the signals in the settings menu and changing the RSI parameters to whatever you normally use. This can aid in RSI divergence and overbought/sold strategies.
Entries:
The bright green and bright red lines represent the first type of engulfing candle.
The dark green and red lines represent the second type of engulfing candle.
Some pairs perform best with only one of these entries, while others work fine with both.
This is a counter-trend or consolidation strategy, and is best used in combination with trend-continuation or trend-following strategies. As always, make sure you back-test it before you use it to trade as it works better on some pairs than others.

RSI buy/sell partitionsLook overbought and overbought to predict the time of the transaction.
RSI overbought:
- RSI = 21 to 30 (default configuration): The graph showing the letters 'Buy' and candles will have different colors.
- RSI < 21 (default configuration): The graph showing the letters 'Buy' displays bold and the candles will have high light background colors.
RSI oversold:
- RSI = 70 to 79 (default configuration): The chart that shows the word 'sell' and the candlestick will have different colors.
- RSI > 80 (default configuration): Display chart for 'Sell' displays bold and candles will have high light background colors.

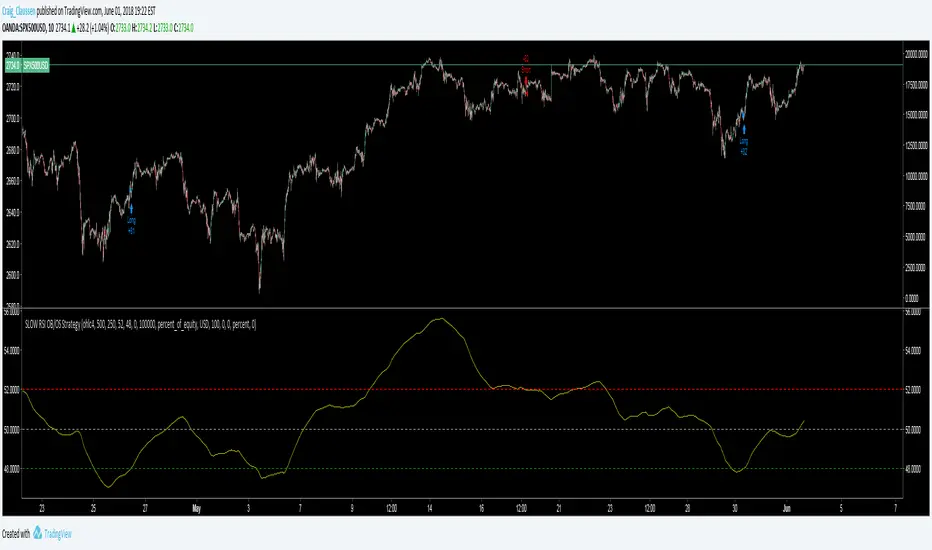
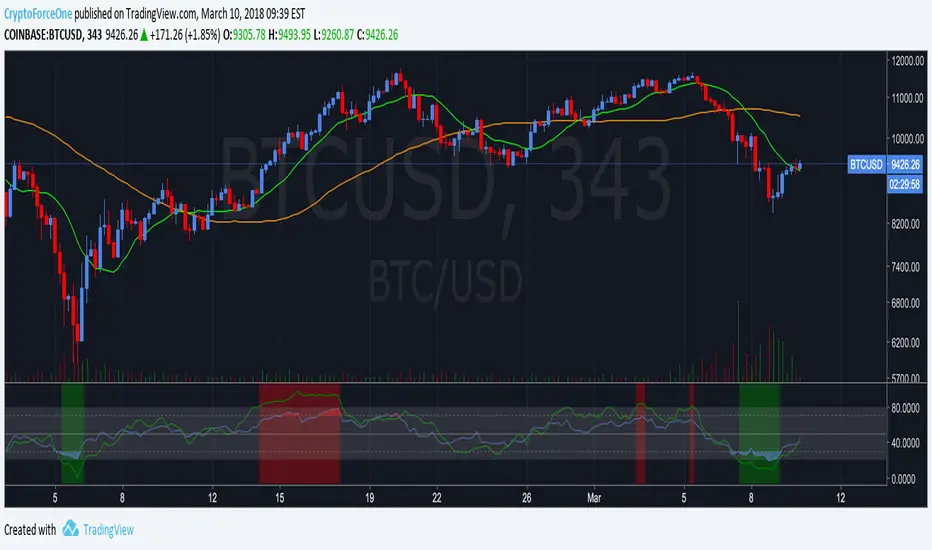
SLOW RSI OB/OS StrategySlowing the RSI down opens up a whole new world of possibilities.
This concept can work for a lot of TA indicators including the MACD.
See script source code for further description. Feel free to add pyramid trades at your own discretion in your format menu.
No this doesn't repaint!

Angelou's RSI
Hello and welcome, this is AngelouHD and this is my RSI oscillator based on RSI 14 (classic and most used by all traders).
I was studying RSI and found out that this awesome tool is very helpful, so I did more research and added some features which includes:
1 LONG signal which is that bold green pattern on the RSI (white).
2 SHORT signal which is that bold green pattern on the RSI (white).
3 Supports and resistances in most common areas such: 100, 90, 80, 70, 66, 50, 34, 30, 20, 10 and 0.
To consider:
* 100, 90, 80, 70 and 66 RSI (most of the times, my studies showed that most traders are likely to TAKE PROFITS and SELL/GO SHORT.
I found out that 100 RSI is a must, must SELL and TAKE PROFITS (overbought).
* 50 RSI is also good zone for ENTRY and BUY/GO LONG only in very bullish market, you got to be very carefull on this, so first study the market conditions: BTC bullish, book orders looking bullish, coins @ good support / resistance lines, etc. If none of the previous conditions, then don't trade and wait for lower RSI levels.
* 34, 30, 20, 10 and 0 RSI most of the times, my studies showed that most traders are likely to ENTRY and BUY/GO LONG.
I found out that 0 RSI is a must, must BUY and TAKE ACTION (oversold).
All this is just my studies and my opinion, not a finantial advice. Not always will work the way I'm explaining since this Crypto World is full of manipulation, so please take note.
LAST THING: Search on youtube and do your own research about "RSI divergences" and you will understand why sometimes even if RSI is high (overbought), let's say 70 RSI... your coin continue to go up and up and then RSI goes below 60 RSI and that coin continues to go upbullish.
And viceversa sometimes you see RSI is very low (oversold) et's say 20 RSI... your coin continue to go down and down and then RSI goes above 30 RSI and that coin continues to go bearish.
I wish you the best and I hope you take advantage, stay profitable, be careful but take action, no fear. Jesus Christ bless you all!

Xypher Heatmap RSI / STOCHCombines classic RSI and StochRSI in one script, with heatmaps for oversold and overbought zones. Use it with the black template :)
K and D values from Stoch are merged in one line, changing colors according to the bearish or bullish crossovers between them
Red to green -> Bullish crossover, consider an entry. Its signaled with a green cross
Green to red -> Bearish crossover, consider getting out. Its signaled with a green cross
RSI is plotted with a thick gray line.
Green lines indicate the oversold zone, consider an entry
Red lines indicate the overbought zone, consider an exit

2xStochastic + RSI (two levels, colored)Great tool to find market tops, bottoms, S/R's and reversals.
Rsi has 2 customiseble overbought and oversold levels can show you extreme levels.
Slow Stochastic 1 (25 period) shows small price swings
Slow stochastic 2 (100 period) can show you a greater picture, are we reversing?
Why do you need Leguerre, Murrey, Kaufman oscilator 3000 when you can have old and trusted tool, that has been tweeked very nicely for any timeframe.
I use it in a variety of ways, let me show you some examples:
EXAMPLE 1 (RSI Extreme Level):
1) Find extreme oversold or overbought level that clearly reversed and plop S/R line there. BAM! We have a S/R line
2) Next time you know this line will mean something (Either it will hold, or it will be broken by a big candle) and you can trade it accordingly to Stochastic trading strategy
EXAMPLE 2 (Fibonacci Level finder):
Trading fibo? This can help!
1) Just like fibo trading, find good swing top and bottom
2) You know that price will reverse from 38.2, 50, 61.8, but where? I think this is self explanotory...

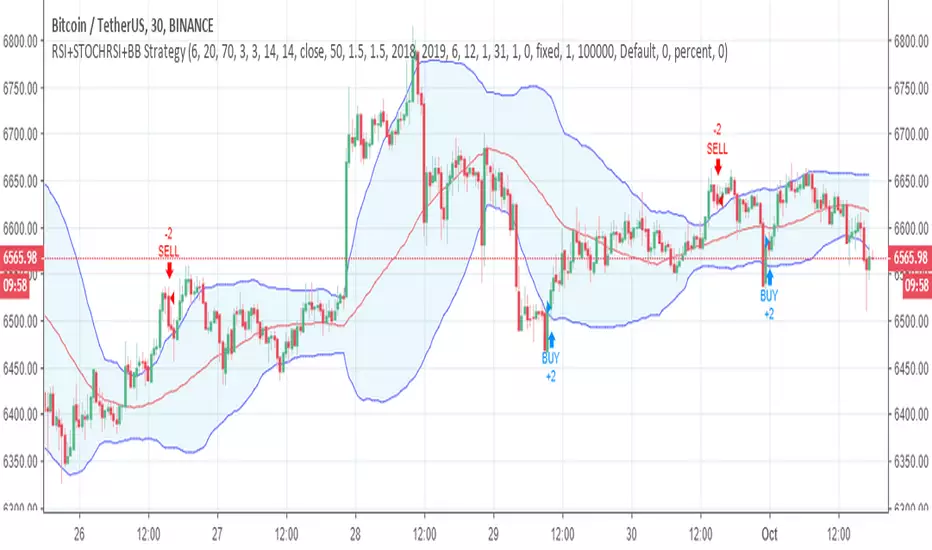
RSI + StochasticRSI overbought and oversold histogram
Just indicator combo of oldschool slow stochastic and rsi, just looking a little bit better for someone.
Strategy is simple:
1) RSI is overbought or oversold (above 70, below 30)?
2) Stochastic line crosses its ema?
3) Stochastic and stochastic ema are in overbought = sell, oversold = buy.
Works good in volitile stocks/pairs and suits for fast scalping timeframes 1m 5m 15m
Strategy is old as the books, this is just a better visual for it.

RSI Combo (RSI, StochRSI)RSI and StochRSI combination with color fill histogram if RSI is over 70 or below 30.


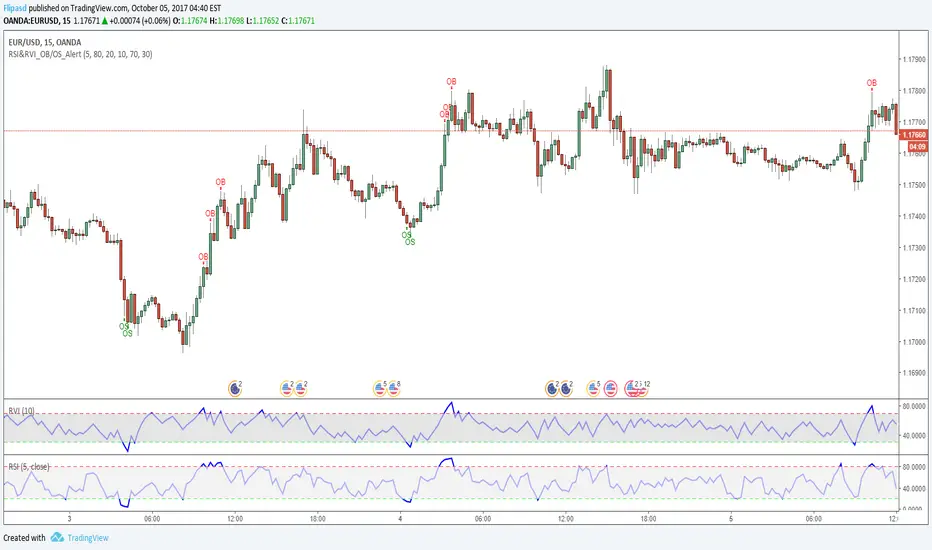
RSI & RVI OB/OS Alert ArrowThe script shows arrows on bars that are in overbought or oversold, based on the set parameters of Relative Strength Index ( RSI ) and Relative Volatility Index (RVI).
Also there is a universal allert, which includes both conditions - overbought and oversold.
You can change the period of RSI and RVI, as well as the upper and lower boundaries of these indicators.
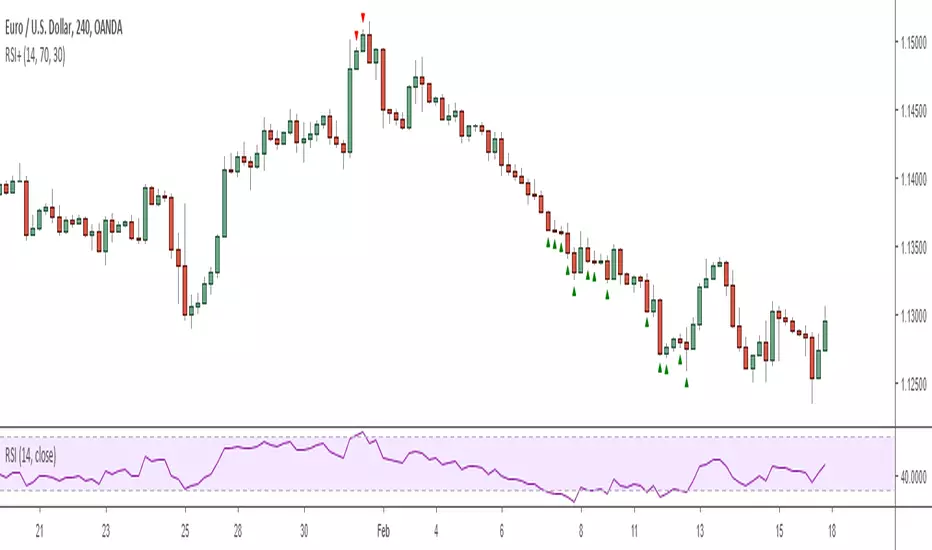
RSI+ Overbought/Sold IndicatorThis is a very simple script that plots signals on the chart whenever the RSI crosses the given threshold. Nothing fancy, but it is useful for deciding when to exit trades or prepare for pullbacks or for confirming that the market is currently in the middle of an extremely impulsive move or trend. It has alert functionality and you can set the overbought/sold thresholds and RSI length in the options menu.
Note: I definitely wouldn't recommend using it to enter trades unless you're an experienced counter-trend trader :)
Regards -
Matt.
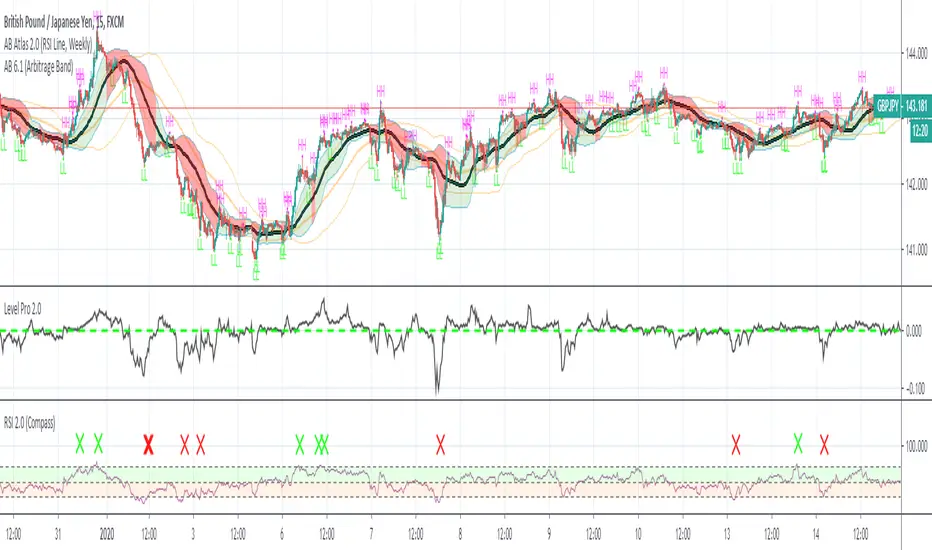
Arbitrage RSICombining the power of Arbitrage Exits formula and The Relative Strength Index we can show on the chart when is the best to exit long and short trades by placing a red X to exit long or a green X to exit short positions
As well as alert on it to further tie in with our automation provided through the Autoview plugin for chrome.
Never give back profits again!
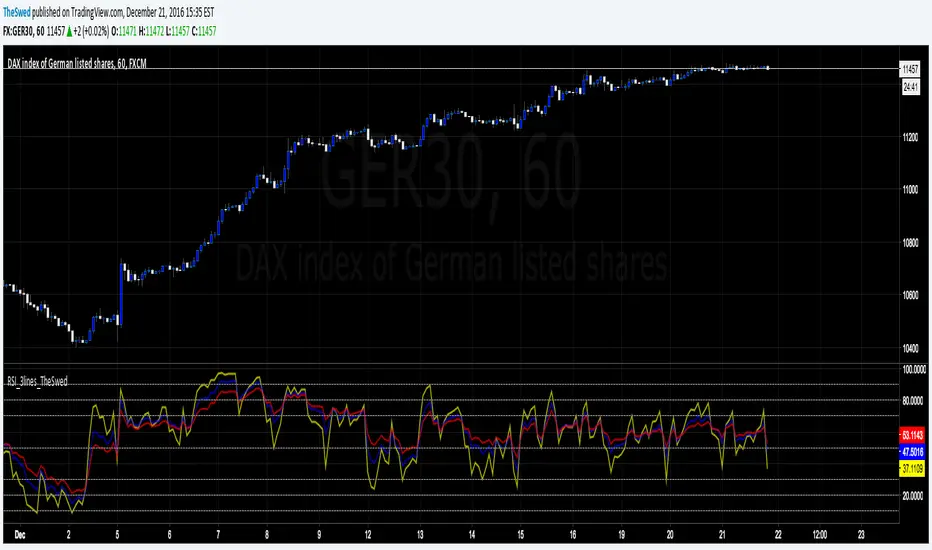
RSI_3lines_TheSwedRSI script with 3 lines. Also added lines: 90, 80, 20 and 10 to the script as I use this for trading.