BB-RSI-ADX Entry PointsThis is a combination of indicators used to find oversold and overbought entry points for possible reversion.
A Green arrow will appear when all condition are met for an ENTER LONG position.
A Red arow will appear when all condition are met for an ENTER SHORT position.
You can modify all of these condition parameters from the indicator's settings.
How does the indicator work
The signals are using Bollinger Bands , BB %B , RSI and ADX indicators to try and find points of reversal
Enter LONG Conditions
Current candle low is below BB lower band.
The BB %B is more than 0.
RSI > 30
ADX > 25
Enter SHORT Conditions
Current candle high is above BB upper band.
The BB %B is less than 1.
RSI < 70
ADX > 25
Those are the default settings that seem to work for me but you can customize all of these from the indicator settings.
I find this strategy to best work on a 3 minute timeframe
Note: The bb %B is calculated for stDev - 1. This will help you see a change happening faster.
Rsi_oversold

MTF RSI ScannerThis RSI scanner can be use to identify the relative strength of 10 symbols over multiple timeframes
it will give you a quick overview which pair is more bearish or more bullish and also signals tops and bottoms in the AVG row
light red/green cell = weak bearish (RSI = 45-35) / bullish (RSI = 55-65)
medium red/green cell = bearish (RSI = 35-25) / bullish (RSI = 65-75)
dark red/green cell = strong bearish (RSI <= 25) / bullish (RSI >= 75)
gray cell = neutral (RSI= 45-55)
Usage
If AVG (average of all 4 timeframes) falls below 30, the cell will get green, indicating a good time to enter long (buy)
If AVG (average of all 4 timeframes) rises above 70, the cell will get red, indicating a good time to enter short (sell)
Use the "MTF RSI Scanner" in combination with the "MTF Stochastic Scanner"
to find tops (RSI MTF avg >=70 AND Stochastic MTF avg >= 80)
or bottoms (RSI MTF avg <= 30 AND Stochastic MTF avg <= 20)
Here is how the two MTF scanners looked on Nov 08 2021 (ATH) »
and here how the MTF scanners looked on June 21 2022
use TradingViews Replay function to check how it would have worked in the past and when not.
As always… there NOT a single indicator that can show to the top & bottom 100% every single time. So use with caution, with other indicators and/or deeper understanding of technicals analysis ☝️☝️☝️
Settings
You can change the timeframes, symbols, RSI settings, overbought/oversold levels and colors to your liking
Drag the table onto the price chart, if you want to use it as an overlay.
NOTE:
Because of the 4x10 security requests, it can take up to 1 minute for changed settings to take effect! Please be patient 🙃
If you have any idea on how to optimise the code, please feel free to share 🙏
*** Inspired by "Binance CHOP Dashboard" from @Cazimiro and "RSI MTF Table" from @mobester16 ***

Rainbow Oscillator The Rainbow Oscillator is a technical indicator that shows prices in overbought or oversold areas. That allows you to catch the price reversal point.
---------------
FEATURES
---------------
.:: Dynamic levels ::.
The indicator levels are divided into several zones, which have a fibonacci ratio. Zones determine the overbought/oversold level. Blue and green level zones are better for buying, red and orange for selling. Dynamic levels are used as replacements for classic levels such as -100 and 100 for the CCI indicator or 30 and 70 for the RSI indicator. Dynamic levels work much better than static levels, as they are more adaptive to the current market situation.
.:: Composite oscillator (3 in 1) ::.
The main signal line of the indicator includes all three oscillators RSI, CCI, Stoch in different ratios. In the settings, you can change the proportions or completely remove one of the oscillators by setting its weight to 0
.:: CCI + RSI + Stoch ratio setting ::.
Each of the oscillators has its own weight in the calculation formula: w2 * cci ( + w1 * ( rsi - 50) + (1 - w2 - w1) * ( stoch - 50), this allows you to create the resulting oscillator from all indicators, depending on the weight of each of them. Each weight value must be between 0 and 1 so that the sum of all weights does not exceed 1.
.:: Smoothing levels and lines of the oscillator ::.
Smoothing the oscillator readings allows you to filter out the noise and get more accurate data. Level offset allows you to customize the support for inputs.
.:: Market Flat ::.
Dynamic creation of levels allows you to find in the price reversal zone, even when the price is in a flat
.:: Sources ::.
You can change the data source for the indicator to the number of longs and shorts for the selected asset. For example, BTCUSDLONGS / BTCUSDSHORTS is perfect for Bitcoin, then the oscillator will work on this data and will not use the quote price.
.:: Trend Detection ::.
The main line of the oscillator has 2 colors - green and red. Red means downtrend, green means uptrend. Trend reversal points are most often found in overbought and oversold zones.
.:: Alerts ::.
Alerts inside for next events: Buy (blue point) Sell (red point) and TrendReversal (change line color)
----------------
TRADING
—-------------
There are several possible entry points for the indicator, let's consider them all.
1) Trend reversal.
Long entry: The indicator line is in the green zone below 0 (oversold), while the line changes color from red (downward) to green (upward)
Short entry: The indicator line is in the red zone above the 0 (overbought) mark, while the line changes color from green to red.
2) Red and blue dots.
Long entry: Blue dot
Short Entry: Red Dot
I prefer to use the first trading method.
----------------
SETTINGS
----------------
.:: Trend Filter (checkbox) ::.
Use trend confirmation for red/blue dots. When enabled, the blue dot requires an uptrend, red dot requires downtrend confirmation before appearing.
.:: Use long/shorts (checkbox) ::.
Change formula to use longs and shorts positions as data source (instead of quote price)
.:: RSI weight / CCI weight / Stoch weight ::.
Weight control coefficients for RSI and CCI indicators, respectively. When you set RSI Weight = 0, equalize the combo of CCI and Stoch , when RSI Weight is zero and CCI Weight is equal to the oscillator value will be plotted
only from Stoch . Intermediate values have a high degree of measurement of each of the three oscillators in percentage terms from 0 to 100. The calculation uses the formula: w2 * cci ( + w1 * ( rsi - 50) + (1 - w2 - w1) * ( stoch - 50),
where w1 is RSI Weight and w2 is CCI Weight, Stoch weight is calculated on the fly as (1 - w2 - w1), so the sum of w1 + w2 should not exceed 1, in this case Stoch will work as opposed to CCI and RSI .
.:: Oscillograph fast and slow periods ::.
The fast period is the period for the moving average used to smooth CCI, RSI and Stoch. The slow period is the same. The fast period must always be less than the slow period.
.:: Oscillograph samples period::.
The period of smoothing the total values of indicators - creates a fast and slow main lines of the oscillator.
.:: Oscillograph samples count::.
How many times smoothing applied to source data.
.:: Oscillator samples type ::.
Smoothing line type e.g. EMA, SMA, RMA …
.:: Level period ::.
Periodically moving averages used to form the levels (zone) of the Rainbow Oscillator indicator
.:: Level offset ::.
Additional setting for shifting levels from zero points. Can be useful for absorbing levels and filtering input signals. The default is 0.
.:: Level redundant ::.
It characterizes the severity of the state at each iteration of the level of the disease. If set to 1 - the levels will not decrease when the oscillator values fall. If it has a value of 0.99 - the levels are reduced by 0.01
each has an oscillator in 1% of cases and is pressed to 0 by more aggressive ones.
.:: Level smooth samples ::.
setting allows you to set the number of strokes per level. Measuring the number of averages with the definition of the type of moving averages
.:: Level MA Type ::.
Type of moving average, average for the formation of a smoothing overbought and oversold zone

RSI CandlesRSI Candles
HOW Does it work ?
* RSI - Relative Strength Index is a very well known to understand the trend strength, Many researches have been done on RSI.
* The Indicator defines itself as the Candles are formed of RSI Value of Defined Length and Chart Time Frame.
RSI Candles comprises of following --
* Candles formed from RSI value.
* Predefined Moving average limited line for breakout.
* Up Trend Area, Down Trend Area, Consolidation Area when RSI is in-between 55 to 45.
User Inputs --
# User can change length of RSI.
# Over Bought / Sold values can be changed.
How to learn the trend ?
# Time Frame shall be more than 2 min. for better outcome.
# If the market is below the line then look for falling in RSI and one can learn the down trend.
# Over bought / Over sold be clearly seen in chart so trend reversal can be grabbed.
# The data for the indicator will be very restricted, most of the parts in indicator wont work when the market closes.
# Pre-Opening or Post -Market data is tried to be ignored.
# Utmost Care is taken to implement the suggestions of users and also tried to keep the chart neat and clean.
Disclaimer
# The indicator to be used for understanding / learning the markets.
# User is responsible for his / her profits / losses, that may occur during the markets.

RSI Supply / Demand ZonesLines plotted for the Low and High of the region of price that was Overbought or Oversold
(Low of the candle that became overbought and highest high in the Overbought period)
(High of the candle that became oversold and highest high in the Oversold period)
I like to use the dotted lines as pivot points for the reversal of the trend, and also pay attention to small tops and bottoms (normal lines) that form in strong trends, as they usually make for brief periods of acummulation/distribution before the continuation of the strong trend.

RSI with Divergences, Reverse Formulas, and Bull/Bear ZonesRegular RSI indicator that can underline divergences, turn green or red specifying user specified bull/bear zones, and with a label showing the price needed to turn bull/bear!
Specify the inputs:
+ RSI Length
+ Bull Threshold
+ Bear Threshold
+ Panel Position Offset
Also with toggle-able:
+ Bullish Divergence
+ Bearish Divergence
+ Hidden Bullish Divergence
+ Hidden Bearish Divergence
The zones included in the indicator are default and not meant to be used for all markets. The goal is to alter the bull/bear zones to find good breakout points and selloff points for your chosen security. Does not currently support automatic zone creation, or saving zones for each security (if that is even possible, may just need to create different layouts for each security).
Thanks!

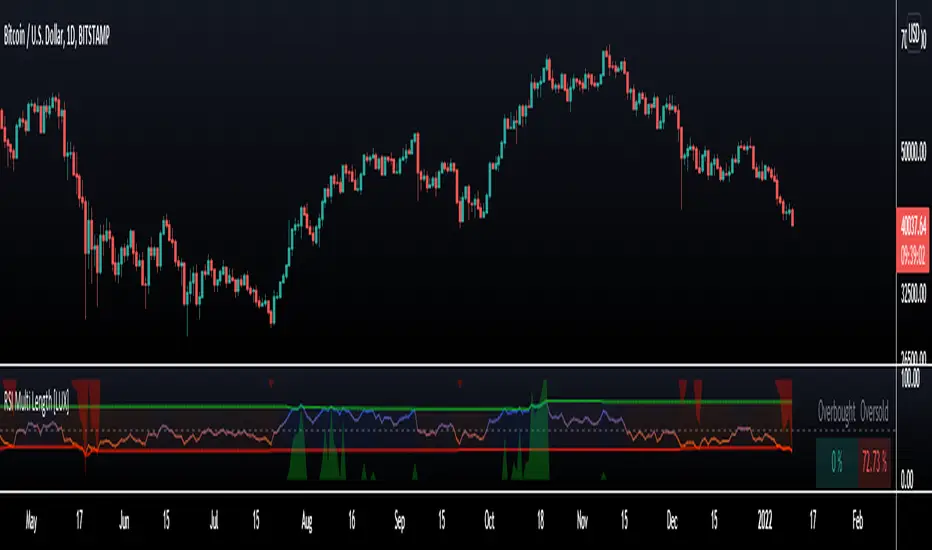
RSI Multi Length [LuxAlgo]The following indicator aims to return information over RSIs using multiple periods, including the percentage of RSIs of different periods being overbought/oversold, as well as the average between these multiple RSIs.
The percentage of RSIs of different periods being overbought/oversold is additionally used to return adaptive overbought/oversold levels.
Settings
Maximum Length: Maximum period of the RSI used for the indicator calculation
Minimum Length: Minimum period value of the RSI used for the indicator calculation
Overbought: Value of the overbought level
Oversold: Value of the oversold level
Src: Input source of the indicator
Usage
The main element of the indicator is given by the multi-length RSI average, returning an oscillator similar to a fixed-length RSI. Because of its multiple length nature, the indicator can reflect shorter to longer-term price variations depending on the Maximum/Minimum length range defined by the user.
The green area indicates the percentage of RSIs over the user-defined overbought level. The red area indicates the percentage of RSIs under the user-defined oversold level, this percentage is inverted for ease of visualization. Additionally, a dashboard at the top right of the indicator pane indicates these percentages for the most recent bar.
A lower percentage of overbought/oversold RSIs can indicate a potential shorter-term retracement.
These percentages are used to construct adaptive overbought/oversold levels for the average multi-length RSI. The overbought level will be easier to reach if the percentage of overbought RSI's is high, the same logic applies to the adaptive oversold level.
RSI DINGUE - 3³ DivergenceThis is the updated version for PineScript V5
3x RSI indicator into 1. You can turn on or off all of them.
Each RSI has 2 individual Moving Averages that can also be changed to be "Full RSI" in the settings.
This makes 3x3 = 9 indicators on screen at the same time. (you can turn them on or off)
It has Bullish and Bearish divergence and hidden divergence as well.
Several visual options to show crosses between RSIs and or MAs fill in colors, background colors, midline. Overbought and Oversold levels with signals when entry and exit.
---------------------
In closing, no indicator can give perfect signals, you need to use them in conjunction with other information to make better decisions.
I hope you like my indicators and that they help your trading.
If you have any questions please ask.
Thank you.

RSI Overbought Oversold Divergence Strategy w/ Buy/Sell SignalsThis indicator is a copy of my RSI Overbought/Oversold Divergence Indicator with-Alerts
Only difference is that the alerts are disabled, instead it uses tradingviews strategy tester signals
If you want alerts just use the other indicator

NEXT RSIThis is an amped-up version of the original Relative Strength Index (RSI) oscillator, giving the slope a smoother, sometimes leading edge. Our not-so-secret sauce within the algo is price/volume weighing, completely user configurable. NEXT RSI is intended to be used just like the vanilla RSI within the context of technical analysis: identifying overvalued (above upper limit) and undervalued (below lower limit) price action, as well as establishing a bias baseline (bullish if over 50; bearish if under 50). Higher NEXT RSI bottoms compared to lower price bottoms signify bullish divergence; lower NEXT RSI tops compared to higher price tops signify bearish divergence.
Below is a screenshot comparing NEXT RSI with default settings to vanilla RSI on AAPL M1 chart.
Input parameters:
Length: controls the averaging length of the RSI line.
P/V Weighing: a price/volume smoothing filter, with higher values yielding a smoother RSI line. Values over 10 can introduce lag but also help identify trend. We thought 5 was a pretty good momentum gauge (strengthening, weakening).
P/V Source: this variable is where you can get creative and blend volume with either direct price action (close, H+L/2, etc.) or other indicators such as moving averages, stochastic oscillator, and even the vanilla RSI.

OGT RSI MTF IndicatorThe OGT RSI MTF Indicator allows you to see when the RSI is overbought/oversold on multiple timeframes simultaneously.
Indicator settings
You have the ability to customise the RSI period as well as the OB/OS levels. What sets this indicator apart is that it you can select the timeframes which the RSI is OB/OS.
How is this displayed on the chart, and how can I make money with this indicator?
One of the most popular applications of the RSI indicator is that it can be used as a reversal signal when an instrument comes out of OB/OS. You can stack the odds in your favour when multiple timeframes are OB/OS at the same time which can have a higher probability of a pullback.
When the selected timeframes are OB, shaded red lines will appear. This indicates that a possible reversal to the downside is coming and you may want to look for a short position or closing an open position.
When the selected timeframes are OS, shaded green lines will appear. This indicates that a possible reversal to the upside is coming and you may want to look for a short position or closing an open position.
There is also a handy visible grid which shows the current RSI values for the selected timeframes.
The RSI MTF indicator combined with regular divergence and/or support & resistance can be a powerful trading strategy.

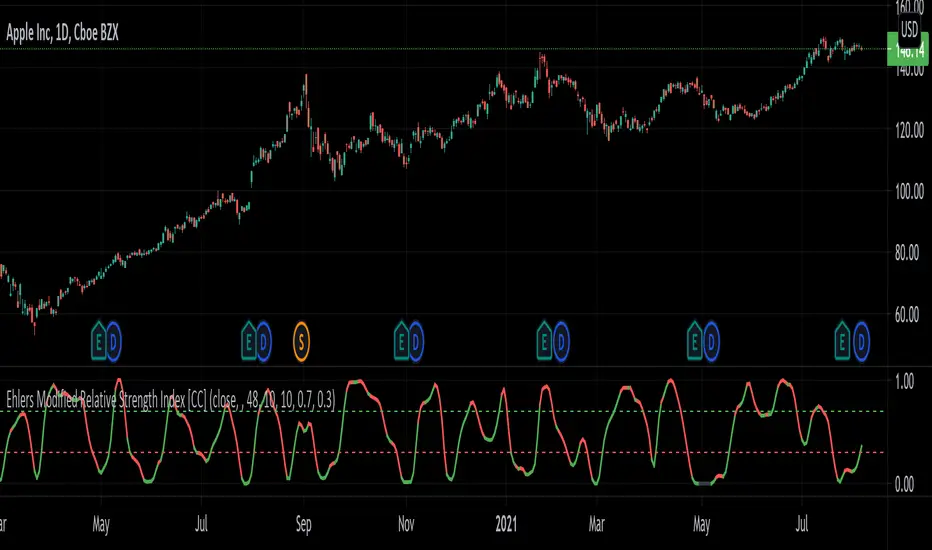
Ehlers Modified Relative Strength Index [CC]The Modified Relative Strength Index was created by John Ehlers (Cycle Analytics For Traders pgs 87-88) and this is a typical RSI that uses his roofing filter as the input. He smooths it with his own super smoother filter to provide signals. This indicator is extremely reactive and works in cycles so keep that in mind. I haven't been able to come up with clear buy and sell signals at this point so let me know if you any suggestions but I'm publishing the code to complete my goal of publishing all of his work one day. I will be publishing a bunch of Ehlers scripts in the next few weeks so stay tuned. What I recommend for buy and sell signals at this point are to buy when the indicator goes below the oversold line and starts going up and sell when the indicator goes below the oversold line a second time. Vice versa for sell signals.
Let me know if there are any other scripts you would like to see me publish!
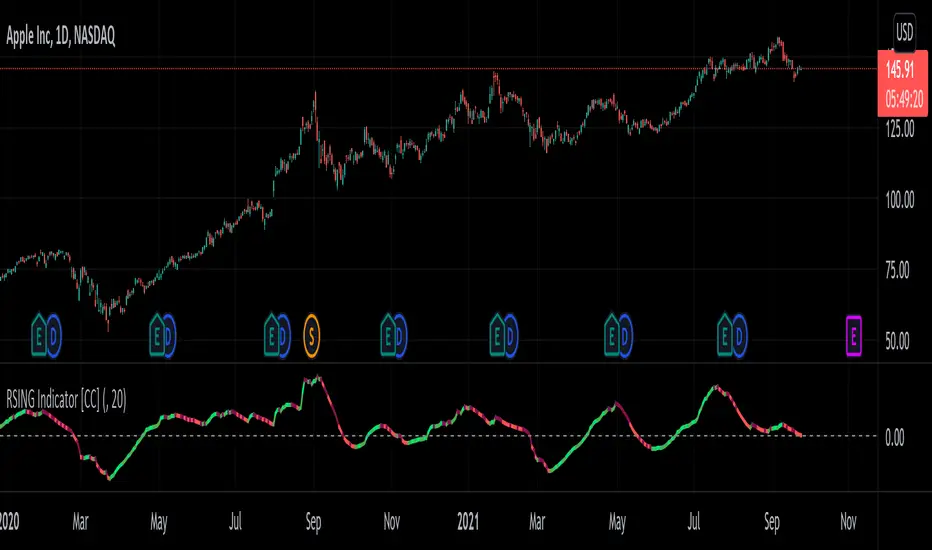
RSING Indicator [CC]The RSING indicator was created by Alon Horesh (Stocks & Commodities March 2021 pg 11) and this aims to be a better version of rsi that adapts to volume as well as a focus on overall strength. This is trying to fix the issues with the traditional RSI with a lack of volume and the issue where you could have the indicator stay in overbought or oversold territory but the upward or downward momentum continues. This indicator takes ratios of the current volume to it's moving average, the overall momentum of the stock, and the current range in comparison to the std deviation of it's past range and multiplies them all together to create this new indicator. I smooth it with a moving average for easier to read buy and sell signals. I have included strong buy and sell signals as darker colors and normal buy and sell signals as lighter colors. Buy when the line turns green and sell when it turns red.
Let me know if there are any other indicators you would like to see me publish!
Inverse Fisher Transform on RSI for backtest w/alertsThis version of the Inverse Fisher Transform on RSI comes with support for
1) Backtesting with Gavin's backtest script
2) Bypass, you can use another indicator to pause buy signals from this indicator. Just create another indicator that plots "1" whenever you want to activate the bypass on the IFTRSI signal.
3) Independent buy and sell level thresholds. Some tokens perform better with a higher sell level, even levels as high as 0.996, sometimes the buy level can also be relaxed to even 0.6 and get incredible results on the 5 minute chart.
4) alerts for Buy and Sell signals
Make sure you add Gavin's backtest and select external signal and this indicator as the source.

SB Master Chart v5 (Public)SB Master Chart v5 is the latest progression of the SB Master Chart series of charts.
The original SB Master Chart and its successors was designed to be a visual aid for the savvy investor. The original concept was designed to provide valuable information so decisions could be made at a glance with utmost confidence.
As the chart progressed through versions, it has slowly shifted the responsibility of decision making from the trader to the indicator. In this version of the script, we have updated the backend decision code. The script has 3 distinct personalities coded to compliment each other, as well as keep the others in check..
The first personality is the buy algorithm. The buy personality is based on two conditions. The first algorithm first determines a trend, then it waits for a confirmation. The personality is comprised of the following indicators.
EMA 7
EMA 14
MACD
Stochastic
RSI
By default, the first personality has its visual settings disabled. Its still working, its just not displayed on the chart. It can be enabled in the settings. The background colors designate trend and confirmation.
The second personality is stubborn and its committed to making a profit. Its a hard line in the sand that configurable by you the user. Its the take profit/trailing take profit setting. It will not let other personalities sell for less than these configured values. The visual component of personality two is represented by black dots. This serves to showcase its minimum profit target when opening a trade and a trailing stop loss when the price exceeds the minimum profit target.
The third personality is the guy that does the dirty work that nobody wants to admit they do. This personality is based on the original SB Master Chart algorithm. This personality takes over when the first personality is unable to turn a profit. This personality goes to work finding appropriate places to dollar cost average. There are two settings that affect this personality.
DCA %
Risk Multiplier (use extreme caution, this could cause a margin call if used inappropriately).
DCA percent setting restricts this algorithm from buying when the price has not fallen below this threshold.
Risk Multiplier instructs this algorithm how much positions/qty to buy when it buys. At 2x, the algorithm will buy enough shares to double its current position, at 3x the algorithm will buy enough shares to triple its current position.
The visual representations of the third personality are that of red, orange, yellow and green. Red means overbought. When an orange appears just prior to a red, that orange means overbought with volume. Green means oversold and an orange preceding a green is an oversold with volume. Both the red and green represent an possible trend reversal and that's the signal to buy when its green.
This personality is comprised of the following indicators:
RSI
Stochastic
MACD
Bollinger
Volume
The code also features 3 modes. Altering the mode setting changes the way the personalities work together (or do not work together).
Normal
Aggressive
Buy the Dip
Mode Normal works exactly like described above. Each personality has its own duty and they do not interfere with each others work.
Aggressive mode adjusts the dynamic and both the first personality and the third personality share an equal part in opening starter positions.
Buy the Dip mode prevents personality one from buying. Since personality one only buys uptrends, you will never see it buying a dip. This mode puts personality 3 in the spotlight. All position are typically opened during a fast/quick market decline. Personality three is still bound by the rules of personality 2, but its responsible for buying and dollar cost averaging.
I have also included labels for every buy/sell. A green label is the script making its first purchase, yellow is points where it decided to dollar cost average and the red is where it chose to deleverage by closing out all its positions. Nothing prevents the algorithm from buying immediately after a sell, this is by design because we do not want to miss out on an uptrend, but we also do not want to be caught with too much leverage.
Also included vital statistics on the top right of the chart.
Open Positions
Cost Basis
Current Gain/Loss
Minimum Profit Target
Trailing Stop Loss
Total Trades to Date
Maximum Positions/Qty to Date
In the bottom right of the chart, I have the user configurable settings. This is important so a user can at a glance see the settings of the chart without having to open the options menu.
Together, all three personalities form a COMPLETE trading system. The system tracks purchase quantity, cost basis from the first buy, adjust with each new buy and calculates the running profit from the begining of the date set in the settings if it were to have bought and sold at every signal. The public version of the script requires the trader to use the script in real time watching for buy and sell opportunities. The private subscription version of the script has custom alerts that can be configured to alert the user on when to buy and sell and also gives the user appropriate trailing stop loss settings to automate the trading process.
I want to name the personalities at some point in time for the novelty factor, but I wanted to release the script as soon as possible for others to enjoy, so they are nameless at this point. If you have suggestions, please contact me with your suggestion. I will credit the person with the best personality with a free subscription to the private version of this indicator.
As always, understand the risks of trading and trade responsibly. Nothing in this script can predict the future. Past results do not guarantee future performance

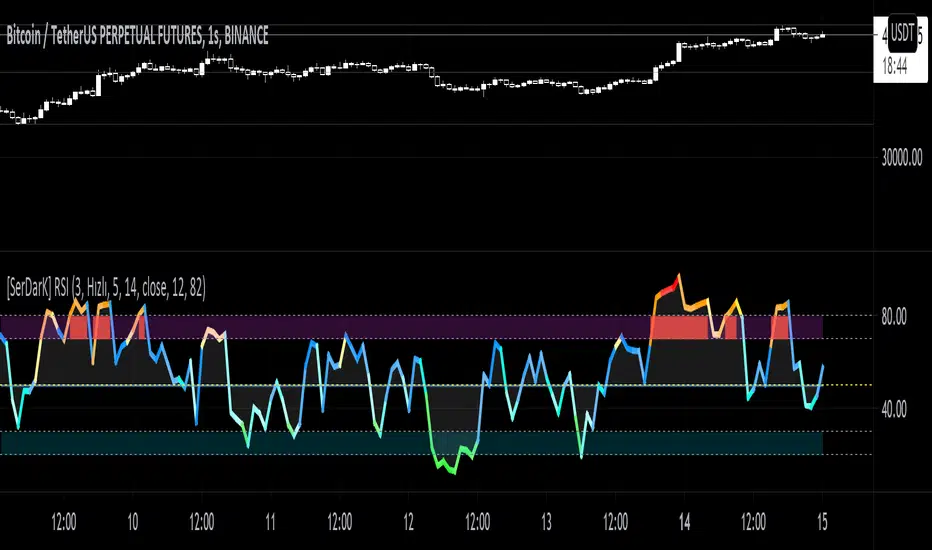
[SerDarK] RSI RSSEN: Coloring by levels, overbought, oversold, 50 level and RSS have been added to the classic RSI indicator. Two periods can be selected and almost all of the features can be adjusted from the settings.
TUR: Klasik RSI indikatörüne, seviyelere göre renklendirmeler, aşırı alım, aşırı satım, 50 seviyesi ve RSS eklenmiştir. İki periyotta seçim yapılabilmekte ve özelliklerin hemen hepsi ayarlardan düzenlenebilmektedir.
CCI/MFI/VZO/RSI - HEATMAPHeatmap I made/reverse engineered.
Currently tracks the 4 following oscillators:
- CCI (Channel Commodity Index)
- MFI (Money Flow Index)
- VZO (Volume Zone Oscillator)
- RSI (Relative Strength Index)
Any feedback or suggestions highly appreciated.
/* Inspiration taken from @ByzantineGeneral (TradingView profile: /u/ByzantineGeneral, indicator: /script/keAGdnWO-Byzantium-Oscillator-Heatmap) */

Blink RSI - SwingSwiss SuiteYOU ASKED FOR IT, WE MADE IT!
Blink RSI is life-saving. Literally.
Many of us use the RSI indicator daily.
Since I started trading, RSI has always been on my charts, but it is so frustrating not being able to see instantly what is happening on the other timeframes.
Blink RSI is here to solve this problem!
Choose up to 5 timeframes you want to monitor, and you are good to go. You will never have to switch from one timeframe to another to see how the RSI is behaving ever again.
The default configuration has a length of 14 and works on the usual 30-70 gap. Meaning that if a small square appears green, the RSI < 30 and it's a bullish sign while if the RSI > 70 it becomes red and might be bearish.
Very simple but super efficient!
Disclaimer:
Trading and investing in the financial markets involves substantial risk of loss and is not suitable for every investor.
All trading strategies are used at your own risk.
Trend Analyzer is part of the SwingSwiss Suite, contact me for more info

MACD, RSI, & RVOL Strategy
This strategy combines the use of MACD (12, 26, 9), RSI (14, 30, 70), and RVOL (14) to create Long Buy and Sell signals. This works well with many different time intervals but was developed with 15-minute intervals in mind.
Using MACD as a reference, the strategy identifies when the MACD line crosses over (a factor in a buy signal) and under (a factor in a Sell signal) the Signal line. This shows a shift in positive (cross over) and negative (cross under) of a security.
Using the Relative Strength Index ( RSI ) as an indicator, the strategy notices when the velocity and magnitude of the directional price movements cross over the Oversold signal (30) and crosses under the Overbought signal (70) as a factor in creating a Buy and Sell signal.
Using Relative Volume (RVOL) as an indicator, the strategy calculates when the current volume has crossed over the 2x average volume indicator over a given period and is then used as a factor in creating a Buy signal. RVOL is also used when the change in volume crosses under a set RVOL number (in this strategy, it is set to a RVOL of 5).
RVOL = Current Volume / Average Volume over a certain period
This strategy indicates a Buy signal when 2/3 conditions are met:
- RSI Cross Over the Over Sold signal (default 30)
- MACD Cross Over of Signal ( MACD > Signal)
- RVOL Cross Over of 2 (RVOL > 2)
This strategy indicates a Sell signal when 2/3 conditions are met:
- RSI Cross Under the Over Bought signal (default 70)
- MACD Cross Under of Signal ( MACD < Signal)
- RVOL Cross Under 5 (RVOL < 5)
Enjoy and leave feedback!

S73 Colored RSIS73 Colored RSI
Color change is based on above or below 50 mid line.
When RSI is red (below 50), I like to look for shorts, and when RSI is green (above 50), I like to look for longs.
Added extra bands for 10, 20, 80, and 90, so you can easily spot way oversold and way overbought conditions.
I look at taking profit in the overbought, oversold zones.
Hope you like it.
BTC tips - bc1q5eyfentq9mvxmnceh605yd8fted5se5rcta9j7
LTC tips - LXhWhvN86wbLNvacaZpEzhVEcefyMDPtcQ

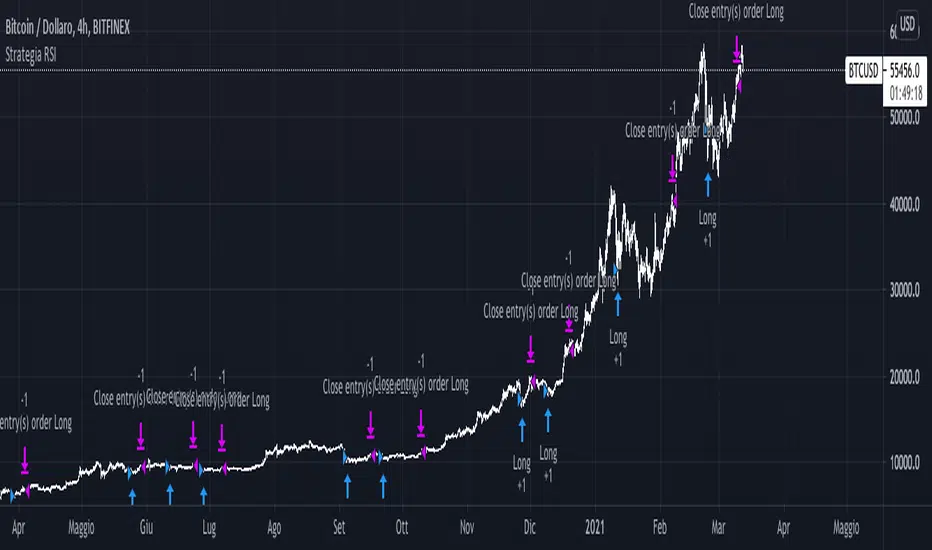
Strategia RSI sempliceQuesto semplice script sfrutta il RSI a 14 periodi per comprare (solo long) quando RSI crocia al rialzo i 30 (oversold line) e chiude l'operazione quando RSI crocia al ribasso i 70 (overbought line).
La strategia è stata progettata sul TimeFrame delle 4H (su BTC) e dimostra come una semplicissima strategia con un solo segnale poteva portare un 20% dal 2020 ad oggi su BTC/USD
RSI Classic Strategy (by Coinrule)One of the questions hobbyist traders more often ask is: what is the perfect trading indicator?
Every indicator is just a tool, so its efficiency is proportional to your ability to read its signals and translate them into an actionable trading strategy. The RSI is likely the most flexible and easy to use among the technical indicators.
This trading strategy tries to catch short-term swings on the coins of your choice with a simple yet profitable setup.
Buy when the RSI is lower than 30 (you can adjust it to 35 in times of steep uptrend).
Sell when the RSI is greater than 65 (the target may range between 60 and 75 depending on the volatility of the coin).
Note that the buy signal comes when the indicator crosses below 30 and not when it crosses above 30 as it happens on the built-in RSI strategy on Tradingview.
The present script overperforms the built-in strategy, even adding trading fees and using a lower amount of capital for each trade (30%). That means that the system can deliver higher net-profits with lower risk levels.
A typical example of market conditions where this strategy works perfectly is as follows.
The first initial breakout indicates that a new leg up in the trend may start. Bitcoin starts to trade within a range which you can identify when it reaches the point 3. That is the perfect time to start the rule because
- trading within a channel anticipates possible swings up and down
- the trend is on the upside, providing low downside risk in buying the dips.
This strategy works well with selected coins of your choice, and it's a great fit on leverage exchanges like Binance Futures.
If you prefer to run it across all available coins on the market, instead, you may choose an optimized version.

Stochastic RSI+Applies signal values to significant changes in momentum and can be used in conjunction with other indicators and analysis to improve trade timing.
Both "Signal Up" and "Signal Down" can be used for alerts.
The magnitude of the signal is the difference between K and D.
(See the code for the logic and implementation.)
Signal Up occurs when momentum is within the band and moving upward.
Signal Down occurs when momentum is within the band and moving downward.
Interpretation Note:
The Stochastic RSI is known for false signals, so it should never be used as a pure buy or sell signal. It is useful as a warning or to help with trade timing.
A good example of this is: If you are bullish on a stock, and the signal is negative (signal down), then it may be wise to not buy until the recent change in momentum has dissipated.
