Adjustable Moving AveragesAdjustable Moving Averages
This script has fixed simple moving averages and fixed exponential moving averages function.
And script has 2 lines
1. Simpe Moving Average Line
2. Exponential Moving Average Line
You can change this 2 lines length and also you can change periods aswell.
With this; you can use any length of sma and ema with different periods without changing period.
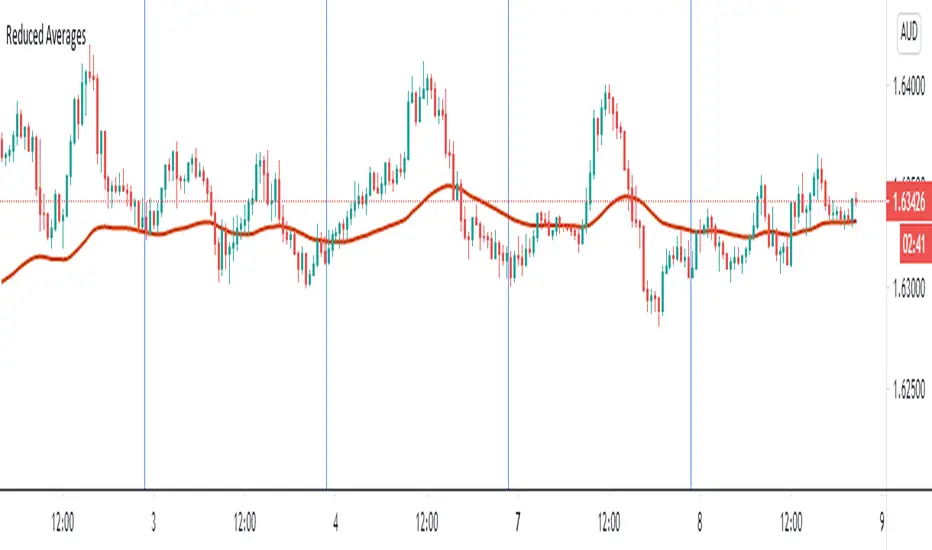
For example this chart on 1 day period
And you can see 2 lines
Red Line: SMA100 and 4H perioıd
Yellow Line : EMA100 and 4H period
Recherche dans les scripts pour "averages"

Multiple Time Frames Moving Averages (x3)This indicator is a set of 3 moving averages for which you can configure the type of the moving averages , their length , and of course the time frame . The moving averages you can choose from are:
- Simple Moving Average ( SMA )
- Exponential Moving Average ( EMA )
- Weighted Moving Average ( WMA )
- Running Moving Average (RMA)
- Hull Moving Average ( HMA )
- Volume Weighted Moving Average ( VWMA )
- Arnaud Legoux Moving Average ( ALMA )
The time-frames you can choose from - minutes (1, 3, 5, 15, 45), hours (1, 2, 3, 4, 12), days (1, 3), weekly or monthly .
Overall, it is a minimalistic indicator. No major improvements or trading logic like some of my other indicators, but I did make it slightly easier to use and visually appealing. The MAs' colors change from light to dark green/blue/red depending on the trend - bullish or bearish respectively. Initially, those were changing from green to red (based on direction) but it became a bit confusing when they started crossing each other. Anyway, feel free to change those colors to whatever you like.
If you have suggestions on how to improve this indicator or ideas about new ones, please drop me a line. Thanks.

Reduced Averages (20,50,100,200)This script simply takes average value of exponential averages with a goal of reducing the noise on your chart. Many traders use a bunch of averages to identify a trend as they perfectly line up. Reduced Averages does just that. When price is close to a central line, you can comfortbly switch to another chart. When you see it deviating further away, you can enable 20 EMA, 50 EMA, 100 EMA and 200 EMA with a single click.
A Fibonacci Moving Averages Ribbon Using One PlotThe following script aims to visually reproduce a Fibonacci moving averages ribbon by only using one plot function, the period of the moving average is determined by a number of the Fibonacci sequence. This trick is made possible by computing the value of a moving average at time t with a period determined by a periodic Fibonacci sequence and using plot.style_circles as plot style.
Settings
From Fibonacci Number: Determine the n th Fibonacci number to be used as the lowest moving average period
To Fibonacci Number: Determine the n th Fibonacci number to be used as the highest moving average period, capped at 19 to avoid errors. If you still have errors lower the value.
Src : input series of the moving average.
Details
The first thing we must do is to compute a periodic (repeating) linear sequence n from the number in From Fibonacci Number to the number in To Fibonacci Number , then we get the n th Fibonacci number from the previous sequence using Binet's formula.
To get the moving average we first compute the fib period momentum of the cumulative sum of Src , where fib is the current number of our periodic Fibonnacci sequence, we then divide the result by fib .
If we zoom in we can indeed see that there is only one point per bar.
However, zooming out and using a different color for each point allows us to get something visually similar to a ribbon. Adding more plots would create a visually more accurate result.
This trick is not the most useful in the world, but let's imagine you want to plot a massive ribbon consisting of 1000 moving averages with periods that can be determined by a specific sequence, using this trick would allow you to have the effect of 1000 plots while keeping your script relatively efficient, altho ribbons consisting of lots of moving averages are rarely easy to visualize.

Multiple Standard Moving Averages {CyberNetwork}Multiple standard moving average plots in a single script, with golden cross (GX) and death cross (DX) indicators.
Momentum filters of each MA can be applied to the GX/DX indicators -- i.e. such that the 50 SMA /200 SMA GX will only trigger if the momentum of the 200 SMA is positive, etc.
Note: User can set the triggering criterion, scaled to the % of the respective MA value.
Setting this value to negative allows the triggering of GX when MA momentum is negative (-ve), and vice versa for DX.
Each plots and indicators can be individually enabled/disabled.
This script is base on the following Multiple Moving Averages script: which allows users to set their own preferred MA candle lengths.
Multiple Moving Averages {Cybernetwork}

Difference of Exponentially Weighted AveragesImplementation of Difference of Exponentially Weighted Averages in Pine Script. It can generate a line that adjust to the overall trend of a graphic. The lines that are generated in a new plot are the the Difference of Exponentially Weighted Averages (blue) and it binarization over the previous values.
Exponentially Weighted Averages
This technique is used for generating smoother lines that adjust to a graphic. In finances, it is used to predict the overall trend of a graphic. The function that defines the EWA is the one bellow:
Vt = β V(t-1) + (1 - β) θt
Where:
β: Hyper-parameter that we have to adjust.
V(t-1): Value calculated for the previous element of the graphic.
θt: Current element of the graphic.
The calculus of differences consist in subtract to each value the previous values.

8 Separate Moving AveragesCOINBASE:BTCUSD Combine all your moving averages into one indicator.
This indicator allows for 8 separate moving averages, which can individually be configured as simple or exponential to any lengths you wish.
Allowing you to make room for other indicators.
Since is just moving averages, it can be used in any market.
Find me on twitter. Handle @Samih .

4 Bollinger Bands and 2 Exponential Moving Averages This script contains multiple indicators of 3 types for better visibility and without having to select multiple indicators one by one and hence saving your time and energy. Also, minimum number of variables are being used in the script for better calculation speed and implementation .
This script is best suited for beginners who are not using pro version and finding it difficult to implement more than 3 indicators on a single chart layout :)
Indicators used :
1. Hybrid of Simple Moving Average and Bollinger Bands .
In this Indicator user can use total of 4 Moving Averages or 4 Bolinger Bands or both (eg: 3 Bolinger bands and 1 Simple Moving Average).
> How to use :
If you want to use Bollinger Bands simply check the boxes of all the 'Upper' and 'Lower' Bands under indicator format/settings.
Else if you want to use Simple Moving Average simply uncheck the boxes of all the 'Upper' and 'Lower' Bands under indicator format/settings.
Tip : You are free to experiment with the format/settings to use both Simple Moving Average and Bollinger Bands using 'MA Length' and 'StdDev'
(standard deviation).
2. Exponential Moving Average
In this indicator user can use 2 Exponential Moving Averages .
> How to use :
If you want to use 2 Exponential Moving Averages simply check 'Enable 2nd EMA' under format/setting inputs.
Else if you want to use only 1 Exponential Moving Average simply uncheck 'Enable 2nd EMA' under format/setting inputs.
Tip : You are free to experiment with both 'EMA_Length1' and 'EMA_Length2' and change it as per your requirments.
//Feel free to ping/DM me for any explaination on how to use this script as your ultimate trading strategy.

Fibonacci Based Three Simple Moving AveragesSimple Moving Averages 55
Simple Moving Averages 144
Simple Moving Averages 233

Fibonacci Based Three Simple Moving AveragesSimple Moving Averages 55
Simple Moving Averages 144
Simple Moving Averages 233

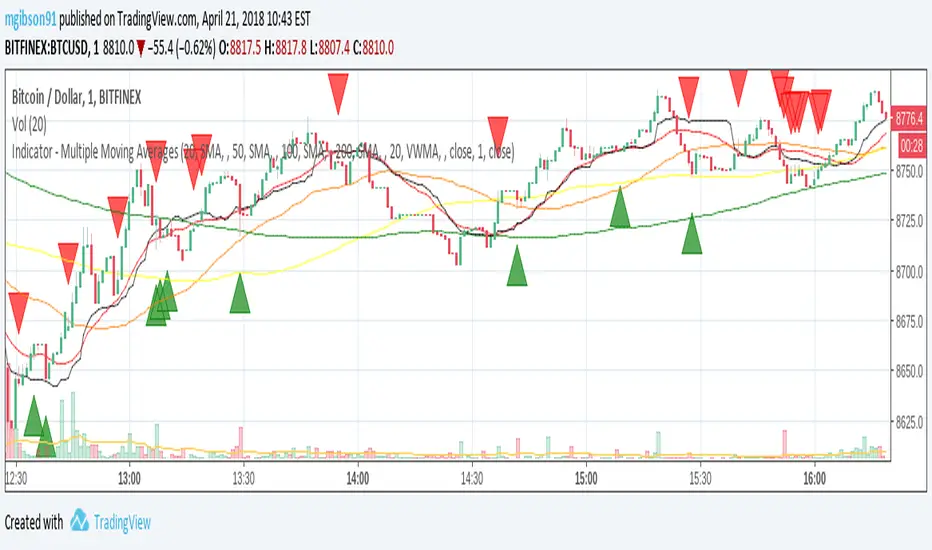
MG - Multiple Moving Averages & Candle Wick Alerts - 1.0Features:
- Each moving average has customizable length, type and source
- The ability to change the source of all moving averages with one input (changing an individual MA source will override the general for that MA)
- At a glance comparison of 20 SMA and 20 VWMA to gauge volume trend
- Wick alerts which can be toggled for each moving average.
- Bullish wick alerts are when the wick is the only part of the candle to drop below the moving average
- Bearish wick alerts are when the wick is the only part of the candle to reach above the moving average
- Simple candle closed alert if you want a notification, for example each hour.
Defaults: Four SMAs (20, 50, 100, 200) and a 20 VWMA .
Recommended Usage:
- Set the general source (sets the source of all moving averages) to 'low' when in an uptrend and 'high' in a downtrend to maximize Risk : Reward.
- Use Fibonacci levels, oscillators .etc for confluence
NOTE: The moving average component of this indicator is the same as the previous indicator ()
Triple Moving Averages++Extended version of Triple Moving Averages
Puts three moving averages on the chart can choose from
Simple Moving Average
Exponentially Weighted Moving Average
RSI Moving Average
Weighted Moving Average
Arnaud Legoux Moving Average
Volume Weighted Moving Average
Also includes options to hide each of the moving averages

Simple Moving Averages + LabelsSimple Moving Averages
With this indicator, you can add a personal and visual touch to your simple mobile averages, activating and customizing the way you view your SMAs with or without labels and prices.

Multiple Moving Averages by BadshahIntroduction Streamline your technical analysis with the Quintuple MA Strategy Suite, a robust all-in-one utility designed to maximize chart efficiency. Instead of cluttering your workspace with multiple individual indicators, this script empowers you to deploy up to five fully customizable Moving Averages simultaneously. Whether you are tracking micro-trends for scalping or major baselines for swing trading, this tool adapts to every timeframe and style.
Core Features
5-in-1 Architecture: Run five independent moving averages at once, saving your precious indicator slots for other tools.
Hybrid Calculation Modes: Instantly toggle any line between Simple Moving Average (SMA) for smooth baselines and Exponential Moving Average (EMA) for weight-sensitive reactions to recent price action.
Smart labeling System: Features an intelligent labeling mechanism that places text tags slightly offset from the current price. This ensures you can instantly identify which line is which (e.g., "EMA 50" vs "SMA 200") without the text obscuring the latest candles.
Granular Control: Every aspect is customizable. You can independently adjust the Length, Source (Close, Open, High, Low, etc.), Color, and Visibility for each of the five MAs.
Practical Use Cases
The "Golden Cross" Setup: Enable MA 3 (50 Length) and MA 5 (200 Length) to automatically visually track major trend reversals.
Ribbon Trading: Enable all five lines with sequential lengths (e.g., 20, 50, 100, 150, 200) to create a "Moving Average Ribbon," visualizing the strength and direction of the trend expansion.
Scalping Cross: Use MA 1 and MA 2 set to fast lengths (like 9 and 21) to catch rapid momentum shifts.
Settings Guide
Show MA: Toggles the visibility of the specific line.
Show Label: Toggles the text tag next to the line (auto-offset by 5 bars).
Type: Select between SMA or EMA calculation.
Length: Define the lookback period for the average.
Disclaimer This script is provided for educational and analytical purposes only. Past performance of indicators does not guarantee future results. Trade responsibly.

5 Moving Averages – Custom Trend Colors + No Neutral Mode5 Moving Averages Pro – Custom Trend Colors + No Neutral Mode
The cleanest and most professional 5-MA bundle on TradingView.
Features:
• 5 fully customizable moving averages (period + type: SMA, EMA, WMA, HMA, VWMA)
• All 5 MAs instantly change color based on global trend:
– Green → price above ALL 5 MAs (strong bullish)
– Red → price below ALL 5 MAs (strong bearish)
– Optional neutral gray (or completely disable neutral mode)
• Fully customizable bullish, bearish and neutral colors
• Optional background coloring (very light & clean)
• Trend change arrows (only on real bullish/bearish confirmation)
• "No Neutral" mode → forces green/red even in sideways markets (price vs average of the 5 MAs)
Perfect for:
• Trend-following systems
• Clean chart setups
• Scalping, day trading & swing trading
• Confirming institutional bias
Zero repainting | Super lightweight | Works on all timeframes & markets
One of the most loved multi-MA indicators worldwide. Join 250K+ traders already using it daily!

Rainbow Moving Averages (v5 safe)Rainbow Moving Averages — plots multiple moving averages of different lengths in a rainbow colour scheme to visualise market trend strength and direction. The spread and alignment of the lines help identify trend changes and momentum shifts.

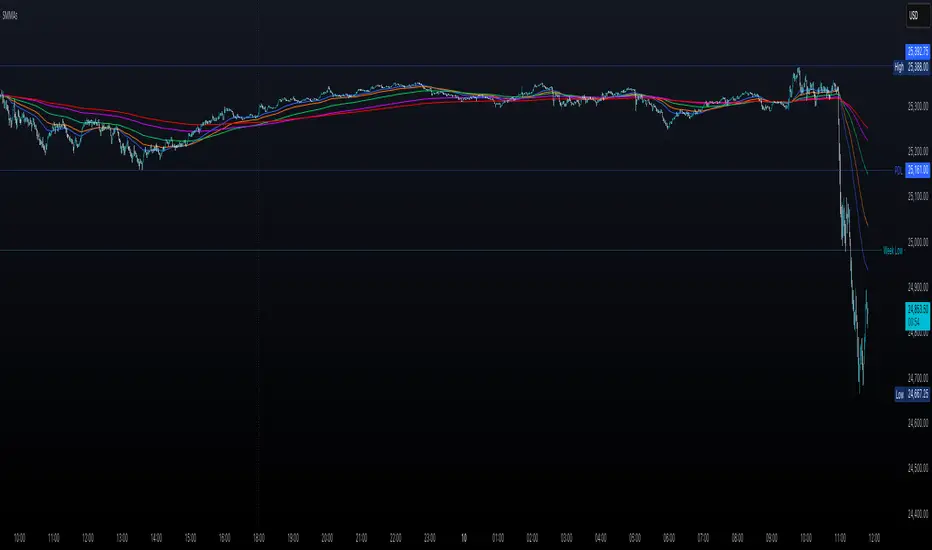
Multiple Smoothed Moving AveragesMultiple Smoothed Moving Averages (SMMAs)
This indicator displays up to 5 Smoothed Moving Averages (SMMAs) on your chart, providing a comprehensive view of multiple trend timeframes simultaneously.
═══════════════════════════════════════
WHAT IS A SMOOTHED MOVING AVERAGE?
═══════════════════════════════════════
The Smoothed Moving Average (SMMA), also known as the Running Moving Average (RMA), is a type of moving average that provides more smoothing than a Simple Moving Average (SMA).
Unlike SMA which gives equal weight to all values in the period, SMMA uses a recursive formula that gives more weight to previous SMMA values, resulting in:
- Smoother price action with less noise
- Slower response to recent price changes
- Better identification of longer-term trends
- Reduced false signals in choppy markets
CALCULATION METHOD:
- First value: Simple Moving Average of the initial period
- Subsequent values: (Previous SMMA × (Length - 1) + Current Price) / Length
This recursive nature makes SMMA particularly effective for identifying sustained trends while filtering out short-term volatility.
═══════════════════════════════════════
FEATURES
═══════════════════════════════════════
✓ 5 Independent SMMAs: Each with its own configurable period length
✓ Individual Toggles: Show/hide each SMMA independently
✓ Distinct Colors: Easy visual identification of each moving average
✓ Customizable Lengths: Adjust each period to match your trading strategy
✓ Shared Source: All SMMAs calculate from the same price source (default: close)
✓ Overlay Display: Plots directly on the price chart
═══════════════════════════════════════
DEFAULT SETTINGS
═══════════════════════════════════════
- SMMA 1: 30 periods (Blue)
- SMMA 2: 50 periods (Orange)
- SMMA 3: 100 periods (Green)
- SMMA 4: 200 periods (Purple)
- SMMA 5: 300 periods (Red)
All SMMAs are enabled by default.
═══════════════════════════════════════
HOW TO USE
═══════════════════════════════════════
TREND IDENTIFICATION:
- Price above all SMMAs = Strong uptrend
- Price below all SMMAs = Strong downtrend
- Price between SMMAs = Transitional phase or consolidation
SUPPORT & RESISTANCE:
- SMMAs often act as dynamic support in uptrends
- SMMAs often act as dynamic resistance in downtrends
- Longer-period SMMAs (200, 300) provide stronger S/R levels
CROSSOVER SIGNALS:
- Faster SMMA crossing above slower SMMA = Bullish signal
- Faster SMMA crossing below slower SMMA = Bearish signal
MULTIPLE TIMEFRAME ANALYSIS:
- Short-term trends: 30, 50 periods
- Medium-term trends: 100 periods
- Long-term trends: 200, 300 periods
═══════════════════════════════════════
CUSTOMIZATION
═══════════════════════════════════════
INPUTS TAB:
- Adjust each SMMA length to suit your trading timeframe
- Toggle individual SMMAs on/off using checkboxes
- Change the source (close, open, high, low, hl2, hlc3, ohlc4)
STYLE TAB:
- Modify line colors for each SMMA
- Adjust line thickness and style
- Change transparency levels
═══════════════════════════════════════
NOTES
═══════════════════════════════════════
- This indicator uses the mathematically correct SMMA calculation with the recursive formula
- All calculations are performed on every bar to ensure data consistency
- SMMAs respond more slowly than EMAs but faster than WMAs to price changes
- Best used in combination with other technical analysis tools
- Use on any timeframe
═══════════════════════════════════════
Perfect for traders who want a clear, multi-timeframe view of market trends using the smooth, reliable SMMA calculation method.
Bollinger Bands with 4 Moving AveragesCombines Bollinger Bands (BB) with up to four optional Moving Averages (MA) to read volatility, trend direction, and dynamic support–resistance in one overlay.
How It Works
BB: basis = MA(length, type) with standard deviation mult. upper = basis + dev, lower = basis − dev.
MA1–MA4: additional averages you can toggle (default only MA4/200 enabled).
Key Features
Flexible basis MA type for BB: SMA / EMA / RMA (Wilder) / WMA / VWMA.
Four optional MAs with independent length, color, and width (defaults: 7, 25, 99, 200; only 200 on by default).
Offset to shift BB for visual testing.
Overlay on price with shaded band between Upper–Lower.
Inputs & Defaults
BB Length = 20, StdDev = 2.0, Source = close.
Basis MA Type = SMA.
MA4 active (200), MA1–MA3 off (7/25/99 ready).
Offset = 0.
Practical Use
Use BB for volatility context: squeeze → potential breakout; expansion → strong trend.
Treat Basis / Upper / Lower as dynamic levels:
Pullbacks to Basis often become decision zones in trends.
Upper/Lower touches = relative extremes.
Add MA4(200) for primary bias; enable MA1–MA3 for finer timing.
Typical behavior:
Price > MA200 and rising basis → bullish bias; watch pullbacks to basis/MA25-like zones.
Price < MA200 and falling basis → bearish bias; watch rejections at basis/MAs.
Common Signals (not financial advice)
Breakout + BB expansion confirms momentum.
Squeeze + basis break can preface volatility expansion.
Confluence: Lower touch + fast MA in uptrends → mean-reversion setups; inverse for downtrends.
Notes
MA1–MA4 are SMA in the code; BB basis follows the selected MA type.
Test across timeframes; tune length and mult to the asset.
Disclaimer
Visual tool only. Combine with risk management, multi-timeframe confirmation, and a tested plan.

RSI extremes + Nasdaq 100 +Crossover of moving averages
In this indicator, we integrate four main features.
1. Oversold and overbought price signals, based on the 1-minute RSI extremes, marked on the chart with a yellow triangle.
2. Combination of oversold and overbought signals in the stock price and its index (only applicable to Nasdaq 100 symbols). Marked on the chart with a green triangle for oversold and a red triangle for overbought.
3. Use of four moving averages for early trend detection: EMA 10, 20, and 45 - SMA 200.
4. Crossover of moving averages in order 10, 20, and 45. On the upside, a green cross appears; on the downside, an orange cross appears.
Combine this indicator with "RSI (1 and 5m) + divergences and rsiNDX 1m " to check the signals and you will have a scalping strategy for reversals and trend following in NASDAQ 100 stocks.

Moving Averages 7 & 15 & 50 & 100 & 200 & 400we can use 7 moving averages for one indicator.
base moving averages are 7, 15, 50, 100, 200 and 400.
it can be used for determining of trend
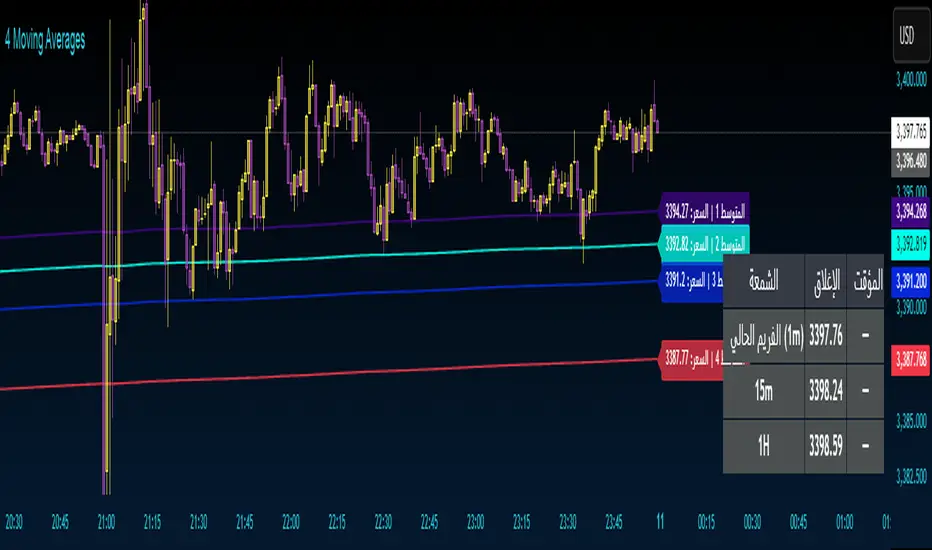
4 Moving Averages 4 Moving Averages
An indicator with four moving averages with ready-to-use settings. Use them as support and resistance.
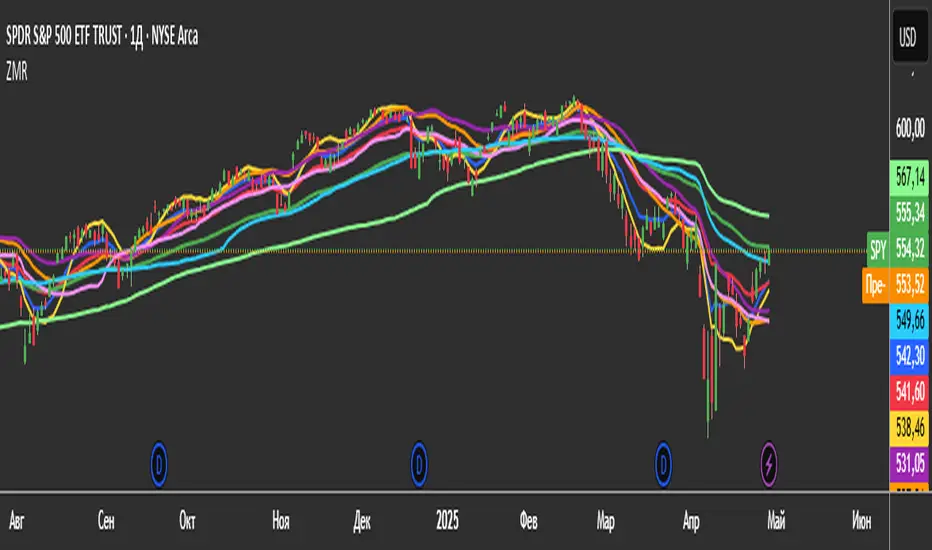
3 Zero Lag + 3 Moving Averages + 3 RVWAPThe "3 Zero Lag + 3 Moving Averages + 3 RVWAP" (ZMR) indicator combines three groups of tools for technical analysis.
1. Three Customizable Moving Averages (MAs):
Configuration for Each MA:
Choice of 7 types (SMA, EMA, WMA, HMA, VWMA, LSMA, SMMA).
Independent periods and price sources for each line.
Visualization:
MA1 (Blue), MA2 (Red), MA3 (Green).
2. Three Zero Lag EMAs (ZLEMA) with Individual Settings:
Lag Reduction: Corrects traditional EMA lag using:
Adjusted Price = 2 * Current Price - Price .
Flexibility:
Unique lengths (20, 50, 70) and individual price sources for each ZLEMA (HLC3, HL2, Close, etc.).
Colors:
ZLEMA1 (Yellow), ZLEMA2 (Orange), ZLEMA3 (Purple).
3. Three Rolling VWAPs with Custom Parameters:
Volume-Weighted Average Price (VWAP):
Calculated for three periods (20, 50, 100) with dedicated price sources for each VWAP.
Colors:
VWAP1 (Pink), VWAP2 (Light Blue), VWAP3 (Neon Green).
Moving Averages By MoneyTribe21This custom indicator displays three Smoothed Moving Averages (SMAs) designed to help traders identify market trends, potential reversals, and key support/resistance levels. It is ideal for trend-following strategies, momentum trading, and confirming price direction in various timeframes.
Three Smoothed Moving Averages to track short-term, mid-term, and long-term trends:
21-Day SMA: Captures short-term price momentum and trend direction.
50-Day SMA: Represents the mid-term trend, often used as dynamic support/resistance.
200-Day SMA: The long-term trend filter, commonly watched by institutional traders.
Fully Customizable Settings
Adjust period length for each SMA to fit your strategy.
Modify line colors, thickness, and styles for better visibility.
Enable/disable specific SMAs based on preference.
Works Across All Markets
Compatible with Forex, Stocks, Commodities, Crypto, and Indices.
Supports multiple timeframes (1M, 5M, 1H, Daily, Weekly, etc.)
