Recherche dans les scripts pour "averages"

Magnus Simple Moving AveragesThis just adds 7 moving averages in one indicator to your chart using the sma
For now you can just change the size of the lines.

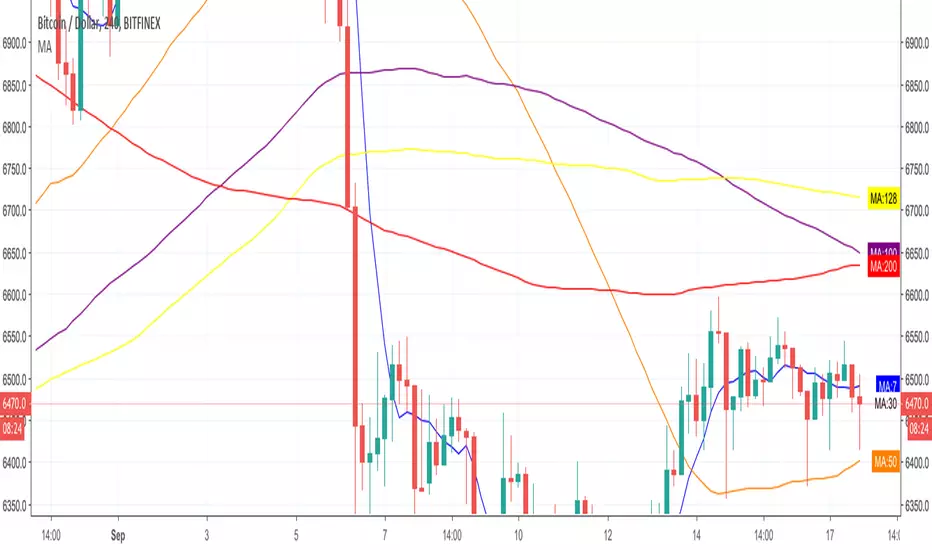
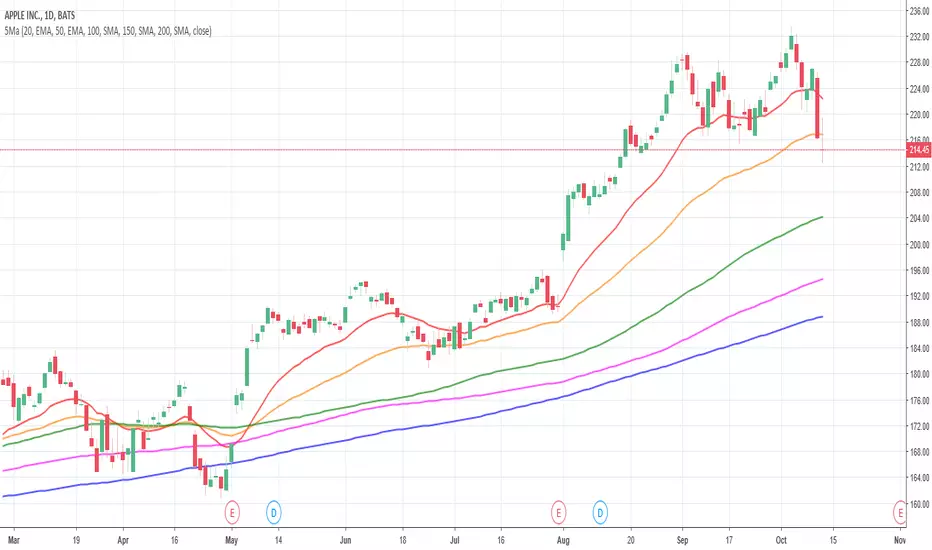
5 Moving Averages ( 7,30,50,100,200 ) ( sma ema wma hullma )5 Moving Averages
Stock: works best on dark layout
7 Ma lime
30 Ma orange
50 Ma red
100 MA aqua
200 White
You can switch between
1 sma
2 ema
3 wma
4 hullma
5 vwma
6 rma
Change the coler and Ma value line with, ext

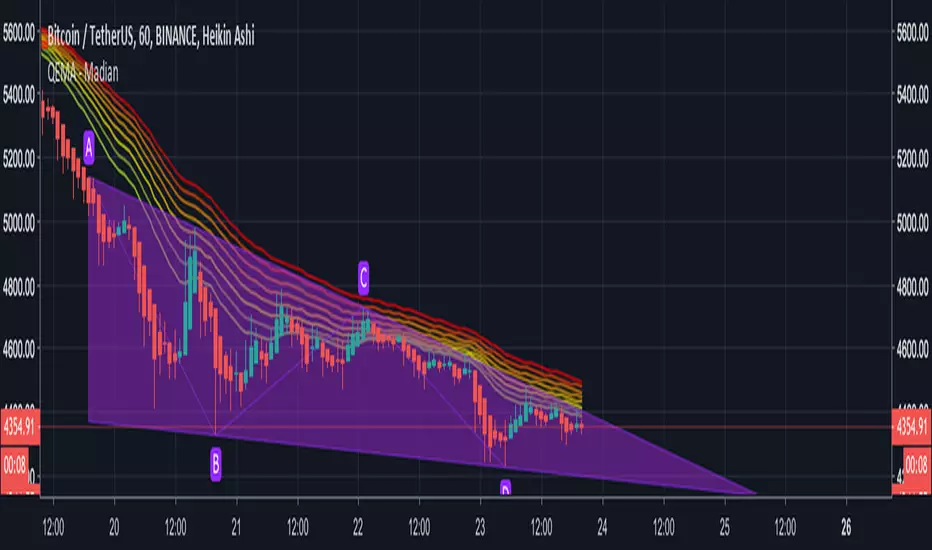
QEMA - 8 Exponential Moving Averages (20 - 55) / MadianQEMA - 8 Exponential Moving Averages (20, 25, 30, 35, 40, 45, 50, 55)
This QEMA act as support and resistance .

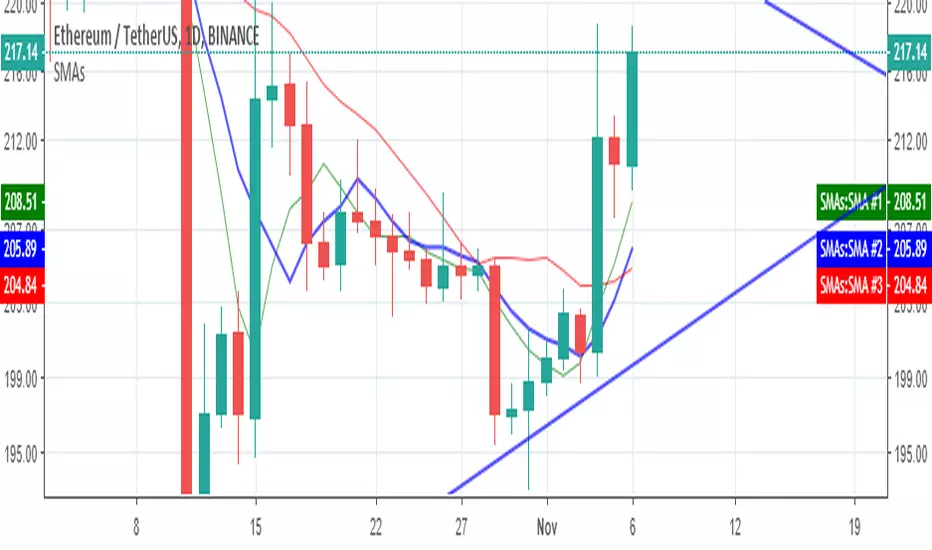
Moving AveragesThis script plots three moving averages and allows the user to toggle between 'simple' and 'exponential' averaging.

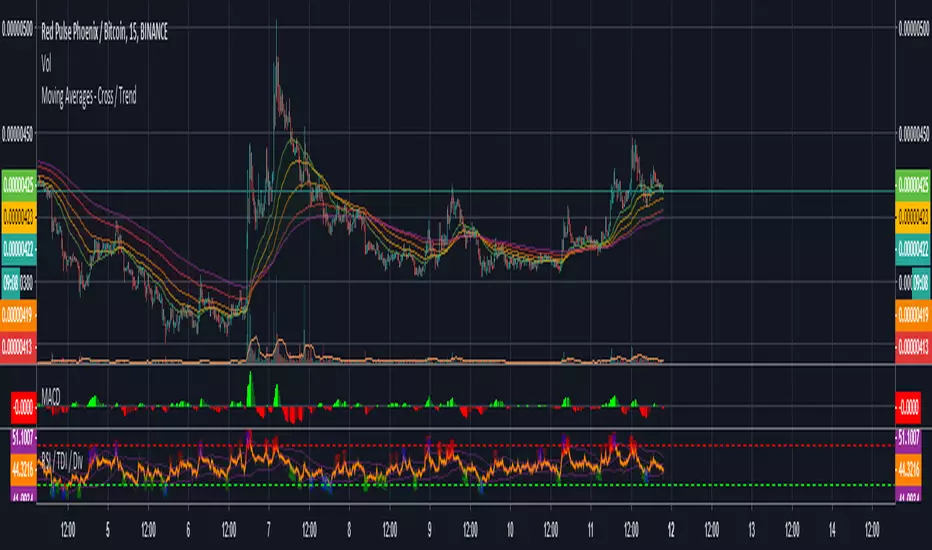
Moving Averages - Cross / Trend 5 x Moving Averages that will show you trend bias for a coin ( green bull / yellow undecides / red bearish )
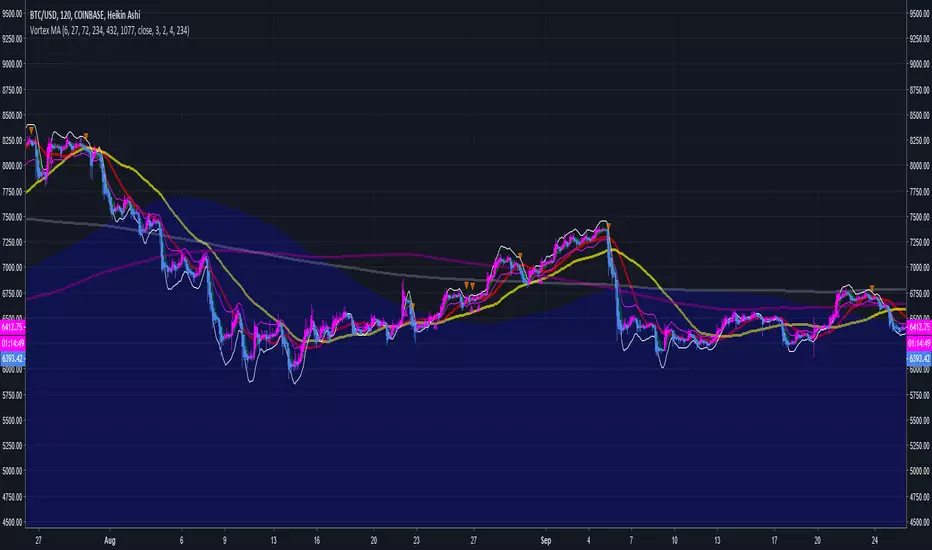
CS: 2 Moving Averages Script - Strategy (Testing)2 Moving Averages Trading Script - Strategy Version (For Backtesting)


Multiple Moving Averages Alerts ScriptAlerts script that has triggers on multiple moving average crossovers so that profit is maximised, it also has an optional control moving average, enabled by default, that when active will stop trading when the price (first ma) is below the control moving average.
Source code is open so that others can use and modify
Click Below for Backtesting version:
Disclaimers, not an expert, not intended to be financial advise.
Biffy
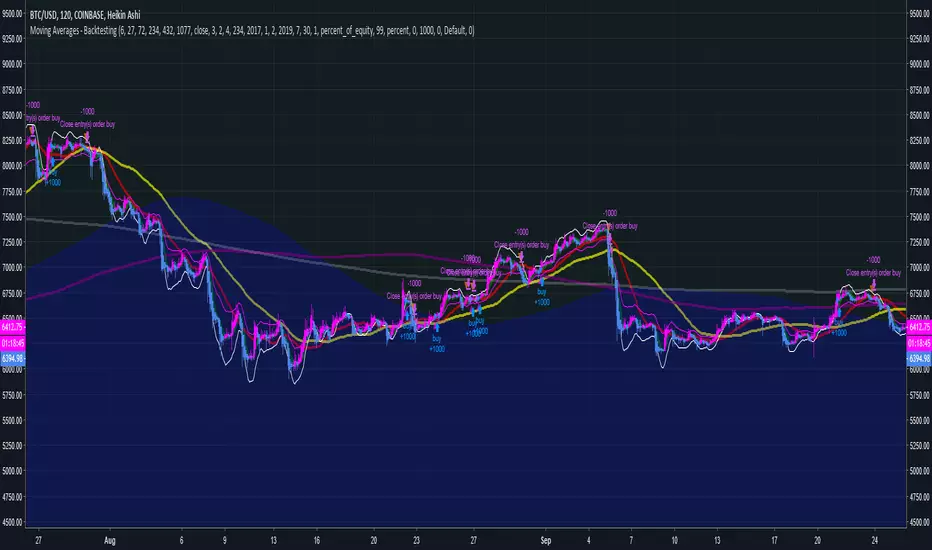
Moving Averages - BacktestingAlerts script that has triggers on multiple moving average crossovers so that profit is maximised, it also has an optional control moving average, enabled by default, that when active will stop trading when the price (first ma) is below the control moving average.
Source code is open so that others can use and modify
Click Below for Alerts Study version:
Disclaimers, not an expert, not intended to be financial advise.
Biffy
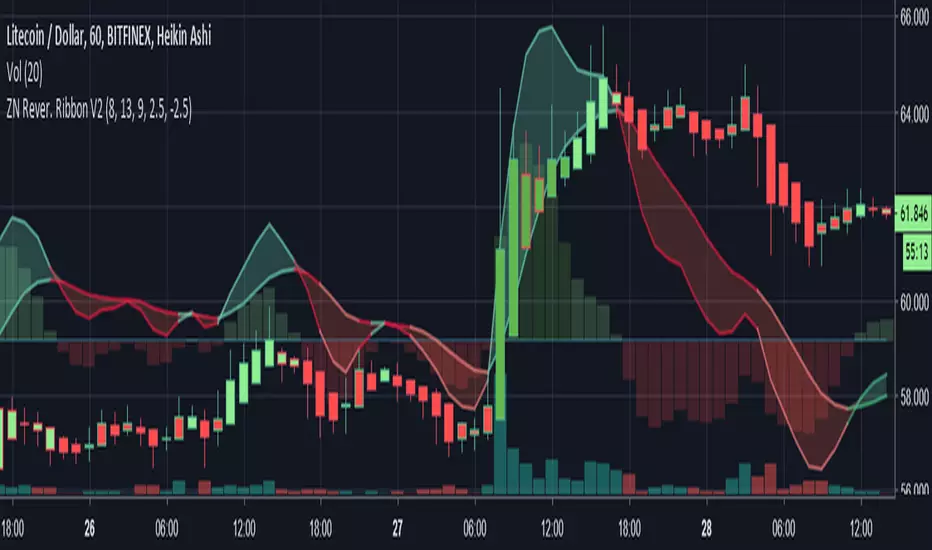
Librehash Reversion Ribbon V2Out of all the indicators created by this brand, this is probably the grandest of them all.
Known as the ‘ZN Reversion Ribbon V2’, for short, this indicator is designed to:
1. Create multiple buy and sell signals
2. Help users gauge the momentum of the price movement.
3. Re-color candles to give users a better understanding of price direction as well as plotting entries and exits.
4. Serve as an enhanced version of the MACD indicator.
5. Effectively gauge buy and sell pressure at any given point in time by using former price data.
There are a lot of moving parts to this indicator, so this guide will be dedicated to dissecting these moving parts, piece by piece.
#1 — Histogram
Perhaps the simplest part of the indicator to dissect at the start is the Histogram. This is also the part of the indicator that can be the most important complement to any other readings that are being made.
You read the histogram in the same manner that you would read the Histogram for the MACD.
The bars in the background are the histogram. Reading this portion of the indicator is fairly simple though.
1. As the green bars get darker, the buy pressure is increasing.
2. As the red bars get darker, the sell pressure is increasing.
3. If the current bar is larger than the last, the trend is sustained. This is the same principle that you would observe in the MACD. The core difference, however, is that this indicator is plugged in with a specific formula (beyond just the basic moving averages), that make them more responsive to price movement in a way that allows for the anticipation of signals being formed.
#2 — Ribbon
The ribbon on this indicator has about 3 different buy/sell signals embedded within it that will allow traders to anticipate an impending change in trend well before it EVER occurs.
This may be the most valuable part of the indicator itself.
Let’s start with the first facet of the ribbon.
A) — The ‘widening’ of the ribbon
When the ribbon ‘expands’, that means that the trend is ‘strengthening’ or growing. When the ribbon narrows or ‘contracts’, that means that the trend is becoming weaker and that this may serve as a warning of impending trend reversal.
In the picture above, you can see the color change of the ribbon itself as well.
You’ll notice that the ribbon transitions from a darker red to a lighter red. That’s a sign of waning sell pressure. You can apply this concept to the green portion of the ribbon too.
B)— The Line Sometimes Signals Before the Cross
This one is a bit harder to explain, but the way that the indicator is programmed is not to turn ‘green’ or ‘red’ based on the crosses, but rather on a mathematical formula.
Now, because of the way the indicator is programmed, the cross often coincides with the color change — but not always.
Below is an example:
Of course, beyond this, there are the usual buy and sell signals that come with the MACD as well.
For instance, there is —
C) The Change in Direction of the is a ‘Buy’ or ‘Sell’ Signal As Well
--------------
Changes in the Candle Colors
Perhaps the most elaborate part of this indicator is the fact that it changes the colors of the candles on the chart in live time without repainting.
In order to understand the candles, here’s a quick guide:
a) dark green with green outline = extreme buy pressure
b) lighter green with green outline = normal buy pressure
c) dark red = heavy sell pressure
d) light red = light sell pressure
e) dark green with red outline = impending reversal downward
f) purple with any outline = ambiguous / neutral
g) light green with red outline = very, very weak sell pressure
h) dark green with red outline = exhausted buy pressure
f) dark red with green outline = exhausted sell pressure
Effectiveness of Indicator
This indicator has the ability to be a ‘game changer’ in terms of its ability to dissect price action.
This next picture is another awesome example of how this indicator works.
Check it out:
Here are the multiple reasons why we could’ve anticipated the reversal in price direction before red candles started showing up:
1. The actual reversion lines themselves began to converge.
2. The Histogram is declining.
3. The bar colors move from dark green to light green.
Now, you may be looking at the above picture and thinking, ‘Well it seems that it didn’t catch the major upswing in the price later though’.
This is true, however —
The gain from this move was preposterous.
Even still, the indicator ensures that we still garner some pretty significant profits.
Conclusion
What you see here sums up this indicator for the most part. However, there are continued updates that will be put out for the indicator in the near future as well.
As always, these can be pushed directly through TradingView (which will happen soon).

5 Moving Averages (SMA, EMA)5 moving averages in 1 indicator. Choose between SMA and EMA for each moving average.
Daily Exponential Moving AveragesTired of wasting countless hours switching back and forth between timeframes?
Worry not! For only 499.95$ now you can... Oh wait this script took me 5 minutes I can't sell that.
The idea is priceless thought.
This is a very basic script that lets you view 2 daily exponential moving averages from any timeframe (you won't see much from higher timeframes thought).
To see the 1 hour regular divergence at the top you would still need to check the 1 hour.
I recommend having a vague idea of the trend on daily/weekly chart and then looking only at 4 HR with daily indicators on it like with this script + maybe if you want you might use the 1HR chart for confirmation or to try and pinpoint the best place to enter.
No matter what your holding periods are, other timeframes are bad anyway.
Going to release a couple more scripts in the coming weeks.

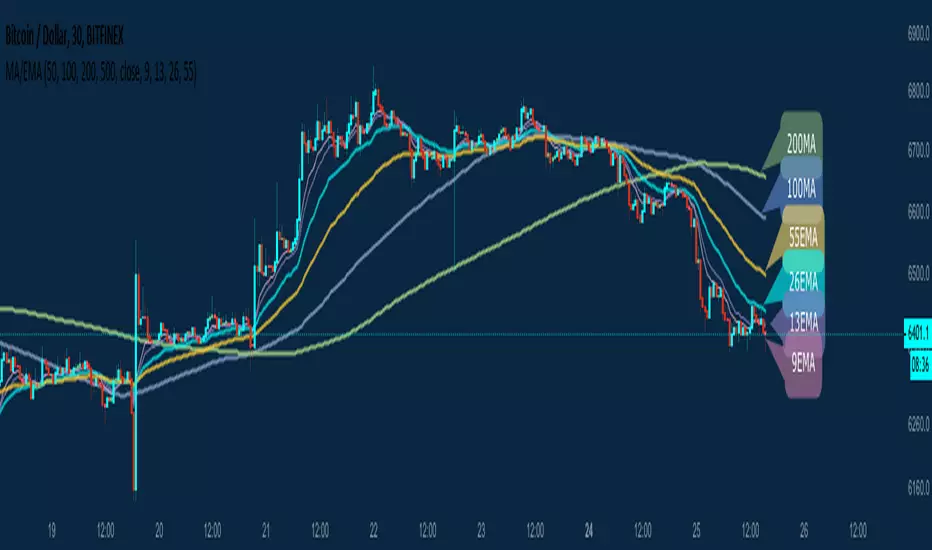
Ruler's Multiple Moving Averages - 8 EMA/MAA handy tool for those who need Multiple Moving Averages in a single indicator!
A great collection of 8 very powerful EMAs and SMAs including:
50MA 9EMA
100MA 13EMA
200MA 26EMA
500MA 55EMA
Of course, completely customizable to your own needs. No need to upgrade your Tradingview account to be able to use multiple MA indicators when you can have all of them in a single Indicator.
All feedback is welcome of course! Enjoy.
Seven Simple Moving AveragesBy default, this script overlays seven simple moving averages (5, 10, 20, 50, 100, 150, 200) and allows you to customize the SMA values as you wish. If a candle closes at or above a moving average, the plot for that SMA is colored green for that candle otherwise it's red.