Forex Dogs Moving Averages with Distance TableThis is an indicator based on the book【Forex】ForexDog’s Vacuum Zone Trading 2021: Trading Strategy to “not lose” based on Experience and Logic written by Forex Dog (yes, this is his author name on Amazon; he is a trader popular mostly in Japan). It consists of simple moving averages which should somewhat correspond to the higher timeframes moving averages. The original was traded on a 15m chart and the periods are as follows: 5, 20, 40, 50, 80, 100, 200, 400, 640, 1600, 1920, 3200.
Then, there is a big table with a distances overview. This should give you an idea of how far each average is in ticks. The minus in front of the ticks_total signifies direction.
I expect some feedback on this because I don't think the user convenience is very with tables being so bright. My goal is to create a system that limits the number of "noodles" on the chart but still carries the information via the tables on the side.
Moving Average Length is not adjustable by design. The book says to use these quite explicitly, although the logic would work just fine with some other levels, it would not be the original strategy.
Good luck!
Recherche dans les scripts pour "averages"

Moving Averages Different Type & SourceThis is a indicator to plot moving averages. User has the option to choose whether to plot SMA (simple moving average) or EMA (exponential moving average). Length of the averages also can be changed by user. The main feature also is use of different source for different length of MAs. Like you can plot 9SMA High with 20EMA Close etc. So, you can plot different types of combinations with type of MA (sma and ema) and Source type (high, low, open, close etc.).
A table also added in the right top to show the values of MA in selected timeframe. The red color indicate current price is below that ma and green color indicate current price is above that ma. Same feature added in plot of ma line by checking toggle color feature option on. It will show green color ma when price is above it and red color ma lines when price is below it.

Exponential moving averages Convergence to identify Strength of Exponential moving averages Convergence to identify Strength of the stock.
Description:
This script is developed to find Convergences for many indicators. It analyses Convergences of 20days, 50days, 100days, 150days and 200days exponential moving averages. When all the plotted lines are converged and Price of stock is above the Convergence the stock is bullish, similarly if the price of the stock is below the convergence stock is bearish.
This indicator gives you VWAP and EMA’s for convergence along with Bollinger Bands.
VWAP and Bollinger bands and EMA’s can be altered as you required.
In settings menu we can enable and disable VWAP, EMA’S & Bollinger bands and in style menu even we can choose required EMA
It helps for convergence.

Daily Moving Averages on Intraday ChartsPrints exponential 8, 21, 50, 100 and 200-day moving averages on intraday charts. For example, if you are on a 5 minute chart, you will see a magenta "X" making the current value of the 8-day EMA with an "8" label above it.
This is NOT a Strat script and it follows more closely the way Scott Redler from T3Live looks at charts. If you acknowledge that the vast majority of the time, price does have some sort of reaction to these daily EMAs (whether just a short relative pause or the beginning of a reversal), this script may be helpful.
The Strat and Rob Smith DO NOT support the use of moving averages. This adds more data to your chart which you may or may not find extraneous.

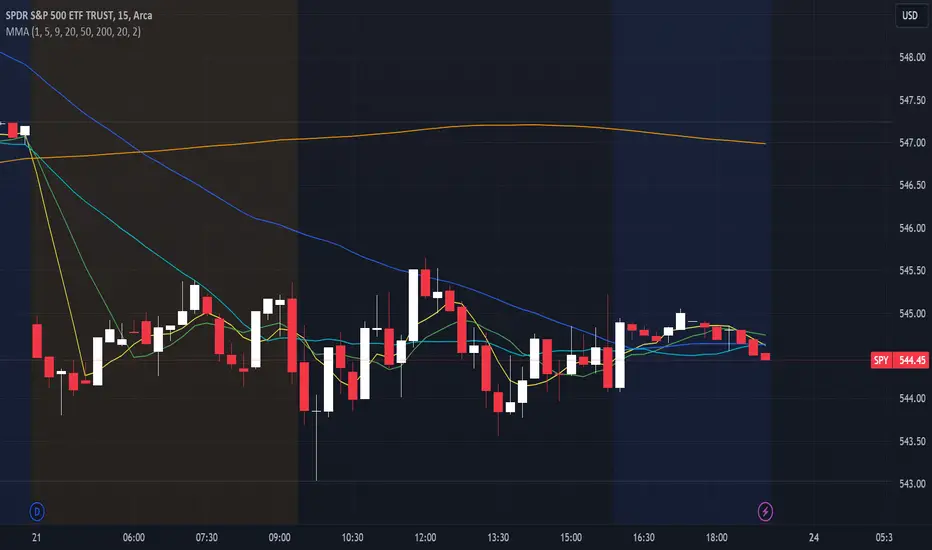
DARYL GUPPY'S MMA (MULTIPLE MOVING AVERAGES)This script plots 2 separate bundles of moving averages, consisting of 6 different MAs each, with the goal to avoid some false signal provided by individual MAs, and was designed by Daryl Guppy, an Australian trader.
The first bundle consists of 6 "fast" MAs (default width: 3, 5, 8, 10, 12, 15 periods) and is highlighted in blue. The second consists of 6 "slow" MAs (default width: 30, 35, 40, 45, 50, 60 periods) and is highlighted in orange. However I made it possible to modify the width for each MA. The original Daryl Guppy's MMA is made of EMAs, however this script also includes the possibility to plot SMAs instead.
From an operational point of view, those bundles act like individual MAs. So the trader should watch for crosses, convergences and divergencies between the 2 bundles and between the individual averages.

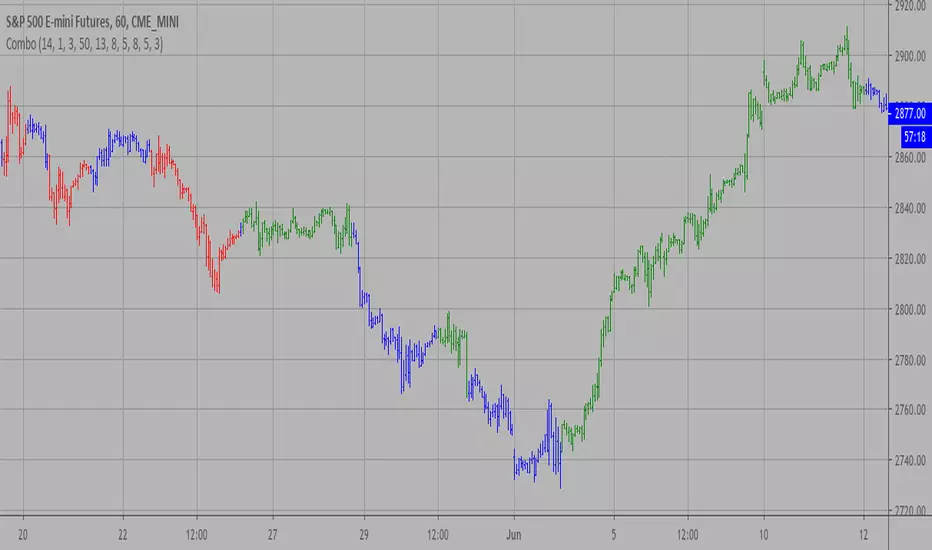
Combo Backtest 123 Reversal & Bill Williams Averages. 3Lines This is combo strategies for get
a cumulative signal. Result signal will return 1 if two strategies
is long, -1 if all strategies is short and 0 if signals of strategies is not equal.
First strategy
This System was created from the Book "How I Tripled My Money In The
Futures Market" by Ulf Jensen, Page 183. This is reverse type of strategies.
The strategy buys at market, if close price is higher than the previous close
during 2 days and the meaning of 9-days Stochastic Slow Oscillator is lower than 50.
The strategy sells at market, if close price is lower than the previous close price
during 2 days and the meaning of 9-days Stochastic Fast Oscillator is higher than 50.
Second strategy
This indicator calculates 3 Moving Averages for default values of
13, 8 and 5 days, with displacement 8, 5 and 3 days: Median Price (High+Low/2).
The most popular method of interpreting a moving average is to compare
the relationship between a moving average of the security's price with
the security's price itself (or between several moving averages).
WARNING:
- For purpose educate only
- This script to change bars colors.

Combo Strategy 123 Reversal & Bill Williams Averages. 3Lines This is combo strategies for get
a cumulative signal. Result signal will return 1 if two strategies
is long, -1 if all strategies is short and 0 if signals of strategies is not equal.
First strategy
This System was created from the Book "How I Tripled My Money In The
Futures Market" by Ulf Jensen, Page 183. This is reverse type of strategies.
The strategy buys at market, if close price is higher than the previous close
during 2 days and the meaning of 9-days Stochastic Slow Oscillator is lower than 50.
The strategy sells at market, if close price is lower than the previous close price
during 2 days and the meaning of 9-days Stochastic Fast Oscillator is higher than 50.
Second strategy
This indicator calculates 3 Moving Averages for default values of
13, 8 and 5 days, with displacement 8, 5 and 3 days: Median Price (High+Low/2).
The most popular method of interpreting a moving average is to compare
the relationship between a moving average of the security's price with
the security's price itself (or between several moving averages).
WARNING:
- For purpose educate only
- This script to change bars colors.
GC Usual Moving AveragesManage the usual moving averages. Moving averages remain unchanged if the time resolution is different from some MA maintains coherence of the temporal framework that is being observed. Gaps can be observed when the resolution chosen is lower than that of the MA.

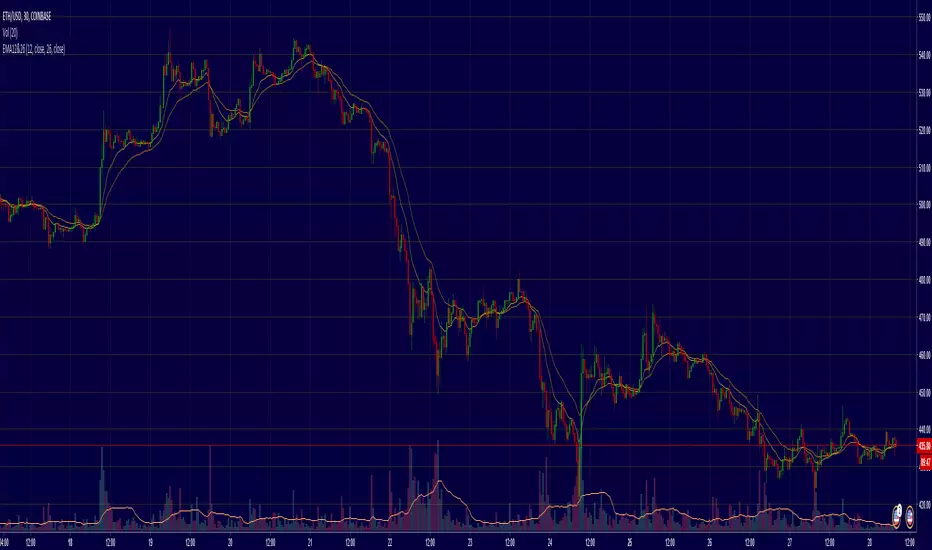
Exponential Moving Averages 12 & 26Exponential Moving Average Indicator for trading 12EMA and 26EMA crossovers.
The 12 and 26 period exponential moving averages (EMAs) are often the most popularly quoted or analyzed short-term averages.
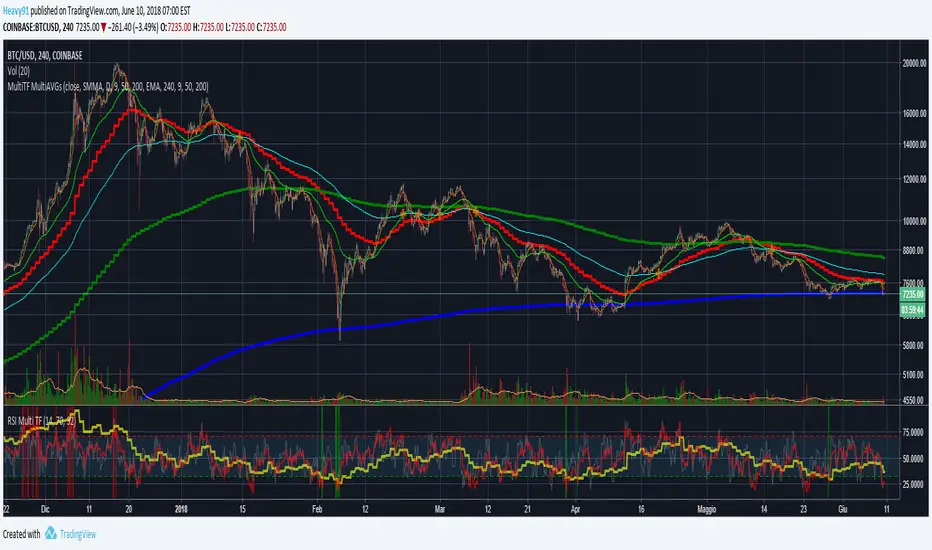
Ultimate 'Multi-Timeframe' Multi-AveragesPlots different kinds of averages (EMA, SMA, SMMA, WMA, VWMA) referred to a fixed timeframe/period indipendent from the one that you are watching (example: plot daily EMA on the 4h chart).
Highlights the crossing of averages.
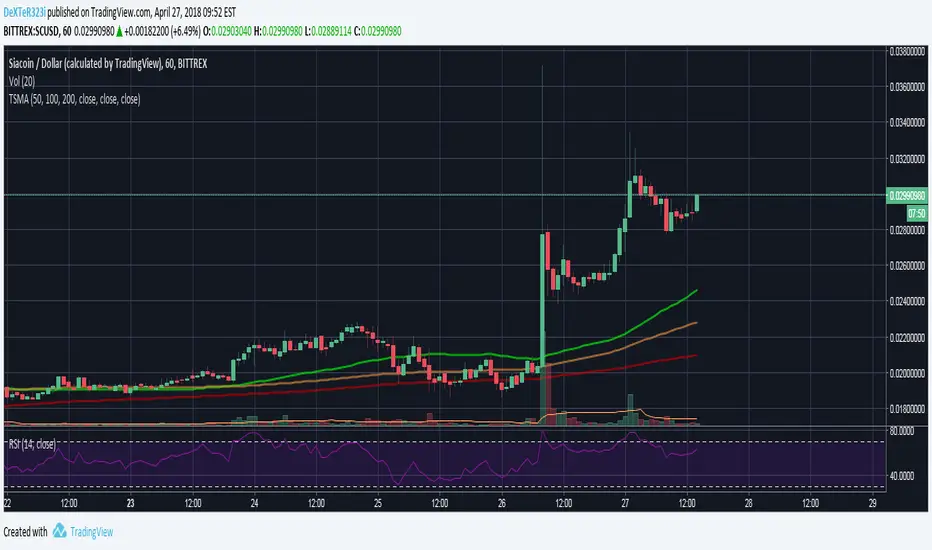
Three Simple Moving AveragesThis is a modified version of the Three Moving Averages, but instead of Exponential, it is Simple average. You can also change the lengths of averages.
Indicator - Multiple Moving Averages 1.0Features:
- Each moving average has customizable length, type and source
- The ability to change the source of all moving averages with one input (changing an individual MA source will override the general for that MA)
- At a glance comparison of 20 SMA and 20 VWMA to gauge volume trend
Defaults: Four SMAs (20, 50, 100, 200) and a 20 VWMA.
Usage:
- Use Fibonacci levels, pivots .etc for confluence
- Personally, I like to set overall source to low in uptrends, to high in downtrends and then set alerts for when the price crosses any of the averages. Then pay particular attention to the candlesticks and other indicators.
TODO:
- Add alerts option so that it send alert on crossing up or down any alert lines.

Multiple Moving Averages, Bollinger Bands, VWAP Options - Lett5 simple moving averages.
You decide:
1. The type of moving average
2. The length of the moving average
3. To show Bollinger Bands
4. To show VWAP.
Anchored Moving Averages - InteractiveWhat is an Anchored Moving Average?
An anchored moving average (AMA) is created when you select a point on the chart and start calculating the moving average from there.
Thus the moving average’s denominator is not fixed but cumulative and dynamic. It is similar to an Anchored VWAP, but neglecting the volume data, which may be useful when this data is not reliable and you want to focus just on price.
Main Features
This interactive indicator allows you to select 3 different points in time to plot their respective moving averages. As soon as you add the indicator to your chart you will be asked to click on the 3 different points where you want to start the calculation for each moving average.
Each AMA (Anchored Moving Average) will be colored according to its slope, using a gradient defined by two user chosen colors in the indicator menu.
The default source for the calculation is the pivot price (HLC3) but can also be modified in the menu.
Examples:
Enjoy!
5 Moving AveragesFive Moving averages. Choose from several types, SMA, EMA, SMMA etc... Has X and Y offset.
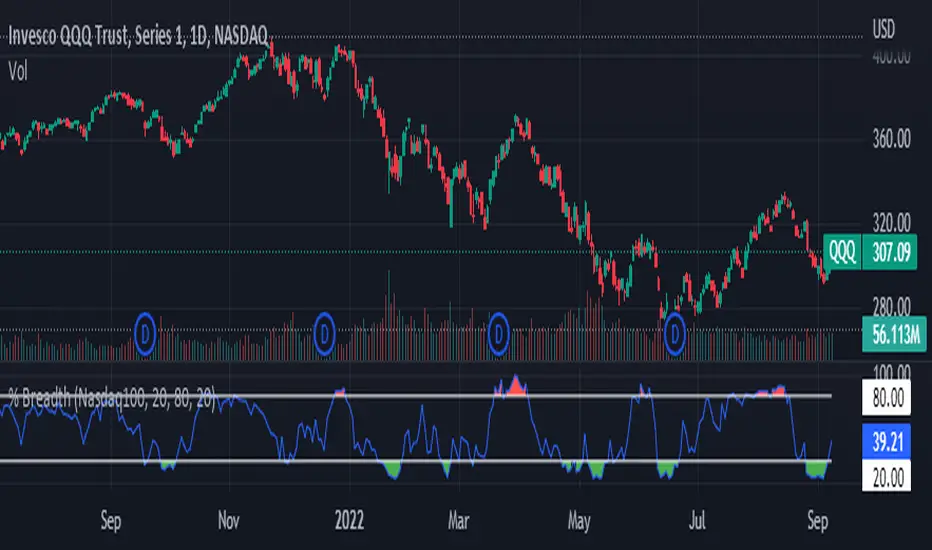
Index Breadth Percent of Stocks above Key Moving AveragesThis Indicator will plot the percent of stocks above key moving averages. This is a good way to monitor market breadth and help determine when the market is Overbought or Oversold.
Market Tickers Available = SP500, DJI, NQ, NQ100, R2000, R3000, SP500 Financials, SP500 Materials, SP500 Energy, SP500 Staples, SP500 Discretionary, SP500 Industrials, SP500 Real Estates, Overall Market
[bjb] tEMAs - Triple Exponential Moving Averages, by BlueJayBirdIs it not a pain in the butt not to find a simple script like this one in TV? I didn't find one, so I made it.
Features:
- Simple script with 3 simple Exponential Moving Averages.
Special features:
- Settable time resolution.
- Colored fill between EMA20/50 pair, and between EMA50/200 pair.
More useful than you think:
- I've found it specially useful for detecting Elliot Wave patterns. The fill colors make them stand out. Use EMA20/50 pair for this.
- The resolution change makes EMAs studies from higher timeframes, at lower time frames, more accurate. Try from 1m timeframe, setting the tEMAs resolution to 1h.
Like, follow and comment. 💯

Bollinger Bands with Moving Averages and MTFBollinger Bands basically use SMA, here I revised it for use with many moving averages. Moving average types I have added: "EMA", "RMA", "SMA", "WMA", "VWMA", "WWMA", "TMA", "VAR", "ZLEMA", "TSF".
There is also an MTF option to view different time zones.
6 Moving Averages with MTF v1.0This indicator is a collection of 6 different period Moving Averages. It has support for different time-frame resolution for all of them individually.
Also, it has 11 different type of Moving Average calculation functions:
1. Simple Moving Average (SMA)
2. Exponential Moving Average (EMA)
3. Weighted Moving Average (WMA)
4. Volume Weighted Moving Average (VWMA)
5. Smoothed Moving Average (SMMA)
6. Double Exponential Moving Average (DEMA)
7. Triple Exponential Moving Average (TEMA)
8. Hull WMA Moving Average (HullMA)
9. Triangular Moving Average (TMA)
10. Super Smoother Moving Average (SSMA)
11. Zero Lag Exponential Moving Average (ZEMA)
Note: The Moving Average calculation function is adapted from @JustUncleL
Happy trading 😉
Thank you.


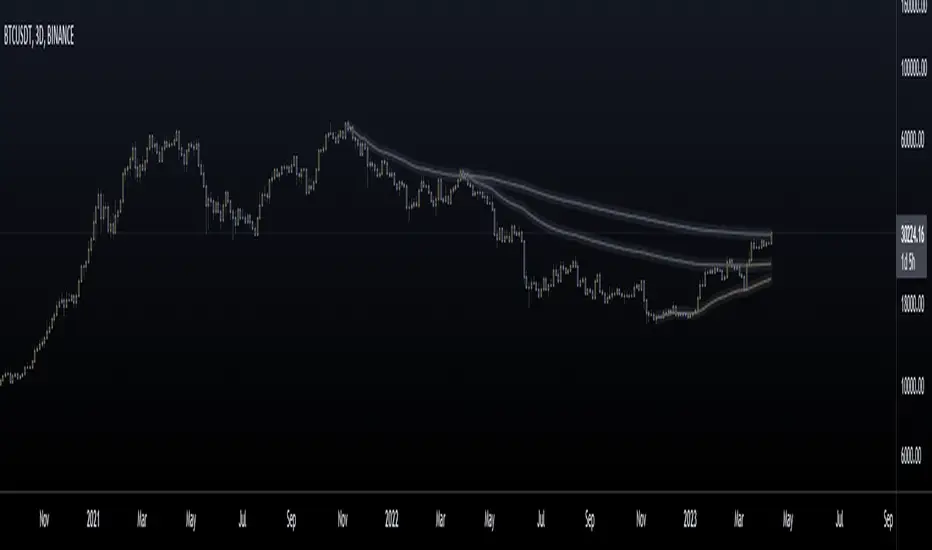
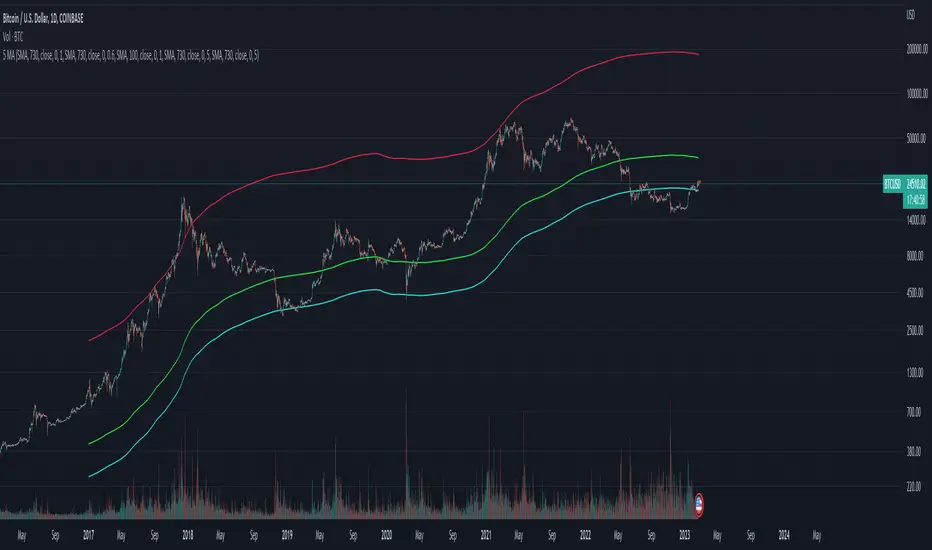
[BA] Multi Time Frame Moving Averages for BTCThis is a multi time frame moving average script. It includes 7 moving averages. Most of them are SMAs and WMAs but EMA were also used. Time frame was set to 1 day. It means that you can change the time frame of your chart freely without losing your lines. Levels will not change.
I wrote this script just to trade BTC. I prefer daily and weekly charts with this script but lower time frames are also preferable.
Since some of the lengths are too high; older exchanges are recommended due to their relatively deep historical data.
While MA1 is for taking actions like 'take profit' or 'stop loss' or just to follow 'price action' easily, other MAs are for seeing supports and resistances.
MA6 and MA7 are disabled by default in order to minimize the confusion but you can enable them from settings if you need to.
Since some newer exchanges have less historical data, you may not see MA4 and MA5 on the daily chart. In such circumstances MA6 and MA7 might be helpful to use as substitution. Some may like to use all of them.
I am using this script just for BTC but it can be useful for other coins as well.

Scripting Tutorial 3 - Triple Many Moving AveragesThis script is for a triple moving average indicator where the user can select from different types of moving averages. It is meant as an educational script with well formatted styling, and references for specific functions.

5 Moving Averages With ForecastExtending the 3 moving average ones which already exist out there, for those who work with 5 moving averages. (SMA/EMA)
