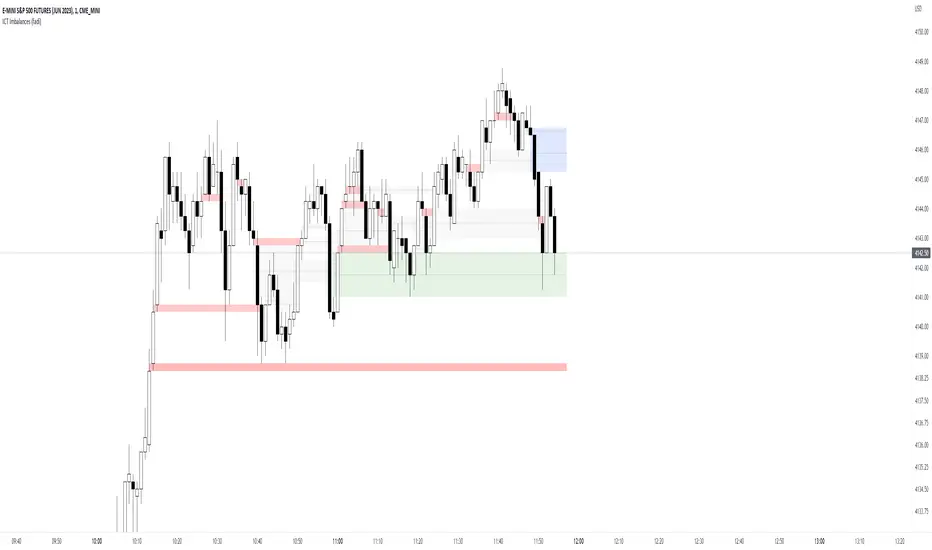
ICT Imbalances (fadi)ICT Imbalances focuses on highlighting the imbalances described by ICT Se imbalances usually act as a price magnet where price tend to revisit to mitigate the imbalance and can act as support and resistance.
It is important to understand that, while they do act as price magnet, they are not all places for entries. What they do provide, is a price understanding and possible areas of reversal based on the bigger picture and trading strategy.
There are four types of imbalances covered by this indicator:
Fair Value Gap (FVG)
Fair value is when, at any given price, both buy and sell sides are offered. For every up move, there is a down move. Fair value Gap is an imbalance where price moved too quickly before offering both buy side and sell side at a given price.
Implied Fair Value Gap (IFVG)
Implied Fair Value Gap is when the first and third candle have overlapping large wicks. The IFVG is the area between the half point of first and third candles.
Volume Imbalance (V.I.)
Volume imbalance is when the price creates a gap between the close of one candle and the open of the following candle with overlapping wicks.
Gap
An area where price gaps up or down leaving a void where price did not trade in. This is most common on higher timeframes and when one day ends and the next day begins.
Settings
ICT Imbalances provides the following options
- Show or hide specific imbalance to keep the chart clean
- Background color of the box highlighting the imbalance
- Box width in the form of how many candles the box extends to
- Show or Hide the Half Mark of the box, only applies to FVG and IFVG
- Show or hide a Legend that explains which colors represents which imbalance
Recherche dans les scripts pour "fvg"
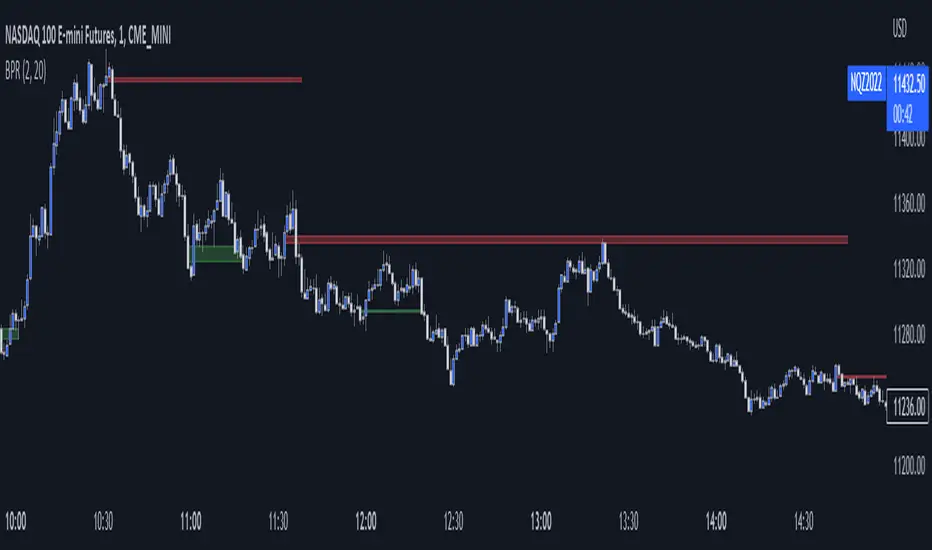
Balanced Price Range (BPR)This script finds BPR's, which some simply refer to as a "double Fair Value Gap" (FVG). In a BPR, there is an overlapping vertical area between a recent bullish and bearish FVG. You may tune the parameters to filter out smaller FVG's or BPR's, as well as how far back the indicator must look to find a matching pair.
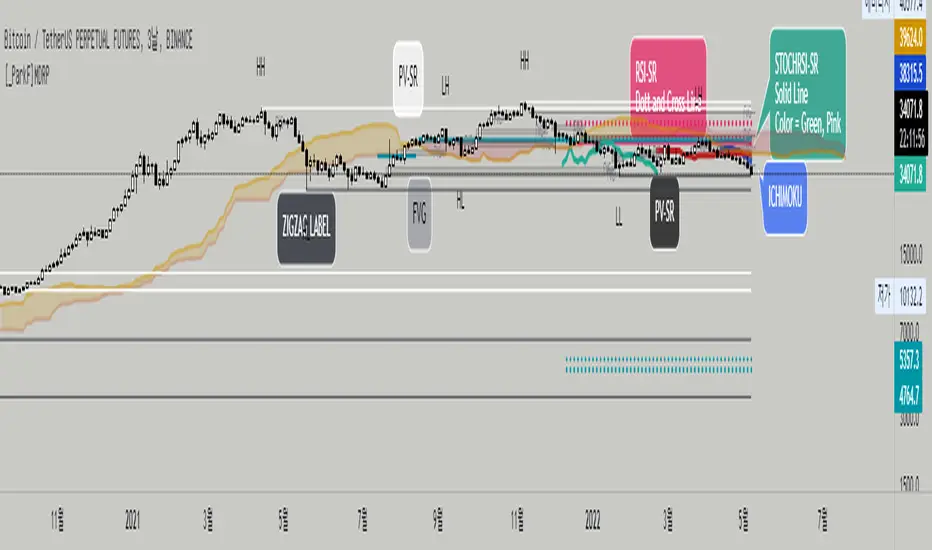
[_ParkF]MDRPThis indicator indicates that 'Momentum Discrepancy Reversal Point' = 'MDRP'.
Mixing and modifying several general indicators to find support and resistance
It is created to predict the change point of the trend by overlaying it on the chart.
The 4 support and resistance lines are drawn live, and the changed support and resistance lines are
It erases the line and overlays it again with a new line.
For each support and resistance, you can modify the color or line thickness, number of expressions, etc. in the input menu.
1. _____RSI-SR
Based on Wilder's RSI formula, overbought and oversold
Changes are detected and overlaid on the chart in the form of 2 resistances and 2 supports.
2. _____STOCHRSI-SR
Using the general stochastic and Wilder's RSI calculations,
Detect changes in overbought and oversold areas
It overlays the chart in the form of 1 resistance and 1 support.
3. _____PV-SR
Pivot-based support and resistance will be overlaid on the chart,
By default, 10 pivot lines are drawn, but by modifying the count in the input menu,
You can modify the number of overlays.
4. _____FVG
'Fair value gaps' refers to gaps within consecutive candles.
This section is overlaid in the form of a box,
The default is to draw 10 FVG boxes, but set count in the input menu.
You can modify the number of overlays by editing.
5. _____ZIGZAG
This is to find MDRP by overlaying the low and high prices of the current trend on the chart.
ZIGZAG labels near supports and resistances of 1, 2, 3 and 4 can increase the reliability of the MDRP.
The default value of live in the input menu is true, but if it is false, the closing price is checked and drawn.
Reduce false signals.
6. _____ICHIMOKU
The 5 lines of ICHIMOKU were overlaid with the default values of 9, 26, 52, 26,
Lines other than LeadLine A and B that are overlaid on the chart are overlaid on the chart only as much as the period value of each line.
* The _____FVG indicator cited the source of 'makuchaku'.
------------------------------------------------------------------------------------------------------------------------------------------------------------------------
이 지표는 'Momentum Discrepancy Reversal Point' = 'MDRP'를
찾기 위해 여러개의 일반적 지표들을 혼합, 수정하여 지지와 저항의 형태로
차트에 overlay 시켜 트렌드의 변화 지점을 예측 하기 위해 만들어졌습니다.
4개의 지지와 저항선은 실시간으로 그려지게 되며, 변화된 지지와 저항은 기존의
선을 지우고 새로운 선으로 다시 표시 됩니다.
각 지지와 저항은 input 메뉴에서 색 또는 선의 두께, 표현할 개수 등을 수정할 수 있습니다.
1. _____RSI-SR
Wilder's RSI 계산식을 기반으로 과매수, 과매도 영역에서의
변화를 감지하여 2개의 저항과 2개의 지지의 형태로 차트에 표시 됩니다.
2. _____STOCHRSI-SR
일반적 스토캐스틱과 Wilder's RSI의 계산식을 이용하여
과매수, 과매도 영역에서의 변화를 감지하여
1개의 저항과 1개의 지지의 형태로 차트에 표시됩니다.
3. _____PV-SR
Pivot을 기반으로 한 지지와 저항을 차트에 표시 하게 되며,
기본값은 10개의 Pivot선이 그려지게 되지만 input 메뉴에서 count를 수정하여
표시할 개수를 수정할 수 있습니다.
4. _____FVG
'Fair value gaps'는 연속된 캔들 안에서의 갭 구간을 말합니다.
이 구간을 박스의 형태로 표시한 것이며,
기본값은 10개의 FVG 박스가 그려지게 되지만 input 메뉴에서 count를
수정하여 표시할 개수를 수정할 수 있습니다.
5. _____ZIGZAG
현재 트렌드의 저가와 고가를 차트에 표시하여 MDRP를 찾기 위한 것으로
1, 2, 3, 4의 지지와 저항 부근에서의 ZIGZAG 라벨은 MDRP의 신뢰도를 높혀줄 수 있습니다.
input 메뉴에서의 live 기본값은 체크되어 있지만 체크를 해제하면 종가를 확인하고 그려지기에
거짓 신호를 줄일 수 있습니다.
6. _____ICHIMOKU
ICHIMOKU의 5개의 선은 기본값인 9, 26, 52, 26으로 표시하였으며,
차트에 표시되는 선행스팬 1과 2를 제외한 전환선, 기준선, 후행스팬은 각 선의 기간값만큼만 차트에 표시 되게 하였습니다.
FairValueGap FVGWhat is a Fair Value Gap or a Gap?
There may be different explanation or reasons of gaps In Forex, my knowledge says that gaps are not very common and they are filled when ever market gets an opportunity to fill. I am trying to figure out the fair Value gap through this indicator.
Gaps are sharp breaks in price with no trading occurring in between. Gaps can happen moving up or moving down. In the forex
market, gaps primarily occur over the weekend because it is the only time the forex market closes. Gaps may also occur on very
short timeframes such as a one-minute chart or immediately following a major news announcement.
How I calculated the gaps Value?
Calculation Method of Gap used is when (low_bar(current bar)-high_bar(two bars back))>0 and (low_bar(two bars back)-high_bar(current bar))>0
The gaps are represented by the Orange and Lime color Bar height.
Do the gaps need to be filtered?
This is the most important part according to me.
Yes, the gaps need to be filtered, Since there are may gaps one after another ,In This Indicator i have used a logic to filter out unnecessary Gaps.
you will be seeing only major Important gaps which you need to focus on.
How gaps Helps?
Gaps sometimes result in corrective price action. In other words, after the gap occurs prices have a tendency to reverse and “fill” the gap.
This is what is look for.
How to use the setting of the indicator and what do they represent?
This indicator setting has 4 options
1.plot major Filtered FVG of Bullish Candles
When you check this option all major FGV will be filtered based on my logic of filtering the gaps
2.plot major Filtered FVG of Bearish Candles
When you check this option all major FGV will be filtered based on my logic of filtering the gaps
3.Plot Bar size representing the GAPS
The bars(lime and orange color) in front of candle bars are the size of the gap.
4.Plot Lines representing the GAPS
You can also visualize the recent gaps through lines , you will be able to see only 3 to 5 recent gaps through line.(not able to plot
all gaps through line because of the limit, so gaps are represented by the orange and lime color bars)
You can also change the resolution in setting of the indicator to get different time frame FGV.
Thanks to mickey1984 for guiding and helping for this concept idea.
Have any question Feel free to ask?


STAR MTF OB FVGstill working out some bugs for it to work on lower tf than 10. so for now >10m.
FVG and OB


[Sebo] FVGFixed simple Fair Value Gaps based on a single, objective definition.
This indicator displays all FVGs without optimization or sensitivity settings.
No filtering, no curve-fitting, no interpretation.
Same rules → same chart → objective market context.


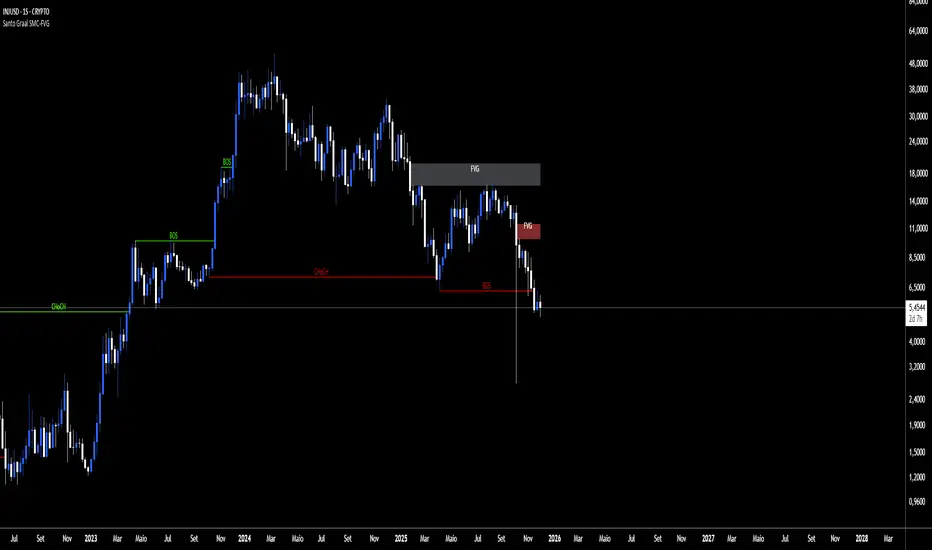
Santo Graal SMC-FVGReading Structures (BOS & CHoCH)
BOS (Break of Structure): shows the trend is still rolling.
BOS up → bullish trend.
BOS down → bearish trend.
CHoCH (Change of Character): heads‑up for a possible flip.
CHoCH up → start of an uptrend.
CHoCH down → start of a downtrend.
Playing with FVG (Fair Value Gaps)
The tool auto‑marks the fair value gaps for you.
Entry: when price comes back to fill/mitigate the gap.
Confirmation: if the gap holds, it backs up the trend direction.
Pro tip: when the bands stick tight (purple), buckle up — a big move is about to pop.

🔥 SMC Reversal Engine v3.5 – Clean FVG + Dashboard“SMC Reversal Engine v3.5 visualises HTF structure (CHoCH / BOS), swing points, FVG zones and a compact dashboard to aid Smart-Money Concept analysis. It’s for charting/education only and does NOT provide buy or sell signals.”

Đại Ka 3 ATR BandsĐại Ka 3 ATR Bands – The ultimate single-slot indicator that replaces three separate ATR plots.
Designed specifically for ICT/SMC traders in 2025:
• Light red band (±0.5 ATR) → fake moves, Judas Swing, Turtle Soup zone
• Gray band (±1.0 ATR) → normal price action
• Light green band (±2.0 ATR) → real displacement zone → Silver Bullet, SFT, high-probability entries
How to use:
– Price stuck inside red band → expect reversal/fakeout
– Price breaks and closes outside green band + volume spike → enter aggressively in that direction (85%+ win-rate inside Killzones)
Default ATR(14), subtle fills for instant visual filtering of real vs fake moves.
Perfect companion for Order Blocks, FVG, Breaker Blocks and NY/London Killzones.
Free forever – coded with love by Đại Ka & Vietnamese ICT crew.

SMC Trend Filter Strategy (EMA50/EMA200 + FVG)Overview
This strategy implements a multi-timeframe Smart Money Concept (SMC) trading system designed for intraday and swing trading.
It combines a Daily trend filter, Break of Structure (BOS) detection, Order Block (OB) zones, Fair Value Gap (FVG) confirmation, and an ATR-based trailing stop system to achieve structured and rule-based entries.
The strategy is fully automated for backtesting and allows users to evaluate SMC concepts without repainting or discretionary interpretation.
- Core Components
1. Higher-Timeframe Trend Filter (Daily EMA50/EMA200)
The strategy retrieves D1 data and determines market direction using EMA50 and EMA200:
Uptrend → EMA50 > EMA200
Downtrend → EMA50 < EMA200
Trades are only taken in the direction of the Daily trend to avoid counter-trend setups.
2. Market Structure & Break of Structure (BOS)
The strategy identifies swing highs/lows and detects when price breaks beyond them:
Bullish BOS: price closes above previous swing high
Bearish BOS: price closes below previous swing low
This forms the foundation of SMC market structure recognition.
3. Order Block Zone (OB)
Upon detecting a BOS, the strategy marks the previous candle as a potential Order Block:
For bullish BOS → OB = previous candle’s high/low
For bearish BOS → OB = previous candle’s high/low
The OB zone is visualized using a semi-transparent box extended forward


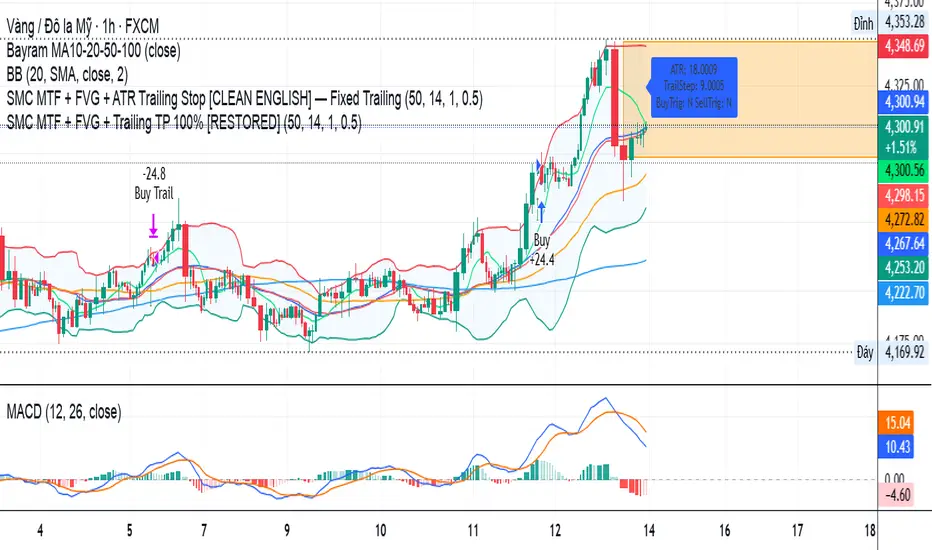
SMC MTF + FVG + Trailing TP 100% [FIXED]Component Description
Entry Timeframe: H1
Trend Filter: D1 (EMA50 vs EMA200)
Trend Filter Only enter BUY orders if EMA50 > EMA200 on D1 (uptrend)
Only enter SELL orders if EMA50 < EMA200 (downtrend)
Break of Structure (BOS) Identify the previous swing high/low breakout point
Order Block (OB) The candle area before BOS is marked with an orange box
Fair Value Gap (FVG) Check for the presence of a price gap to confirm Entry
Trailing TP Trigger trailing after reaching the desired R (in pips or ATR)
V3 9-20 Smart EMA Cross + RSI + FVG Zones (Instant Signal)V3 9-20 Smart EMA Cross + RSI + FVG Zones (Instant Signal)

Agressive Pricing Gaps (FVG/UPG,VI,OG) @MaxMaserati 3.0Aggressive Pricing Gaps (APGs 3.0)
The indicator specializes in identifying and managing price vacuums left behind when aggressive market participants rapidly move price, leaving areas that often serve as magnets for future mitigation.
1. Unfair Pricing Gaps (UPG) Analysis
The UPG logic is the indicator's main function, detecting a traditional three-candle price imbalance (FVG).
Detection Mechanism: A bullish UPG is identified when the high of candle 3 is below the low of candle 1 (with candle 2 being the expansive candle). A bearish UPG is identified when the low of candle 3 is above the high of candle 1.
Multi-Timeframe Support: UPG detection can be run on a Higher Timeframe (HTF), allowing traders to monitor significant weekly, daily, or H4 imbalances while viewing a lower execution timeframe.
Volume Filter: An optional Volume Filter based on EMA can be applied, restricting the plotting of UPGs only to those associated with volume exceeding the specified filter strength, thereby enhancing signal quality.
Sliced Mitigation: Each UPG is divided into multiple Box Slices (up to 20). This feature allows for detailed tracking of partial filling and precise visual confirmation as price moves through the gap.
2. Negative/Positive Candle Opening Gaps (OP+/-)
This logic focuses on the smaller, often immediate, gaps left between the closing price of one candle and the opening price of the next, representing minor immediate aggression or volatility.
Detection:
Positive Opening (OP+): Occurs when the current bar opens above the previous bar's close. When it happen we expect price to keep closing above it to maintain the bullish pressure.
Negative Opening (OP-): Occurs when the current bar opens below the previous bar's close. When it happen we expect price to keep closing below it to maintain the bearish pressure.
Timeframe Independence: OP Gaps can be displayed on a different timeframe from the UPG, or strictly on the chart's current timeframe.

ICT FVG Signal
During the silver bullet window, it clearly highlights when and in which direction to look for FVGs. When a signal appears, nearby FVGs or iFVGs often provide excellent entry opportunities. Feel free to share your thoughts and experiences.

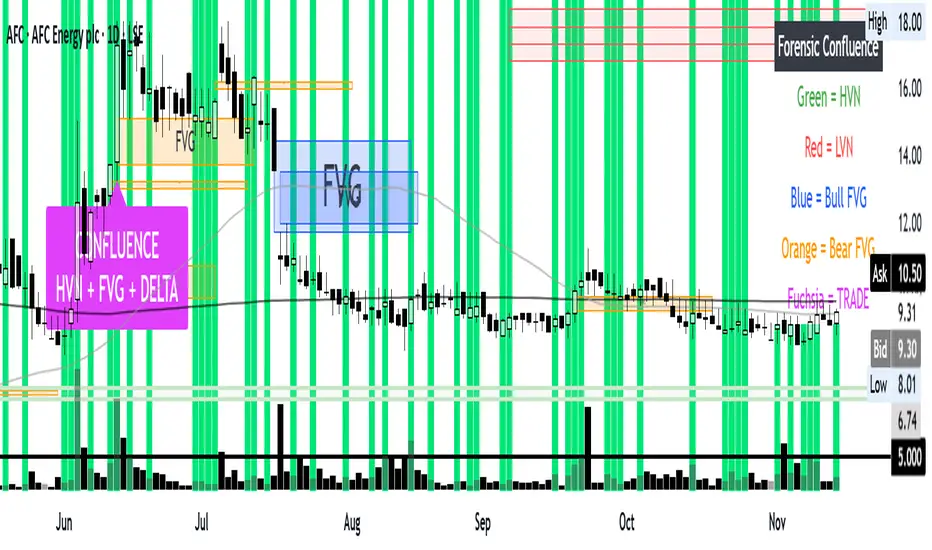
Confluence: VP + FVG + DeltaConfluence, volume profile FVG and Delta all in one chart the holy trinity.
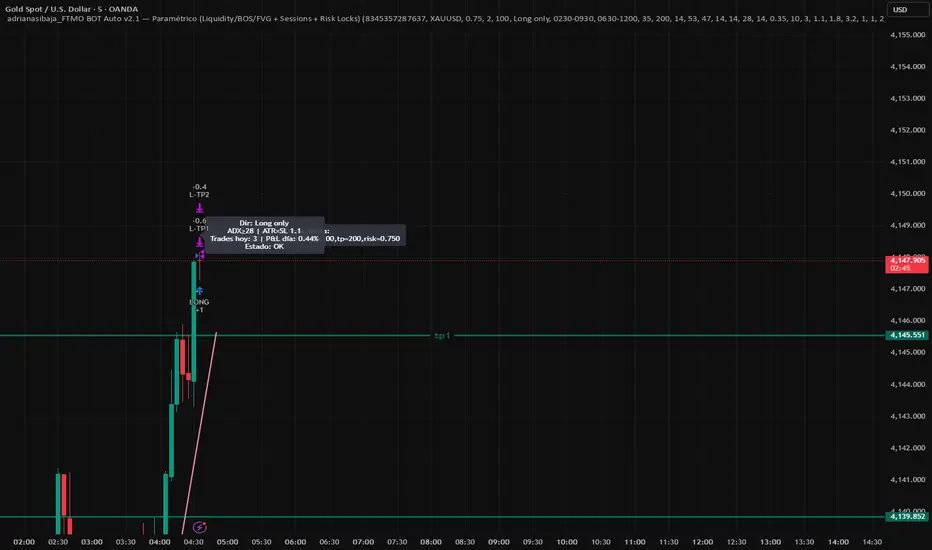
adrianasibaja_ ALGO (Liquidity/BOS/FVG + Sessions + Risk Locks)This strategy is an institutional-style automated trading system designed for XAU/USD and FTMO-funded accounts.
It combines liquidity sweeps, Break of Structure (BOS) and Fair Value Gap (FVG) confirmations with multi-filter confluences (RSI, ADX, ATR, EMA trend bias, and candle quality).
The algorithm automatically filters trades by session (London/New York), day of week, and volatility. It includes full FTMO risk management features such as daily loss lock, consecutive loss lock, and trade cooldowns.
Smart 9-15 EMA Cross + RSI + FVG Zones (Instant Signal)Smart 9-15 EMA Cross + RSI + FVG Zones (Instant Signal)

[Hosein] Support & Resistance Zones + FVGAdjustable FVG gap size and extension.
Option to ignore narrow gaps.
Option to ignore fully crossed gaps.
Show/hide FVGs.
Customizable colors with initial opacity.
Ideal for traders looking for supply/demand imbalance zones.
