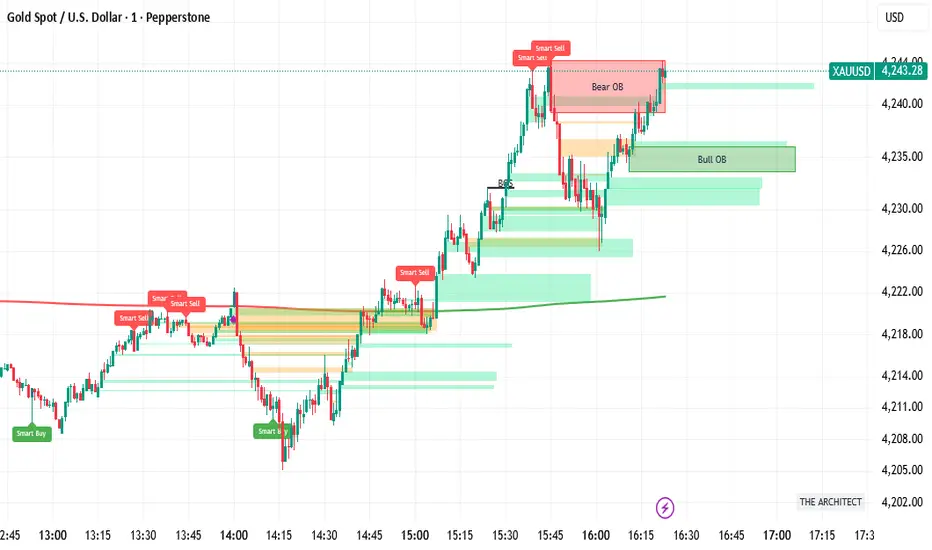
FVH THE ARCHITECT (The Consensus)HE ARCHITECT - Institutional Logic Engine
System Philosophy: THE ARCHITECT is a defensive consensus engine designed to filter market noise and align price structure with institutional momentum. It does not generate signals in isolation; it requires a "Consensus" between Price Action, Volume, and Divergence before confirming a setup.
Core Features:
Institutional Structure: Automatically identifies Order Blocks (Bull/Bear), Fair Value Gaps (FVG), and Break of Structure (BOS) based on fractal logic.
Smart Consensus Filter:
Smart VWAP: Color-coded trend filter (Green = Up, Red = Down).
Volume Spikes: Identifies institutional injection (Purple Candles) at >1.5x average volume.
Smart Reversals: RSI Divergence labels are only printed if the candle color confirms the rejection.
Focus Mode: A toggle to switch between "History Mode" (Context) and "Focus Mode" (Active Zones Only) to reduce chart clutter.
How to Use:
Buy: Wait for price to enter a Green Bull OB. Look for a "Smart Buy" label or Purple Volume Spike.
Sell: Wait for price to enter a Red Bear OB. Look for a "Smart Sell" label.
Alerts: Includes hard-coded alerts for "Smart Buy", "Smart Sell", and "Volume Spikes" for automated notifications.
Recherche dans les scripts pour "fvg"
SMC Pro [Stansbooth]
🔮 SMC × Fibonacci Confluence Engine — The Hidden Algorithm of the Markets
Welcome to a level of chart analysis where mathematics , market psychology , and institutional logic merge into one ultra-intelligent system.
This indicator decodes the true structure of price delivery by combining Smart Money Concepts with the timeless precision of Fibonacci ratios , revealing what retail traders can’t see — *the algorithmic heartbeat of the market*.
✨ What Makes This Indicator Different
Instead of drawing random lines or reacting to late signals, this tool **anticipates** market behavior by reading the footprints left behind by institutional algorithms. Every element is placed with purpose — every zone, every shift, every fib level — all forming a seamless narrative that explains *why* price moves the way it does.
🔥 Core Intelligence Features
Advanced BOS/CHOCH Auto-Detection — Spot structure shifts before momentum even forms.
Institutional Liquidity Mapping
— Identify liquidity pools, engineered sweeps, equal highs/lows, and trap zones designed by smart money.
Fibonacci-Aligned Precision Zones
— Auto-generated fib grids synced with SMC levels for pinpoint reversal and continuation setups.
Imbalance Engine
— FVGs, displacement, inefficiencies, and mitigation blocks displayed with crystal clarity.
Premium/Discount Algorithm
— Understand instantly whether price is in a zone of accumulation or distribution.
🚀 Designed for Traders Who Want an Edge
Whether you're scalping fast moves, capturing intraday swings, or holding higher-timeframe plays, this indicator provides a professional lens into the market. It turns complex price action into a structured, predictable system where every move has logic and every entry has confluence.
You don’t just see the chart —
you see the intention behind every push, pull, manipulation, and reversal.
💎 Why It Feels Like a Cheat Code
Because it mirrors the way institutions analyze the market:
— Identify liquidity
— Seek equilibrium
— Deliver price
— Create inefficiency
— Mitigate
— Continue the narrative
Using SMC and Fibonacci together unlocks the “algorithmic geometry” behind price movement, giving you clarity where others see chaos.
⚡ Trade With Confidence, Confluence & Control
This indicator isn’t just a tool.
It’s a complete trading framework — structured, intelligent, and deadly accurate.
Master the markets.
Decode the algorithm.
Trade like smart money .

ICT POIs By DSIndicator to identify POI's like OB/FVG and SCOB. It also have a different ATR based filters and inside bar logic for OB detection

Rolling Volume Profile [Matrix Volume Heatmap] by NXT2017Description
This indicator offers a unique visual approach to Volume Profile analysis. Instead of the traditional histogram bars or boxes, this script renders a Rolling Volume Profile as a background "Matrix Heatmap" directly on your chart.
By dividing the price action of the most recent N-candles into 30 horizontal zones (buckets), it visualizes where the most trading activity has occurred within your defined lookback period. The visualization uses dynamic transparency to highlight the Point of Control (POC) and high-volume nodes, while fading out low-volume areas.
🧠 How it Works
The script operates on a "Rolling Window" basis, meaning it recalculates the profile at every bar to reflect the immediate market context.
Dynamic Range: It calculates the highest High and lowest Low of the user-defined Lookback Length (default: 1000 bars).
Bucket Slicing: This vertical range is divided into 30 equal price buckets.
Volume Distribution (Overlap Logic): The script iterates through the historical data. If a candle is large and spans multiple buckets, its volume is distributed proportionally across those buckets. This ensures a more realistic profile compared to simply assigning volume to the close price.
Heatmap Visualization:
The script calculates the Maximum Volume (POC) within the profile.
It uses a Reference Length to normalize this maximum.
Dynamic Opacity: Zones with volume close to the maximum are rendered opaque (solid). Zones with low relative volume become highly transparent. This creates an automatic "Heatmap" effect, allowing you to instantly spot the most significant price levels.
⚙️ Settings
Lookback Length (candles): Defines how far back the profile calculates volume (e.g., 1000 bars).
POC Reference Length: Defines the smoothing window for the 100% volume baseline. Increasing this stabilizes the color changes; decreasing it makes the heatmap more reactive to sudden volume spikes.
Profil Color: Choose the base color for the matrix. The transparency is calculated automatically.
💡 Use Case
This tool is ideal for traders who want to see the "Value Area" of the current range without cluttering the chart with complex boxes or side-bars. It works excellent as a background context tool to identify:
High Volume Nodes (Support/Resistance)
Low Volume Nodes (Price gaps/Rejection areas)
Migrating Points of Control (Trend direction)

LSI Slim - EMA4/8 + Volume Filter + Sweep Targets V1📌 LSI Slim – EMA4/8 + Volume Filter + Sweep Targets
LSI Slim is a lightweight but highly effective market-structure tool that combines liquidity sweep detection, volume confirmation, higher-TF EMA signals, and dynamic target generation.
It is designed for traders who want a clean chart, fast confirmation, and objective target levels derived from real market behavior.
🔍 Key Features
1. Liquidity Sweep Detection
Automatically identifies simple bullish and bearish liquidity sweeps using recent swing extremes.
Each sweep is stored and plotted with optional fading lines to visually track market intent.
2. EMA 4/8 Confirmation (Higher Timeframe)
Built-in higher-timeframe confirmation using EMA 4 and EMA 8 crossovers.
Cross signals can optionally display labels and debug markers.
3. Adaptive Volume Filter
Two selectable volume-strength modes:
Incremental z-score increase
Negative-to-positive transition
The volume filter acts as an additional confirmation layer for sweep validations.
4. Intelligent Target Generation
Once a sweep is confirmed:
Targets (TP1–TP4) are projected using daily range or ATR fallback
Optional FVG override automatically snaps TP1 to the nearest Fair Value Gap when relevant
Targets are rendered with adjustable opacity and forward extension
5. Clean Visual Interface
Designed to stay lightweight and non-intrusive:
Adjustable max number of sweep lines
Optional fading for older levels
Minimalistic labels and shapes for clarity
🎯 Ideal For
Liquidity-based traders
Market structure practitioners
EMA-trend traders
Volume confirmation strategies
Intraday and swing trading across all markets
⚠️ Disclaimer
This script is for educational purposes only and does not constitute financial advice.
Always test on historical data and use proper risk management.

Ghost Robo [Bit2Billions]Ghost Robo — Automated Gap-Based Trading System
*An intelligent, fully automated trading strategy designed to identify high-probability opportunities using fair-value gaps, volume, and price action—without adding clutter to your chart.*
Ghost Robo combines gap detection, volume analysis, and smart entry logic into a single, streamlined system. It executes trades cleanly while offering backtesting, position sizing, alerts, and risk management—all internally. The strategy is engineered to maximize precision and reduce noise, giving traders an actionable, automated trading workflow.
Key Features
1. Automatic Gap Analysis
* Detects bullish and bearish fair-value gaps internally for trade logic.
* Evaluates gap “fill” percentages against configurable thresholds for high-probability entries.
2. Volume-Based Decision Making
* Integrates buying and selling activity to assess the strength of each gap.
* Filters trades based on real-time volume analysis for reliable execution.
3. Smart Entry Rules
* Trades are triggered automatically based on gap characteristics, candle confirmation, and user-defined thresholds.
* Queue management and deduplication avoid repeated trades on the same opportunity.
4. Flexible Filters
* Conditions include volume, bull/bear balance, gap age, and candle patterns.
* Allows traders to tune the strategy for their preferred market conditions.
5. Built-in Risk Management
* Stop-loss enforcement, optional trailing stops, and single-position restrictions.
* Ensures disciplined execution and controlled risk exposure.
6. Clean, No-Visual Execution
* All gap detection and calculations occur internally; charts remain uncluttered.
* Ideal for traders who prefer automated logic without additional chart overlays.
What Ghost Robo Solves
* Automates gap-based trading strategies with precision.
* Ensures disciplined entries using multiple filters and predictive gap logic.
* Reduces repeated trades and focuses on high-quality opportunities.
* Provides a complete system for backtesting, alerts, and position management.
Recommended Timeframes & Markets
* Timeframes: 15m and higher (15m, 1H, 4H, Daily). Works on intraday but benefits from higher timeframe structure.
* Markets: Liquid FX pairs, major crypto, indices, and liquid equities.
* Notes: For illiquid instruments, tighten volume filters or use higher timeframes for cleaner signals.
Inputs & Settings
* Default settings pre-configured
* Simple Show/Hide toggles for modules
* Minimal exposed fields for ease of use
Recommended Timeframes & Markets
* Works best on 15M, 1H, 4H, Daily, and higher
* Suitable across forex, crypto, indices, and liquid equities
* Pivot-based modules may show noise on illiquid assets
Performance & Limitations
* May draw many objects → disable unused modules for speed
* Refresh the chart if historical buffer issues occur
* TradingView platform limitations handled internally
License & Legal
* Proprietary © 2025
* Redistribution, resale, or disclosure prohibited
* Independently developed with proprietary extensions
* Any resemblance to other tools may result from public-domain concepts
Respect & Transparency
* Built on widely recognized public trading concepts.
* Developed with respect for the TradingView community.
* Any overlaps or similarities can be addressed constructively.
Disclaimer
* Educational purposes only
* Not financial advice
* Trading carries risk — always use paper testing and proper risk management
FAQs
* Source code is not public
* Works best on 15m, 1H, 4H, Daily, Weekly charts
* Modules can be hidden/shown with toggles
* Alerts can be set up manually by users
* Supports multiple markets: forex, crypto, indices, and equities
About Ghost Trading Suite
Author: BIT2BILLIONS
Project: Ghost Trading Suite © 2025
Indicators: Ghost Matrix, Ghost Protocol, Ghost Cipher, Ghost Shadow
Strategies: Ghost Robo, Ghost Robo Plus
Pine Version: V6
The Ghost Trading Suite is designed to simplify and automate many aspects of chart analysis. It helps traders identify market structure, divergences, support and resistance levels, and momentum efficiently, reducing manual charting time.
The suite includes several integrated tools — such as Ghost Matrix, Ghost Protocol, Ghost Cipher, Ghost Shadow, Ghost Robo, and Ghost Robo Plus — each combining analytical modules for enhanced clarity in trend direction, volatility, pivot detection, and momentum tracking.
Together, these tools form a cohesive framework that assists in visualizing market behavior, measuring momentum, detecting pivots, and analyzing price structure effectively.
This project focuses on providing adaptable and professional-grade tools that turn complex market data into clear, actionable insights for technical analysis.
Crafted with 💖 by BIT2BILLIONS for Traders. That's All Folks!
Changelog
v1.0 – Core Release
* Introduced fully automated gap-based strategy using fair-value gaps (FVGs) for trade logic.
* Added internal volume analysis to evaluate bullish/bearish strength for each gap.
* Implemented smart entry triggers based on gap “fill” percentages.
* Added configurable filters for volume, bull/bear balance, age of gap, candle confirmation, and cooldown between trades.
* Introduced queue management & deduplication, ensuring only the most relevant gaps are traded and repeated entries are avoided.
* Implemented risk management features, including percentage stop-loss, optional trailing stops, and single-position enforcement.
* Fully non-visual execution, keeping charts clean while all gap detection and trade calculations happen internally.
* Enabled backtesting, position sizing, and alert creation for complete strategy management.

Displacement + FVG + Structure Break (ICT-style)Identifies the displacement candle. Can be used in conjunction with 1 min chart to identify true displacement

Opening Range ICT 3-Bar FVG + Engulfing Signals (Overlay)Beta testing
open range break out and retest of FVG.
Still working on making it accurate so bear with me

Imbalance Heatmap (Free) – pc75A clean, efficient visualisation of liquidity voids, 3-bar imbalances, and price inefficiency zones.
This indicator highlights where the market left gaps in the order flow — areas price often revisits to rebalance.
Imbalances are displayed as stacked horizontal “heatmap strips,” making it easy to see:
Where aggressive buying/selling left a void
Whether multiple voids overlap (stronger zones)
Whether price is likely to return to fill the imbalance
How old a void is (older zones are marked differently)
This is a refined v6 rewrite based on a script I liked, completely modernised with cleaner logic, better performance, and optional labels.
🔍 Features
3-bar liquidity void detection (ICT-style logic)
Bullish imbalance when price displaces upward with no wick overlap
Bearish imbalance for downward displacement
✔ Heatmap-style visualisation
Each imbalance is sliced into multiple thin horizontal bands to create a visual density effect.
✔ Stacking intelligence
If a new void overlaps previous ones, the heatmap is drawn brighter, showing areas where the market left multiple inefficiencies.
✔ “Void xN” labels
Optional labels show how many overlapping voids existed at the moment the imbalance formed.
✔ Automatic deletion when filled
As soon as price trades back through a slice, that slice is removed.
This keeps the chart clean and focuses only on active inefficiencies.
✔ Smart ageing
Older voids are marked with a subtle border so you can distinguish freshly formed inefficiencies from historical ones.
✔ Alerts
Set alerts for when price taps a stacked imbalance zone (“Void x2” and above).
⚙ Inputs & Customisation
ATR threshold (optional)
Minimum tick size gap
Number of heatmap slices
Bullish / bearish toggles
Label toggles
Colour and transparency configuration
Max slice memory for performance
💡 How to Use
Imbalance zones often behave as:
Magnets → price gravitates toward them
Support/resistance → structure respects inefficiencies
Continuity points → used with market structure shifts
Targets → for both scalpers and swing traders
Strong (stacked) voids typically represent areas of institutional displacement, where the market is more likely to return for rebalancing.
📢 Notes
This is the free version.
Educational only — not financial advice.

Breaker Blocks [TakingProphets]Breaker Blocks
Smart Money “breaker” zones automatically mapped on your chart.
This tool is designed for traders who use ICT / Smart Money concepts and want a clean, automated way to see breaker blocks form and evolve in real time.
-----------------------------------------------------------------------------------------------
🔍 What this indicator does
The script automatically detects potential bullish and bearish breaker blocks after a market structure shift, then draws and maintains those zones on your chart:
-Plots bullish breaker blocks as green shaded zones.
-Plots bearish breaker blocks as red shaded zones.
-Optionally shows the 50% (midline) of each breaker for refinement.
-Keeps a rolling list of the most recent breakers and removes older ones to keep your chart clean.
-Optionally hides breakers once price closes through them (invalidation), so only active zones remain.
It’s built to work on any symbol and any timeframe. Lower timeframes will naturally generate more breakers; higher timeframes will show fewer, more significant zones.
Important: This script does not open, manage, or close trades for you. It only visualizes price zones that may be relevant to your own strategy and analysis.
-----------------------------------------------------------------------------------------------
🧠 Core logic (high level)
Under the hood, the indicator:
Uses an internal zigzag swing structure to track major pivot highs and lows.
Watches for a market structure shift (MSS):
Bullish MSS: price closes above a prior swing high.
Bearish MSS: price closes below a prior swing low.
Once an MSS is confirmed, it:
Locates the relevant impulse candle(s) that price traded through.
Defines the breaker block using the high/low (or body vs. wick, based on internal settings).
Draws a breaker box from that origin forward in time.
Each breaker is stored as an internal object with:
Direction (bullish or bearish)
Top and bottom prices
Visual boxes and an optional midline
On every new candle, all active breakers are updated:
Extended forward as new bars print.
Optionally invalidated and deleted if price closes back through the breaker in the opposite direction.
This gives you a dynamic map of which breaker blocks are still “respected” by price and which have failed.
-----------------------------------------------------------------------------------------------
⚙️ Key Inputs & Settings
All user-facing options are grouped under “Breaker Blocks” for a clean UI.
-Display Breaker Block
Toggle the visualization on/off without removing detection logic.
-Bullish Color / Bearish Color
Choose the fill color for bullish and bearish breaker zones.
-Show 50% Line
Plots a dashed line at the mid-point of each breaker block.
Helpful if you use the 50% level as a refinement or entry anchor.
-Max Visible
Limits how many of the most recent breaker blocks stay on the chart.
Older breakers are deleted once this limit is exceeded (keeps things clean and lightweight).
-Hide When Invalidated
If enabled:
Bullish breaker is hidden once price closes below its low.
Bearish breaker is hidden once price closes above its high.
If disabled, breakers remain visible even after those closes (for study / backtesting purposes).
These options allow you to run the tool in either a minimal, current-context only mode, or a more historical, educational mode.
-----------------------------------------------------------------------------------------------
🧭 How traders might use it
Some common ways traders may incorporate breaker blocks into their own plans:
As context zones around which to look for entries using their personal triggers.
As potential support/resistance areas after a shift in structure.
To visually separate active vs. invalidated zones instead of manually redrawing them.
In confluence with other SMC tools (FVGs, liquidity pools, PD arrays, etc.) and higher-timeframe bias.
This indicator is intended as a visual aid and works best when combined with a complete trading plan, risk management rules, and your own discretion.
-----------------------------------------------------------------------------------------------
⚠️ Disclaimer
This indicator does not guarantee profits or specific outcomes.
It is provided for educational and informational purposes only.
Past price behavior around breaker blocks does not imply future results.
Always test any tool on a demo account or in a simulated environment before using it with real capital.
Trading involves risk, and you are solely responsible for your own decisions.

Tempo's Trades IFVG Mastery IndicatorThe indicator I use is called IFVG Mastery. Below you can find all of the features, Automatically maps 50% of the daily range level, Marks out all equal highs and equal lows, Marks out all session killzones, Plots all FVG and IFVGs.
We will constantly a

TH-SixPair Engine v6.3ระบบ Multi-pair EMA + ATR x1.5 สำหรับ XAUUSD, GBPUSD, EURUSD, USDJPY, USDCAD, AUDUSD
– ใช้ EMA 8/21 + EMA เทรนด์ 50 + RSI filter + Session filter
– มีโหมด Pending + Extra Entry (EMA pullback / Swing HL retest / FVG retest)
– จัดการ TP1/TP2 แบบ partial + BE อัตโนมัติ
– มีตารางแสดง SL/TP1/TP2 เป็น USD สำหรับ lot 0.01 และสถิติย้อนหลัง 10 ออเดอร์
แนะนำใช้ TF 1H เป็นหลัก

Volume Threshold Levels - Crypto LidyaVolume Threshold Levels – Crypto Lidya
Understanding volume behavior is one of the most effective ways to detect trend changes, manipulation candles, aggressive entries, and institutional activity.
Volume Threshold Levels (VTL) not only displays raw volume but also calculates dynamic volume thresholds (2x – 3x – 4x) based on the moving average, allowing you to identify statistically meaningful volume anomalies with precision.
📌 1. Volume Columns
The indicator plots each bar’s volume using traditional column-style visualization.
Green: Bullish candle
Red: Bearish candle
Gray: Neutral candle
This helps traders clearly understand the relationship between price and volume.
📌 2. Average Volume Area
VTL offers two types of moving averages for volume:
SMA (Simple Moving Average)
EMA (Exponential Moving Average)
The average volume is drawn as a soft yellow area across the chart.
This area acts as the baseline for normal volume levels.
📌 3. Dynamic Threshold Lines (2x / 3x / 4x)
The script calculates and displays multipliers of the average volume:
2x Average
3x Average
4x Average
These levels appear as bright yellow lines.
They are extremely useful for identifying breakouts, traps, and aggressive institutional entries.
📌 4. Volume Spike Detection (Alerts)
VTL identifies upward crossovers where volume breaks above key levels:
1x Volume Signal
2x Volume Signal
3x Volume Signal
4x Volume Signal
These can be used directly as TradingView alerts.
This allows you to automate detection of high-impact volume spikes.
📌 5. Use Cases
The indicator performs exceptionally well in:
Breakout confirmation
Liquidity sweep analysis
Detecting manipulation candles
Combining with OB, FVG, or other SMC structures
Scalping and low-timeframe aggressive volume interpretation
Algorithmic filters for volume-based strategies
📌 6. Summary
VTL delivers:
✔ Dynamic average volume baseline
✔ Clear 2x–3x–4x volume thresholds
✔ Accurate detection of upside volume explosions
✔ A strong tool for traders who rely on volume confirmation
Completely open-source and ready to be extended.

Tesseract X-RayTesseract X-Ray — Smart Money Concept indicator that reveals hidden market structure.
Features:
• Fair Value Gaps (FVG) — imbalance zones where price tends to return
• Order Blocks (OB) — institutional supply/demand zones
• Volume Profile — POC, VAH, VAL levels
• High Volume Nodes (HVN) — liquidity clusters
Clean visualization with automatic zone detection and mitigation tracking.
Built-in alerts for key level touches.
by @TesseractCrypto

P_NQ Futures Daily Bias & Structure ProOverview The Master Sniper is a professional-grade execution system designed for high-volatility assets like NQ (Nasdaq 100) and ES (S&P 500). Unlike standard indicators that generate blind signals, this script uses a Multi-Timeframe Logic Engine to first establish a daily bias and then hunt for specific intraday triggers.
It features a Hybrid Strategy that can automatically switch between Trend Following (Smart Money Concepts) and Mean Reversion (Gap Fades), giving you a complete toolkit for any market condition.
Key Features
1. Macro Bias Engine (The Filter) Before generating any signal, the script analyzes the Daily Chart in the background:
Structure: Checks for Higher Highs/Lows vs. Lower Highs/Lows.
Momentum: Uses RSI and the 200 EMA to ensure you aren't buying the top or selling the bottom.
Result: It generates a directional bias (Bullish/Bearish) that filters out low-probability trades.
2. Hybrid Entry Logic
Trend Mode (SMC): Identifies Fair Value Gaps (FVG) within "Discount" or "Premium" zones. It only triggers if the price pulls back into a value area aligned with the Daily Bias.
Reversal Mode (Elasticity): Detects when price is over-extended (2.0 Standard Deviations from VWAP) or when a "Liquidity Sweep" occurs, signaling a snap-back trade.
Gap Rejection (Morning Fade): A dedicated engine that monitors the Opening Gap. If the market gaps significantly but fails to hold, it triggers a "Fade" trade to target the gap fill.
3. Professional Trade Management Visualizes your trade plan instantly on the chart:
Split Targets: Draws targets for Contract 1 (Scalp) and Contract 2 (Runner).
Auto-Break Even: The moment TP1 is hit, the Stop Loss line visually moves to your Entry Price, signaling a "Risk-Free" trade.
Infinite Target Lines: Extends target lines to the right until the trade concludes, keeping your chart clean.
4. Risk Filters
Range Filter: Prevents buying in the Top 1/3 or selling in the Bottom 1/3 of the daily range.
Proximity Filter: Blocks trades that are squeezing too tight against the 100-candle High/Low.
How to Use
Timeframe: Optimized for the 5-Minute (5m) chart on Futures (NQ/ES) or Tech Stocks.
Dashboard: Check the bottom-right panel. Ensure "Status" says "SCANNING" and Filters show "Active."
Execution: Wait for the alert (e.g., "🟢 ENTER LONG"). Place your orders at the Blue Line with SL at the Red Line.

TMT ICT SMC - Hitesh NimjeTMT ICT SMC - Smart Money Concepts
Overview
T
he TMT ICT SMC indicator is a comprehensive, all-in-one toolkit designed for traders utilizing Smart Money Concepts (SMC) and Inner Circle Trader (ICT) methodologies. Developed by Hitesh Nimje (Thought Magic Trading), this script automates the complex task of market structure mapping, order block identification, and liquidity analysis, providing a clear, institutional-grade view of price action.
Whether you are a scalper looking for internal structure shifts or a swing trader analyzing major trend reversals, this tool adapts to your timeframe with precision.
Key Features
1. Market Structure Mapping (Internal & Swing)
* Real-Time Structure: Automatically detects and labels BOS (Break of Structure) and CHoCH (Change of Character).
* Dual-Layer Analysis:
I nternal Structure: Captures short-term momentum and minor shifts for entry refinement.
Swing Structure: Identifies the overarching trend and major pivot points.
* Strong vs. Weak Highs/Lows: visualizes significant swing points to help you identify safe invalidation levels.
* Trend Coloring: Optional feature to color candles based on the active market structure trend.
2. Advanced Order Blocks (OB)
* Auto-Detection: Plots both Internal and Swing Order Blocks automatically.
* Smart Filtering: Includes an ATR or Cumulative Mean Range filter to remove noise and only display significant institutional footprint zones.
* Mitigation Tracking: Choose how order blocks are mitigated (Close vs. High/Low) to keep your chart clean.
3. Liquidity & Gaps
* Fair Value Gaps (FVG): Automatically highlights bullish and bearish imbalances. Includes MTF (Multi-Timeframe) capabilities to see higher timeframe gaps on lower timeframe charts.
* Equal Highs/Lows (EQH/EQL): Marks potential liquidity pools where price often reverses or targets.
4. Multi-Timeframe Levels
* Plots Daily, Weekly, and Monthly High/Low levels directly on your chart to help identify macro support and resistance without switching timeframes.
5. Premium & Discount Zones
* Automatically plots the Fibonacci range of the current price leg to show Premium (expensive), Discount (cheap), and Equilibrium zones, aiding in high-probability entry placement.
Customization
* Style: Switch between a "Colored" vibrant theme or a "Monochrome" minimal theme.
* Control: Every feature can be toggled on/off. Adjust lookback periods, sensitivity thresholds, and colors to match your personal trading style.
* Modes: Choose between "Historical" (for backtesting) and "Present" (for optimized real-time performance).
How to Use
* Trend Confirmation: Use the Swing Structure labels to determine the higher timeframe bias.
* Entry Trigger: Wait for a CHoCH on the Internal Structure within a higher timeframe Order Block or FVG.
* Targeting: Use the Equal Highs/Lows (Liquidity) or opposing Order Blocks as take-profit zones.
Credits
* Author: Hitesh Nimje
* Source: Thought Magic Trading (TMT)
TRADING DISCLAIMER
RISK WARNING
Trading involves substantial risk of loss and is not suitable for all investors. Past performance is not indicative of future results. You should carefully consider whether trading is suitable for you in light of your circumstances, knowledge, and financial resources.
NO FINANCIAL ADVICE
This indicator is provided for educational and informational purposes only. It does not constitute:
* Financial advice or investment recommendations
* Buy/sell signals or trading signals
* Professional investment advice
* Legal, tax, or accounting guidance
LIMITATIONS AND DISCLAIMERS
Technical Analysis Limitations
* Pivot points are mathematical calculations based on historical price data
* No guarantee of accuracy of price levels or calculations
* Markets can and do behave irrationally for extended periods
* Past performance does not guarantee future results
* Technical analysis should be used in conjunction with fundamental analysis
Data and Calculation Disclaimers
* Calculations are based on available price data at the time of calculation
* Data quality and availability may affect accuracy
* Pivot levels may differ when calculated on different timeframes
* Gaps and irregular market conditions may cause level failures
* Extended hours trading may affect intraday pivot calculations
Market Risks
* Extreme market volatility can invalidate all technical levels
* News events, economic announcements, and market manipulation can cause gaps
* Liquidity issues may prevent execution at calculated levels
* Currency fluctuations, inflation, and interest rate changes affect all levels
* Black swan events and market crashes cannot be predicted by technical analysis
USER RESPONSIBILITIES
Due Diligence
* You are solely responsible for your trading decisions
* Conduct your own research before using this indicator
* Verify calculations with multiple sources before trading
* Consider multiple timeframes and confirm levels with other technical tools
* Never rely solely on one indicator for trading decisions
Risk Management
* Always use proper risk management and position sizing
* Set appropriate stop-losses for all positions
* Never risk more than you can afford to lose
* Consider the inherent risks of leverage and margin trading
* Diversify your portfolio and trading strategies
Professional Consultation
* Consult with qualified financial advisors before trading
* Consider your tax obligations and legal requirements
* Understand the regulations in your jurisdiction
* Seek professional advice for complex trading strategies
LIMITATION OF LIABILITY
Indemnification
The creator and distributor of this indicator shall not be liable for:
* Any trading losses, whether direct or indirect
* Inaccurate or delayed price data
* System failures or technical malfunctions
* Loss of data or profits
* Interruption of service or connectivity issues
No Warranty
This indicator is provided "as is" without warranties of any kind:
* No guarantee of accuracy or completeness
* No warranty of uninterrupted or error-free operation
* No warranty of merchantability or fitness for a particular purpose
* The software may contain bugs or errors
Maximum Liability
In no event shall the liability exceed the purchase price (if any) paid for this indicator. This limitation applies regardless of the theory of liability, whether contract, tort, negligence, or otherwise.
REGULATORY COMPLIANCE
Jurisdiction-Specific Risks
* Regulations vary by country and region
* Some jurisdictions prohibit or restrict certain trading strategies
* Tax implications differ based on your location and trading frequency
* Commodity futures and options trading may have additional requirements
* Currency trading may be regulated differently than stock trading
Professional Trading
* If you are a professional trader, ensure compliance with all applicable regulations
* Adhere to fiduciary duties and best execution requirements
* Maintain required records and reporting
* Follow market abuse regulations and insider trading laws
TECHNICAL SPECIFICATIONS
Data Sources
* Calculations based on TradingView data feeds
* Data accuracy depends on broker and exchange reporting
* Historical data may be subject to adjustments and corrections
* Real-time data may have delays depending on data providers
Software Limitations
* Internet connectivity required for proper operation
* Software updates may change calculations or functionality
* TradingView platform dependencies may affect performance
* Third-party integrations may introduce additional risks
MONEY MANAGEMENT RECOMMENDATIONS
Conservative Approach
* Risk only 1-2% of capital per trade
* Use position sizing based on volatility
* Maintain adequate cash reserves
* Avoid over-leveraging accounts
Portfolio Management
* Diversify across multiple strategies
* Don't put all capital into one approach
* Regularly review and adjust trading strategies
* Maintain detailed trading records
FINAL LEGAL NOTICES
Acceptance of Terms
* By using this indicator, you acknowledge that you have read and understood this disclaimer
* You agree to assume all risks associated with trading
* You confirm that you are legally permitted to trade in your jurisdiction
Updates and Changes
* This disclaimer may be updated without notice
* Continued use constitutes acceptance of any changes
* It is your responsibility to stay informed of updates
Governing Law
* This disclaimer shall be governed by the laws of the jurisdiction where the indicator was created
* Any disputes shall be resolved in the appropriate courts
* Severability clause: If any part of this disclaimer is invalid, the remainder remains enforceable
REMEMBER: THERE ARE NO GUARANTEES IN TRADING. THE MAJORITY OF RETAIL TRADERS LOSE MONEY. TRADE AT YOUR OWN RISK.
Contact Information:
* Creator: Hitesh_Nimje
* Phone: Contact@8087192915
* Source: Thought Magic Trading
© HiteshNimje - All Rights Reserved
This disclaimer should be prominently displayed whenever the indicator is shared, sold, or distributed to ensure users are fully aware of the risks and limitations involved in trading.
