ICT Fair Value Gap (FVG) DetectorFair Value Gap (FVG) Indicator
Purpose: Highlights price gaps between three consecutive candles, which signal areas of imbalance that may later act as support or resistance.
How It Works: The script looks for a gap between the high of two bars ago and the low of the current bar (bullish FVG) or the low of two bars ago and the high of the current bar (bearish FVG).
Visuals: These gaps are marked as transparent boxes on the chart, extended to the right until they are "filled" or mitigated by price returning into the gap.
Customization: You can adjust which gaps show, their colors, thresholds, and other display options.
Recherche dans les scripts pour "fvg"

Imbalance(FVG) DetectorImbalance (FVG) Detector
Overview
The Imbalance (FVG) Detector is a technical analysis tool designed to highlight price inefficiencies by identifying Fair Value Gaps (FVGs). These gaps occur when rapid price movement leaves an area with little to no traded volume, which may later act as a zone of interest. The indicator automatically detects and marks these imbalances on the chart, allowing users to observe historical price behavior more effectively.
Key Features
- Automatic Imbalance Detection: Identifies bullish and bearish imbalances based on a structured three-bar price action model.
- Customizable Sensitivity: Users can adjust the minimum imbalance percentage threshold to tailor detection settings to different assets and market conditions.
- Real-time Visualization: Marked imbalances are displayed as colored boxes directly on the chart.
- Dynamic Box Updates: Imbalance zones extend forward in time until price interacts with them.
- Alert System: Users can set alerts for when new imbalances appear or when price tests an existing imbalance.
How It Works
The indicator identifies market imbalances using a three-bar price structure:
- Bullish Imbalance: Occurs when the high of three bars ago is lower than the low of the previous bar, forming a price gap.
- Bearish Imbalance: Occurs when the low of three bars ago is higher than the high of the previous bar, creating a downward gap.
When an imbalance is detected:
- Green Boxes indicate bullish imbalances.
- Red Boxes indicate bearish imbalances.
- Once price interacts with an imbalance, the box fades to gray, marking it as tested.
! Designed for Crypto Markets
This indicator is particularly useful in crypto markets, where frequent volatility can create price inefficiencies. It provides a structured way to visualize gaps in price movement, helping users analyze historical liquidity areas.
Customization Options
- Min Imbalance Percentage Size: Adjusts the sensitivity of the imbalance detection.
- Alerts: Users can enable alerts to stay notified of new or tested imbalances.
Important Notes
- This indicator is a technical analysis tool and does not provide trading signals or financial advice.
- It does not predict future price movement but highlights historical price inefficiencies.
- Always use this tool alongside other market analysis methods and risk management strategies.

STIC bullish and bearish hunter with FVGSmart Trading and Investment Companion (STIC) is a sophisticated tool designed to identify and visualize inducement, market structure, market trends, track liquidity, and project and forecast price action for all applicable assets. it has been tested to work on all timeframes and has been traded on stock, forex, and crypto assets.
This script is an upgraded version of previous STIC indicator, which you can use in addition to it or separately as you deem fit
Traders/ investor that are familiar with market structure, inducement, candlestick psychology, trend-following indicatorsand Fair Value Gap FVG will find it easy to adopt this trading and investment companion. As stated below, this is how it works.
Features and how to use
1st of all, after adding the indicator to yoursuperchart, you want to endusre to set your to so as to enable you see the text labeling clearly. to do that, after adding the indicator to your chart, right click it on the list, you will se the Visual order option.
Special Extreme Alert!
By analyzing the trends and dimensions, we are able to predict market extremes conditions, especially in pump and dump scenarios. (the bullish or bearish P/D extreme alerts).
Market flip arrow
The arrows trigger to indicate when the market flips to bullish (green) or bearish (red) conditions. note that this arrow is just a market flip confirmation and it it triggered by market trends, it does not come one time and sometimes later after market trigger conditions had been met.
circled in white.
Buy or sell potential {The tiny yelow(sell) and blue(buy) triangle}
By analyzing market extreme conditions, market sentiment, and liquidity, the buy/sell potential alert trigger is able to determine the state of the market, This can and should be used in combination with the market flip line (MFL) [the yellow line from , market flip trigger (MFT) (purple line), and market support/resistance line (MSR)(blue line) .
Market flip Line (Blue line) (MFL): the MFL is useful to also understand the market phase; a candle close above the MFL is bullish, while a candle close Below, the MFL is bearish. You are, however, expected to experience market retests and rejections coupled with support and resistance to follow through with the predicted direction. Patience is a valuable virtue in trading.
Extended sell or buy hunt (Red and Green Triangle)
this is real-time triangles indicator just like every other indicator on theis chart that indicates the market direction labeled with buy and sell. Note that the market-extended extreme can occur multiple times in the same direction. Hence, we'll advise having multiple trade entries.
The flip support line
Market Flip Trigger Line (MFTL) (Magenta): When the market crosses and closes below or above the Market Flip Trigger Line, you should wait for a confirmation. a confirmation is usually a retest or rejection of the line. A candle close and reject indicates the market as flip direction and it is going for a correction or major reversal. it is applicable on all timeframe.
As mentioned earlier, if you understand market structure and sentiment, using the uFVG, iFVG, upLQTY, downLQTY and BOS will be easy. however, this is how it works, you may need tohave and expanded readbout market structure for additional knowledge.
upLQTY (Bullish liquidity inducement)
The indicator appear at the close and confirmation on the 3rd candle and it is extended to only appear on 200 bars applicable on all timeframes.
This is a bullish sentiment and liquidty inducement order block that occurs, leading to the break of trend structure and change of character. Meaning the market sentiment as change which is backed up by liquidity in that region, which mostly gets filled, especially on lower timeframes before the price action continues. If price revese breaks and hold above this region, it invalidates the order block. This will always appear when there is a confirmed change of character CHoCH to the bullish side.
downLQTY (Bearish liquidity inducement) The indicator appear at the close and confirmation on the 3rd candle and it is extended to only appear on 200 bars applicable on all timeframes. It is and inverse of the upLQTY.
like order block, these are supply and demand zones that has the potential to change the direction of a trade. This is a bearish order block that occurs, leading to the break of structure and change of character. Meaning there is bearish liquidity yet to be accounted for in the region, which mostly gets filled, especially on lower timeframes before the price action continues. If broken, it invalidates the order block. This will always appear when there is a confirmed change of character from CHoCH to the bearish side.
Fair Value Gap
From general knowledge, FVG also know as Fair value gaps are inbalnace created by a 3 candlestick pattern where the top of the bottom candles doesn't cross the bottom of the top candle. like order block, these are supply and demand zones that has the potential to change the direction of a trade. This mostly indicate the presense of big plays in the market. for STIC indicator, FVG are labeled as listed below;
UFVG, also FVGup, {Colour green box} = bullish imbalance fair value gap
IFVG, aka FVGdown, {Red box} = bearish imbalance fair value gap
OIFVG, {Yellow box, no label} = other imbalances fair value gab
You should not that FG has upper, lower and middle band, any of the this area can be induced and filled by price.
Alert Conditions!
Buy alert conditions
- Any bullish buy alert
- Bullish hunt
- Re-entry Buy
- Sharp Market Sell rejection
- Buy potential
- upLQTY
Long position Exit conditions
- ExtremeB
- Profit
- Sell hunt
The Entry, exit and trail profit alert trigger should be used as position exit conditions either for a Long (Buy) or Short (Sell) situation and should be set as OPB (Once Per Bar). Using it as entry for exit or vice versa as shown not to be very profitable. hence the need to combine with other order entry alerts like the Any bullish or Bearish alerts
Sell alert conditions ( NOTE: All Sell alert are not yet included in this current version as this is targeted towards bullrun.)
- Sell potential
- Sell triangle (Sell hunt)
- downLQTY
and any trail profit alert, this alert put into consideration all the conditions required to trail profit.
Risk management advice
Patience and a good risk management strategy are required to be profitable trader using this tool. You need to ensure not to overleverage, and you should have multiple entries in case the buy coditions/alert shows again below the previous buy alert before a sell condition/alert occurs.

Fair Value Gap / FVG - HTF Orderflow bias / trendCalculates Fair Value Gap (FVG) as a counter and plots it below price.
FVG Counter value resets to +ve or -ve once the FVG counter reverses direction.
Use this script to find a bias to trade with.
Best used on HTF (like 1W, 1D), so the bias can be transferred to LTF (like 4H, 1H).
If you end up using this script, please leave a comment below on how you used it. I can try to incorporate those ideas in an update.
Cheers!

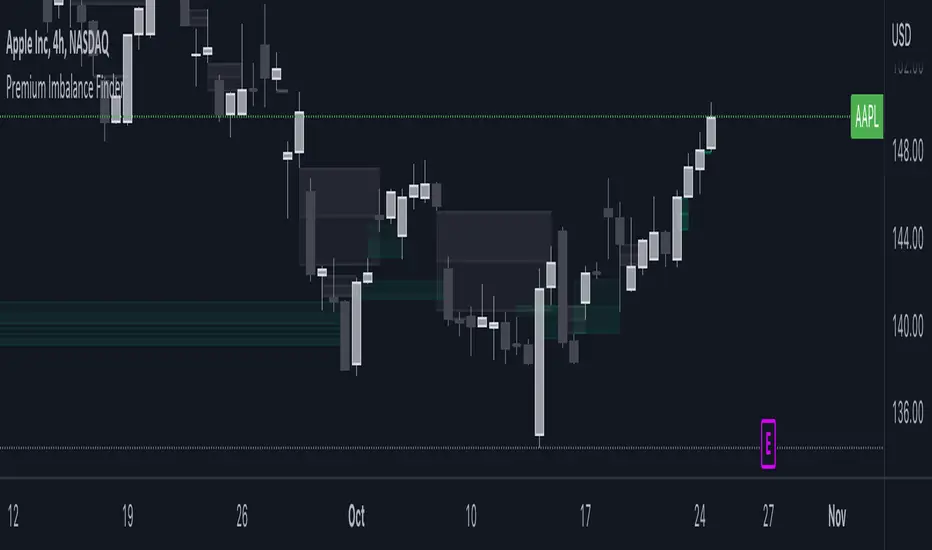
FVG LevelsFVG Levels Indicator Description
The FVG Levels indicator dynamically identifies and displays key price zones that may represent fair value gaps and order block areas, helping traders to visually pinpoint potential support and resistance levels directly on the chart.
Key Features
Order Block Identification:
The indicator detects bullish and bearish order blocks by analyzing specific candle patterns. For bullish zones, it checks if a candle two bars ago was bullish (close greater than open) coupled with a subsequent gap condition. Similarly, bearish zones are identified when bearish candle conditions are met with an appropriate gap.
Dynamic Zone Calculation:
It computes critical levels such as the highest highs, lowest lows, highest lows, and lowest highs over a series of recent bars. These levels define the boundaries of potential buy and sell zones and adjust dynamically as new price data comes in.
Visual Representation:
Buy zones are plotted in lime and sell zones in yellow, with the indicator filling the areas between the high and low lines to create clear, shaded bands. This visual aid helps in quickly recognizing zones of potential price reaction.
Chart Overlay:
Designed to work as an overlay, the indicator integrates directly onto your price chart, allowing for seamless correlation between price action and identified zones.
How It Works
Bullish Zones:
When a bullish candle (with the candle's close above its open) is detected along with a significant gap, the indicator marks the upper and lower boundaries of the bullish order block. It further refines these levels by tracking the lowest low and highest high over recent bars to enhance the zone's definition.
Bearish Zones:
In a similar manner, the indicator calculates bearish order blocks by confirming bearish candle conditions and corresponding gap criteria. It then updates the bearish zone levels and computes the highest high and lowest low to establish clear sell zone boundaries.
Usage
Traders can use the FVG Levels indicator to:
Identify potential entry and exit points by observing where price may reverse or consolidate.
Recognize fair value gaps or imbalances that often act as magnet points for price action.
Enhance risk management by using the dynamically calculated zones to set stop-losses or take-profits.

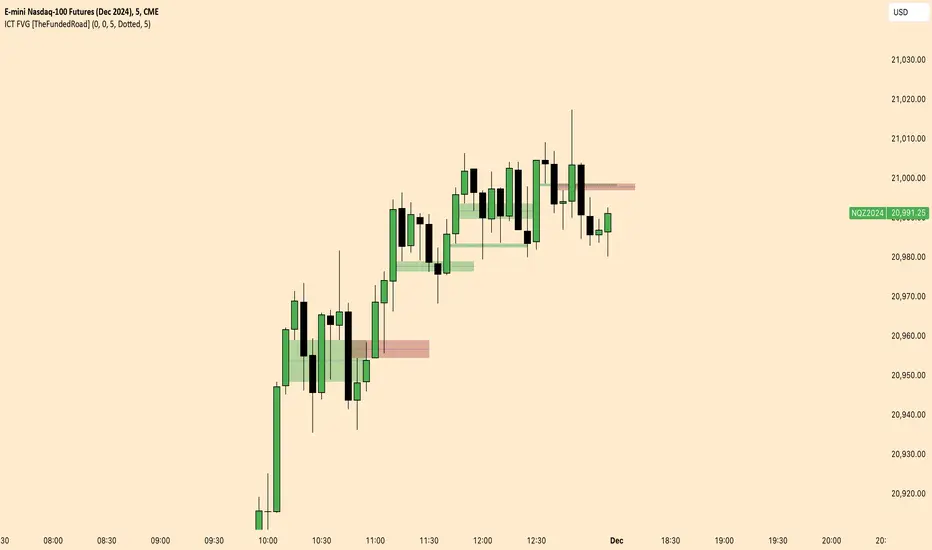
ICT FVG [TheFundedRoad]This indicator shows you all ICT Fair value gaps on chart with midpoint line
Fair value gap is a gap in a set of 3 candles, in a bullish FVG you have 1st candle high being lower than third candle low, and in a bearish FVG you have first candle low higher than third candle high, thats how this indicator finds these fair value gaps
It draws the fair value gap from the 2nd candle forward
You can customize the color and if you want to see the midpoint or not, midpoint is 50% of the gap
Implied Fair Value Gap (IFVG) ICT [TradingFinder] Hidden FVG OTE🔵 Introduction
The Implied Fair Value Gap (IFVG) is distinctive due to its unique three-candlestick formation, which differentiates it from conventional Fair Value Gaps.
Implied fair value represents an estimated worth of an asset—often a business or its goodwill—based on the price likely to be received in a structured transaction between market participants at a specific point in time.
In the ever-evolving world of technical analysis, pinpointing price reversal points and market anomalies can significantly enhance trading strategies and decision-making for traders and investors. Among the advanced concepts gaining traction in this field is the Implied Fair Value Gap (IFVG), introduced by the renowned analyst Inner Circle Trader (ICT).
This tool has proven to be an effective method for identifying hidden supply and demand zones in financial markets, offering a unique edge to traders looking for high-probability setups.
Unlike traditional gaps that are visible on price charts, IFVG is a hidden gap that doesn’t appear explicitly on the chart and thus requires specialized technical analysis tools for accurate identification.
This hidden gap can signal potential price reversals and offers traders insight into high-liquidity areas where price is likely to react. This article will guide you through using the ICT Implied Fair Value Gap Indicator effectively, covering its settings, usage strategies, and key features to help you make informed decisions in the market.
🟣 Bullish Implied FVG
🟣 Bearish Implied FVG
🔵 How to Use
The IFVG indicator is designed to assist traders in recognizing hidden support and resistance zones by identifying Bullish and Bearish IFVG patterns. With this tool, traders can make better-informed decisions about suitable entry and exit points for their trades based on these patterns.
🟣 Bullish Implied Fair Value Gap
This pattern occurs in an uptrend when a large bullish candlestick forms, with the wicks of the previous and following candles overlapping the body of the central candlestick.
This overlap creates a demand zone or a hidden support level, which can act as an ideal entry point for buy trades. Often, when the price returns to this area, it is likely to resume its upward trend, presenting a profitable buying opportunity.
🟣 Bearish Implied Fair Value Gap
This pattern is similar but forms in downtrends. Here, a large bearish candlestick appears on the chart, with the wicks of adjacent candles overlapping its body. This overlap defines a supply zone or a hidden resistance level and serves as a signal for potential sell trades.
When the price returns to this zone, it often continues its downward trend, providing an optimal point for entering sell trades.
The IFVG indicator also includes various filters that traders can use to refine their analysis based on market conditions. These filters, including Very Aggressive, Aggressive, Defensive, and Very Defensive, allow users to customize the IFVG zones' width, offering flexibility according to the trader’s risk tolerance and trading style.
🟣 Example Trading Scenarios
Suppose you’re in a strong uptrend and the IFVG indicator identifies a Bullish IFVG zone. In this scenario, you could consider entering a buy trade when the price retraces to this zone, expecting the uptrend to resume. Conversely, in a downtrend, a Bearish IFVG zone can signal a favorable entry point for short trades when the price revisits this area.
🔵 Settings
Implied Block Validity Period: This parameter specifies the validity period of each identified block, taking into account the number of bars that have passed since its formation. Proper adjustment of this period helps traders focus only on relevant zones, increasing the accuracy of the analysis.
Mitigation Level OB : This option defines the mitigation level for supply and demand blocks (Order Blocks), with settings including Proximal, 50% OB, and Distal.
Depending on the selected level, the indicator will focus on closer, mid-range, or farther points for block identification, allowing traders to adjust for the level of precision required.
Implied Filter : Activating this filter allows traders to apply conditions based on the width of the IFVG zones. With options like Very Aggressive and Very Defensive, traders can control the width of IFVG zones to suit their risk management strategy—whether they prefer high-risk setups or low-risk setups.
Display and Color Settings : This section enables users to customize the appearance of the IFVG zones on their charts. Traders can set different colors for Bullish and Bearish zones, allowing for easier distinction and improved visualization.
Alert Settings : One of the standout features of the IFVG indicator is the alert system. By setting up alerts, users can be notified whenever the price approaches a demand or supply zone.
Alerts can be customized to trigger Once Per Bar (one alert per bar) or Per Bar Close (alert at the close of each bar), ensuring that traders stay updated on critical price movements without needing to monitor the chart continuously.
🔵 Conclusion
The ICT Implied Fair Value Gap (IFVG) indicator is a powerful and sophisticated tool in technical analysis, allowing professional traders to identify hidden supply and demand zones and use them as entry and exit points for buy and sell trades.
This indicator’s automatic detection of IFVG zones helps traders uncover hidden trading opportunities that can enhance their analysis.
While the IFVG indicator offers numerous advantages, it is important to use it in conjunction with other technical analysis tools and sound risk management practices.
IFVG alone does not guarantee profitability in trading; it works best when combined with other indicators such as volume analysis and trend-following indicators for a comprehensive trading strategy.

Fair Value Gaps (FVG) [UAlgo]A fair value gap is especially popular among price action traders and occurs when there are inefficiencies or imbalances in the market, or when the buying and selling are not equal. Fair value gaps can become a magnet for the price before continuing in the same direction.
🔶 Key Features :
Fair Value Gap Identification:
Bullish fair value gaps occur when the current market price exceeds the previous high. The indicator identifies bullish gaps by comparing the low of the current candle with the high of the candle two candles ago . If the low of the current candle is higher than the high two candles ago and the closing price of the previous candle is also higher than the high two candles ago, a bullish fair value gap is detected.
Bearish fair value gaps occur when the current market price falls below the previous low. The indicator identifies bearish gaps by comparing the high of the current candle with the low of the candle two candles ago. If the high of the current candle is lower than the low two periods ago and the closing price of the previous candle is also lower than the low two candles ago, a bearish fair value gap is detected.
Fair Value Gap Filter :
ATR measures market volatility by analyzing the range of price movements over a specified period. It provides insights into the average price range that a security experiences within a given timeframe. After the ATR is calculated, a Simple Moving Average (SMA) is computed for the ATR values. This moving average smoothens out the ATR data, providing a clearer indication of the average volatility levels over time.
When the filter is active, fair value gaps are identified only if they occur during periods of relatively higher volatility, as indicated by the ATR being greater than the SMA. This helps in refining and obtaining the detection of stronger fair value gaps
An example with FVG filtering off:
An example with FVG filtering on:
Customizable Settings: Users have the flexibility to customize various parameters to suit their trading preferences. They can adjust settings such as the number of fair value gaps displayed, mitigation method (either based on closing prices or wicks), and apply filters based on Average True Range (ATR) to refine gap detection.
🔶 Disclaimer :
Use with Caution: Trading involves significant risk, and this indicator should be used with caution. While it can help identify potential trading opportunities, it does not guarantee profits and may sometimes provide false signals.
Not Financial Advice: The information provided by the Fair Value Gaps indicator is for educational and informational purposes only and should not be considered as financial advice. Traders should conduct their own research and consult with financial professionals before making any trading decisions.
Past Performance: Past performance is not indicative of future results. Historical price movements analyzed by the indicator may not accurately predict future market behavior.

HTF FVG and Wick Fill trackingImbalances in the charts are some of the clearest and most traded price areas. Two of the best and most used are fair value gaps FVGs and large candle wicks. In both of these price appears to move in such a way that most are left behind having 'missed' the move. But in reality price will often come back to these price points to re-balance and absorb the liquidity that was left behind.
This indicator takes these areas and makes viewing and tracking them clearer than ever. It does this, by first allowing the user to overlay a higher timeframe candle on the current chart. This in itself provides an in depth look at a higher timeframe candle both as it forms and in its final form.
Next the indicator identifies either the FVG or large wicks, on the chosen higher timeframe, all while the chart remains on a lower timeframe. As seen here the fair value gaps are clearly highlighted, taken from a 4 hour timeframe, while the actual chart is on 15 minutes. This allows the user even greater accuracy in identifying their key trading areas.
Utilizing the indicators unique feature, these areas can optionally be extended forward to the current timeframe and 'filled' in realtime. Areas that are filled to the users defined level, will be removed from the chart.
With supplementary settings for how much history to show, how large of a wick should be highlighted and complete control over the colour scheme, users will be able to track and understand the filling of imbalances like never before.

Displacement (Two FVGs)A simple indicator that attempts to identify displacement in price by alerting you when two simultaneous Fair Value Gaps (FVGs) occur.
When two fair value gaps occur, the indicator will print a green bar (if bullish) or a red bar (if bearish). If you right click on the indicator you can turn on alerts that will pop up every time a dual FVG occurs.
Fair Value Gaps are most commonly used amongst price action traders and are defined as instances in which there are inefficiencies, or imbalances, in the market.
The concept for this indicator is very simple. Apply it to your chart and enable alerts on the instruments and timeframe you trade. When you get an alert, it could indicate larger players getting involved.
This is NOT a trading strategy. Its intention is to save time by alerting you to large imbalances in price on the instruments you trade.

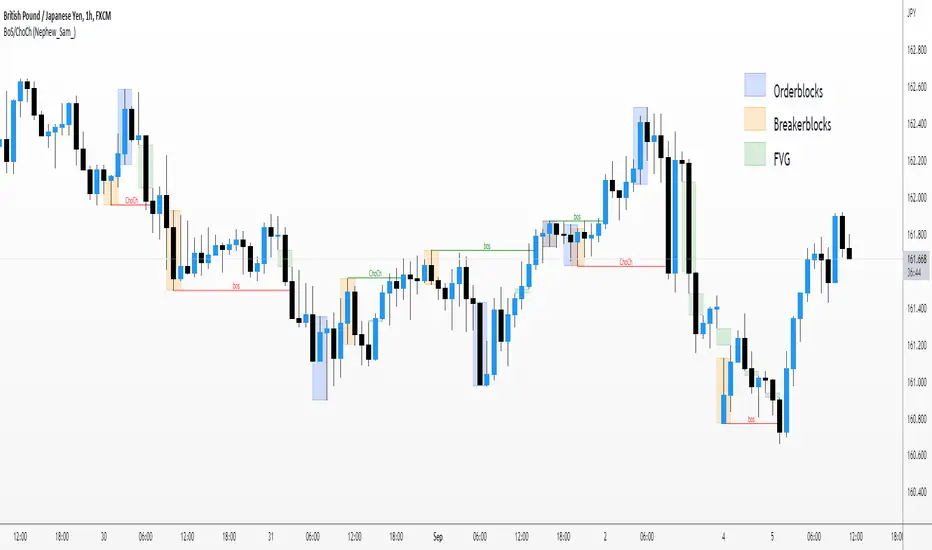
Market Structure BOS/CHOCH/MSB/FVG/OB/BB (Nephew_Sam_)This market structure indictor uses pivot points to find break of structure and change of character.
You can enable the options to find Fair Value Gaps, Breaker Blocks and Orderblocks too. The way this works is, once a bos/choch is found, it will loop back and find all fvg/ob/bb from that point until the previous pivot point.
Settings
Pivot strength - How many candles to the left/right requried to determine a swing high
Breakout Confitmation - The breakout candle should close under the previous pivot or the wick H/L should be under
Show xyz - show HH/LL, Break of structure and change of character
FVG/OB/BB - Show, bull/bear colors, extend boxes to the right, delete boxes once filled, fill type close or H/L
Sonarlab - MTF Imbalance/ FVGAn imbalance is created when the order block creates such impulsive volume in the market that it throws off the equilibrium between buyers and sellers, forming a gap. This is referred to as imbalance or FVG. These gaps act as a magnet for price to retrace to, in order to correct the disturbance in market equilibrium.
Imbalances = FVG
This image above shows you how an imbalance is created in the market using 3 candles. As we all know, candle sticks represent a specific time-range - for example: 1H. This means that inside 1 candle stick, there are 60 1 minute candle sticks resting. What I'm trying to say with this is that you get a totally different picture when you are on the lower timeframes. An imbalance can be overlooked, so it can be very helpful to have the multiple timeframe Imbalances on your screen, so you understand what is actually going on in the bigger picture.
Usage
Focused on combining with SMC:
When trading SMC, Imbalances can be great for POI's (point of interests) or using as targets in the market. Imbalances work like magnets in the market. When the market is imbalanced, it mostly wants to balance those gaps and can sometimes react perfectly from the area's. Besides that, it can really give you an idea who is in control at that moment.
Here you can see an example of an Imbalance when on the 1H timeframe - in the next picture below you can see the exact same imbalance, but then on the 3M. Now you understand why it can be overlooked?
So, imbalances/ FVG's:
- Increase probability of certain Point of Interests
- Can be a sign of strong interest in price areas
- Can be used as targets
- Can be used as POI's
What makes this Imbalance indicator different?
The Sonarlab MTF Imbalance indicator makes it possible to show up to 3 higher timeframes, which makes it easier to do your analysis and spot these areas when trading.
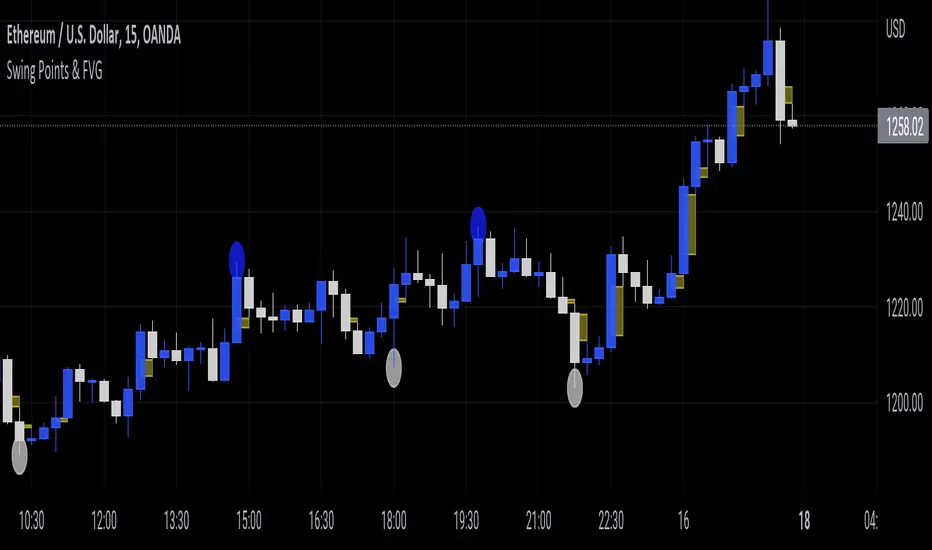
Swing Points & FVGClassic ITH/ITL
Intermediate Term High - High that has short term high on either of it's side.
Intermediate Term Low - Low that has short term low on either of it's side.
FVG
The indicator also marks Fair Value Gaps which is a very important concept in price action trading. FVGs are formed when there is ineffeciency,or imbalance, in the market.
Rebalanced ITH/ITL
Rebalanced ITH - A short term high that rebalanced the ineffeciency in price can be considered as an Intermediate Term High.
Rebalanced ITL - A short term low that rebalanced the ineffeciency in price can be considered as an Intermediate Term Low.
Use the ITH and ITL points marked by the indicator to determine the structure of the market.
Indicator repaints only when it tries to identify the latest ITH/ITL.
PT FVG ImbalancesVersion 1.0 of the PT FVG Gaps & Flat Opens was developed to visually identify any imbalances in price. This indicator can be used on all timeframes.
Fair Value Gaps are a key component when trading price action. They are derived from zones in liquidity where price moved quickly in a certain direction leaving gaps behind. These areas tend to act as magnets to price throughout the trading session of that timeframe.
PT FVG Features:
-Gaps that have been partially filled will shade darker to show price has already attempted to fill that gap before (Toggle Highlight Gap Fill).
-Gaps that have been partially filled will remove a portion of the background zone to indicate how much gap is left to fill in the full zone (Toggle Highlight Remaining Gap).
Flat Open Candles are derived from candles that open without a wick (wickless candles). Price more often than not tends to gravitate towards these areas in the near future to fill the wickless candle before continuing on with the trend. Can be used on all timeframes, but the higher the timeframe holds more weight.
PT Flat Open Features:
-Flat open sensitivity would recommend keeping it around 30-50. If scalping keep it sub 30. This feature determines how many flat opens you want on your chat at one time.
-Delete flat open line allows us to delete the line once price has filled the wickless candle.
Video with strategy will be uploaded shortly! It is included as part of the library. Just message us for access!

Fractal Break Imbalance / Fair Value Gap (FVG) / Liquidity VoidFractal Break Imbalance / Fair Value Gap (FVG) / Liquidity Void
Order imbalances in either direction, either excess buy or sell orders, reduce liquidity. The market will seek to fill gaps sooner or later. The script marks an imbalance / FVG after a fractal break. It also marks any other imbalance.
Default Colours:
Green - Imbalance after fractal break to the upside
Red - Imbalance after fractal break to the downside
Yellow - Other imbalances
How To Use:
Gaps can be used to determine possible entries and targets. Those familiar with liquidity raids, supply and demand, and ICT concepts may realise it's potential.
Indicator in use:

Super OrderBlock / FVG / BoS Tools by makuchaku & eFeThis super indicator is a Swiss army knife for Smart Money traders for OrderBlocks / FVG / BoS
It provides many options for drawing (non-repainting) boxes for OrderBlocks, Fair Value Gaps (FVG) and Break of Structures. The boxes are extended into the future, until the first retest/mitigation.
Some of the additional options (not explained in the diagrams above)
PPDD OB : An order block which is formed after interacting with Liquidity (old low/high, fractal low/high, etc). Since these OB's are in the most premium or most discount, they are Premium Premium Discount Discount OB's (PPDD OB)
HVB Bars : When the volume of any bar is higher than the average volume of last N bars, it could mean something important (in the right context). Hence, the indicator allows for coloring them differently.
This indicator was built as a collaboration between @makuchaku & eFe
Pro tip : This indicator is a simply a tool to visualize trading concepts on the candle stick chart. It is the job of the trader to sequence these effectively into a profitable trade.
If you come across any bug or have a question on how to effectively use the indicator, please don't hesitate to ask questions.
Good luck & good trading!

ICT FVG + BPR + Liquidity StrategyICT-Based Strategy combining:
• 4H Fair Value Gaps (FVG) for directional bias
• Balanced Price Range (BPR) zones for entry refinement
• PDH/PDL liquidity sweeps for confirmation
• Daily swing high/low structure
• London session time windows (07:45-11:45 & 14:00-14:45 GMT)
• High-volume liquidity zone detection
• Trailing stops at 1R increments
Features:
✓ 15+ years backtested (2010-2025)
✓ Works on GBPUSD, GBPJPY, USDCAD
✓ Asymmetric risk/reward (1R-10R winners vs -1R losses)
✓ Automated entry/exit signals
✓ Full risk management (1% per trade)
Best for: Personal accounts, swing trading, education
Prop firm modifications included in comments.
Free to use & modify - Share improvements!
Created by: BacktestBay

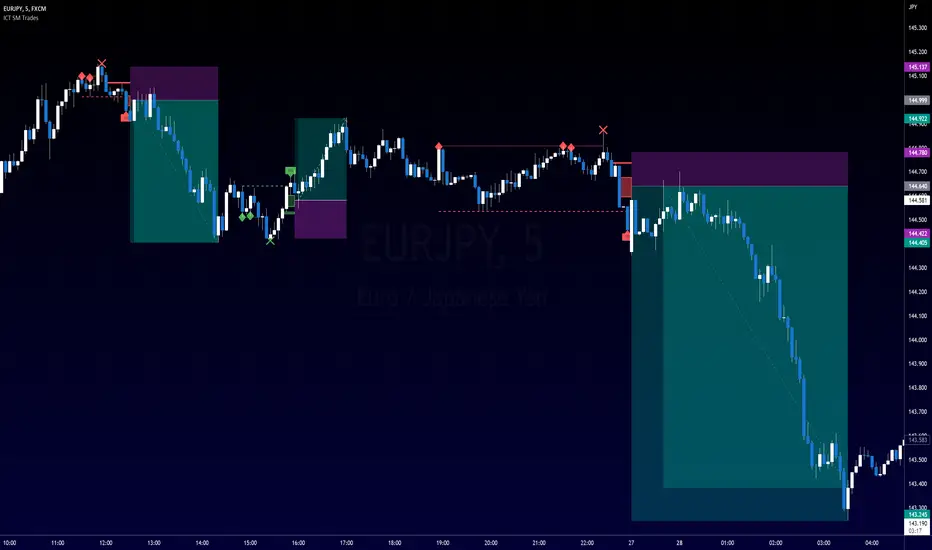
15m FVG Inversion + Order BlockThe indicator finds the inversion of the FVG 15 minutes and the order block, after which it gives an entry signal.
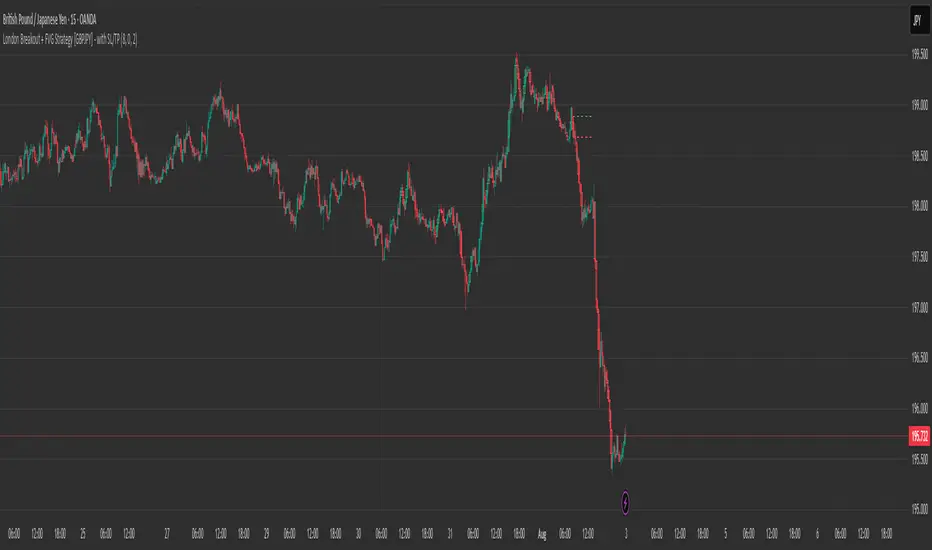
London Breakout + FVG Strategy [GBPJPY] - with SL/TPMarks the London open high and low on 15 min time frame, ads fvg on 5 min for orders
Liquidity Voids (FVG) [LuxAlgo]The Liquidity Voids (FVG) indicator is designed to detect liquidity voids/imbalances derived from the fair value gaps and highlight the distribution of the liquidity voids at specific price levels.
Fair value gaps and liquidity voids are both indicators of sell-side and buy-side imbalance in trading. The only difference is how they are represented in the trading chart. Liquidity voids occur when the price moves sharply in one direction forming long-range candles that have little trading activity, whilst a fair value is a gap in price.
🔶 USAGE
Liquidity can help you to determine where the price is likely to head next. In conjunction with higher timeframe market structure, and supply and demand, liquidity can give you insights into potential price movement. It's essential to practice using liquidity alongside trend analysis and supply and demand to read market conditions effectively.
The peculiar thing about liquidity voids is that they almost always fill up. And by “filling”, we mean the price returns to the origin of the gap. The reason for this is that during the gap, an imbalance is created in the asset that has to be made up for. The erasure of this gap is what we call the filling of the void. And while some voids waste no time in filling, some others take multiple periods before they get filled.
🔶 SETTINGS
The script takes into account user-defined parameters and detects the liquidity voids based on them, where detailed usage for each user-defined input parameter in indicator settings is provided with the related input's tooltip.
🔹 Liquidity Detection
Liquidity Voids Threshold: Act as a filter while detecting the Liquidity Voids. When set to 0 basically means no filtering is applied, increasing the value causes the script to check the width of the void compared to a fixed-length ATR value
Bullish: Color customization option for Bullish Liquidity Voids
Bearish: Color customization option for Bearish Liquidity Voids
Labels: Toggles the visibility of the Liquidity Void label
Filled Liquidity Voids: Toggles the visibility of the Filled Liquidity Voids
🔹 Display Options
Mode: Controls the lookback length of detection and visualization
# Bars: Lookback length customization, in case Mode is set to Present
🔶 RELATED SCRIPTS
Buyside-Sellside-Liquidity
Fair-Value-Gaps

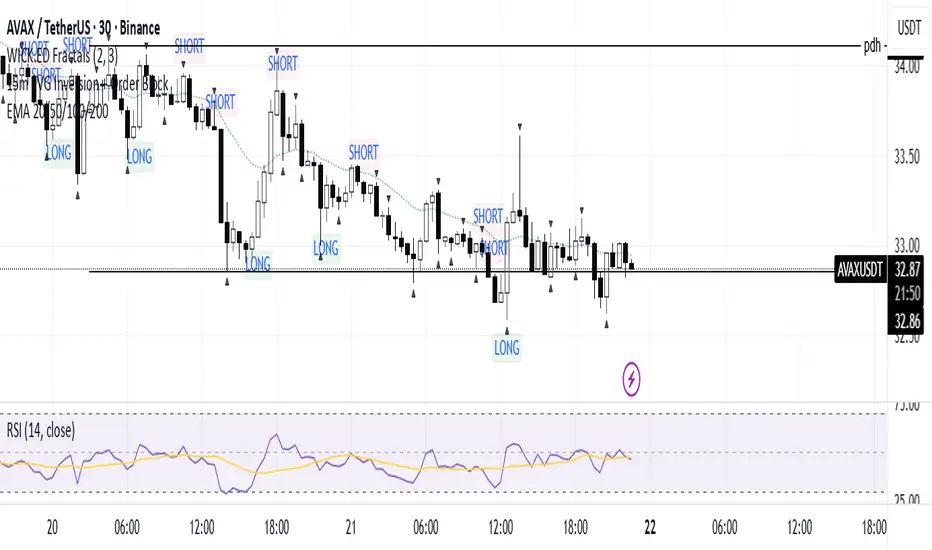
ICT SM Trades (liquidity find & grab, MSS, FVG, killzones)Indicator looks for ICT & Smart Money trades on any timeframe. These types of trades reveal how the big institutions, banks and hedge funds trade with big money. If they want their very big positions to be filled they need to find areas in chart where the majority of the money is sitting. Where is it? Where is the majority of orders placed? Right below supports or right above resistance, these orders are stoplosses or stop orders. So they need to push the price to these areas, take all the available stoplosses and trigger all the available stop orders in order to fill their positions and then push the price to the opposite side to make profit (and retail to lose).
Indicator looks for support or resistance (S/R) areas which are represented by dotted lines. This S/R areas are created by minimum of 2 pivot high/low (H/L). Every pivot H/L that creates the S/R area is marked with diamond label. This S/R area is called liquidity. After liquidity is created, indicator looks for liquidity grab (mostly represented by fast spike to this area - it is labeled with x-cross) and then price should go fast to the opposite side of the created structure. Indicator considers as a created structure everything that was created on the other side of the candles from the oldest pivot H/L which creates particular liquidity. For example, if liquidity is created with 3 pivot highs, indicator looks at the oldest pivot high and from there it is looking for the lowest low. Under this lowest low is dashed line which means that this level should be broken with closed candle. This action is called market structure shift (MSS), when the price shifted very fast from highs to lows. After MSS, when the price went fast to one direction, there were some imbalances in prices, in our example selling pressure was a lot bigger than buying pressure and there were created some long untested bearish candles. This untested areas in candles are called imbalances or gaps of fair value gaps (FVG). These are labeled with rectangles. It is expected that these gaps will be tested in near future to "balance the market".
We can put limit orders into these gaps and await some retracement after MSS to open our positions and after the positions are opened we can expect trend continuation in the direction where market structure shift was made (away from liquidity grab). So stoplosses can be placed above/below liquidity grab candle (marked with x-cross).
In settings of the indicator you can set whether only long or only short trades will be shown. Long trades are green and short trades are red. You can set if fair value gaps will be shown as well. The last thing in settings is session. You can set custom session which will be shown as background color on your chart.
FVG & SMA @danciFVG zones with 200 SMA & daily dividers for intraday analysis, customizable and clear.

FVG Tracker"FVG Tracker" plots three‑candle fair value gaps on the chart as semi‑transparent grey boxes. It automatically clears and redraws the current gap each bar and fires a single alert whenever a new imbalance zone is detected on any timeframe you need.
