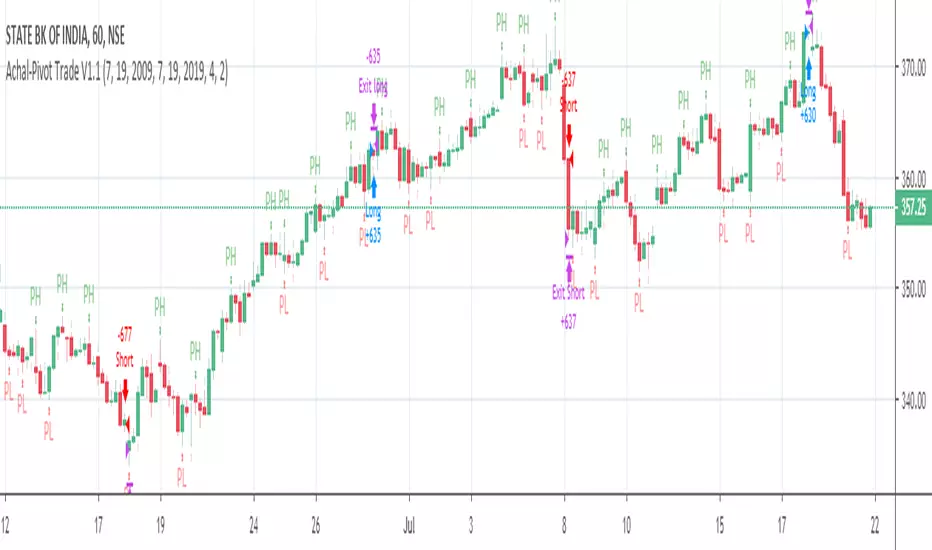
Achal-Pivot Trade Strategy v1.0Yesterday , I learned to script in pine. I have implemented strategy based on pivot points . When previous pivot point is broken , script takes decision to go long on various other parameters i.e. filtering of signals. Exit of position is purely based on trailing stop loss.
This script seems to be best suited for intraday trading as average bars per trades are less.
Short function has not been defined yet.
Waiting for comments, so that improvements can be made
Regards
Recherche dans les scripts pour "pivot"
Pivot Signal - 10mOptimized for EUR/USD pair on 10m timeframe. Can be used on 5m for earlier signals but there is more noise.
Pivot high, SELL, close long and/or open short position
Pivot low, BUY, close short and/or open long position

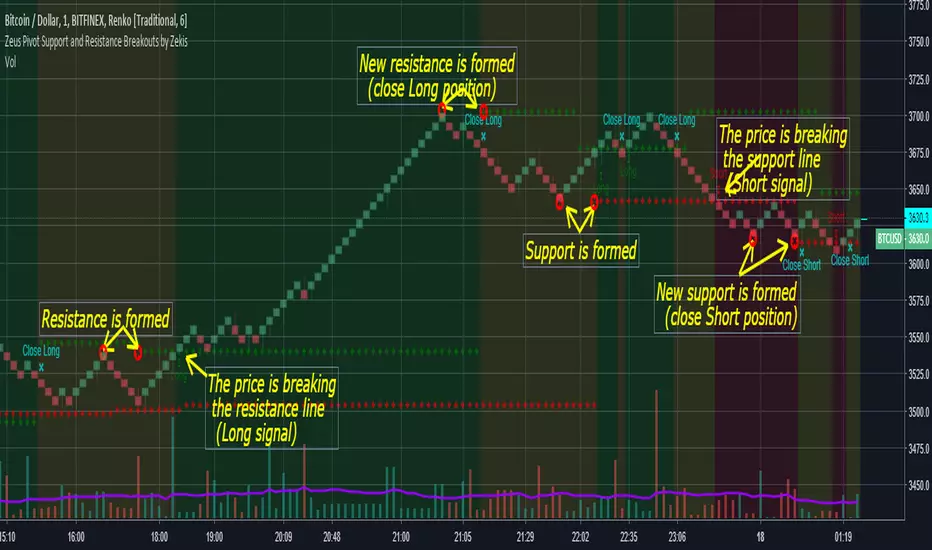
Zeus Pivot Points Support and Resistance Breakouts by ZekisZeus Pivot Support and Resistance Breakouts by Zekis
Is an indicator with big results, it forms new support /resistance according to the last higher high or lower low (it prints new ones only if it breaks through the last one)
Rules:
- enter Long or Short when the support or resistance is craked
- exit when new support or resistance is starts to form
Alerts for entries and exits
A moving average is added to filter signals (leave it at 1 for price close signals)
Bar colors can be added to see longs, shorts or no position
Background colors for longs, shorts or no position
Enjoy!
@Zekis

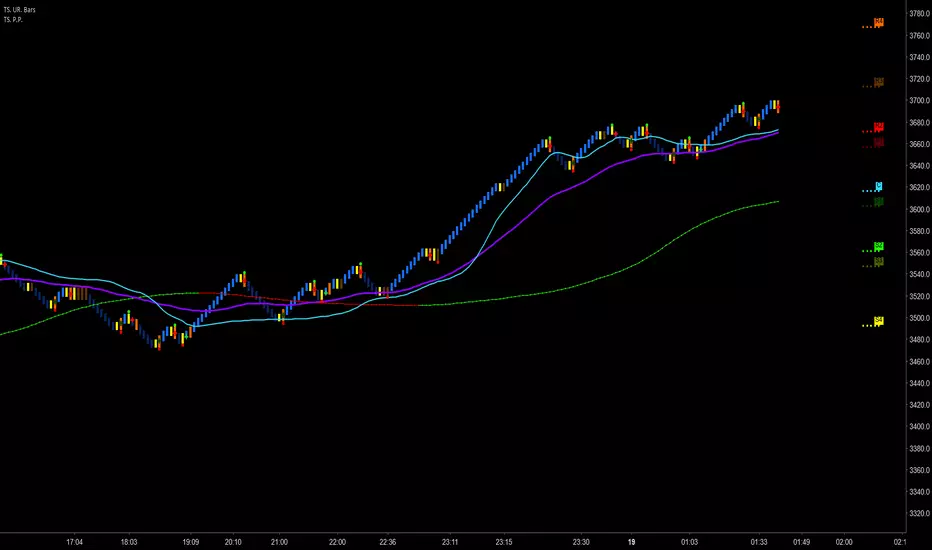
Trader Set - Pivot PointsThis is a Pivot Point indicator that has the ability to sit on top of Uni Renko Charts to show the center pivot (others don't work because of specifications of uni renko chart unless i figure something in future) but on price charts and range charts they work like charm.
Unlike the built in indicator, you can choose separately to draw each support or resistance level. Other than Standard draw from the built in indicator, all other types are included in this indicator.
Please, don't ask for access, only my students from my classes will have access to this indicator, at least for time being. If at any time in future I wish to sell, you will find the price and how to buy in the comments bellow.

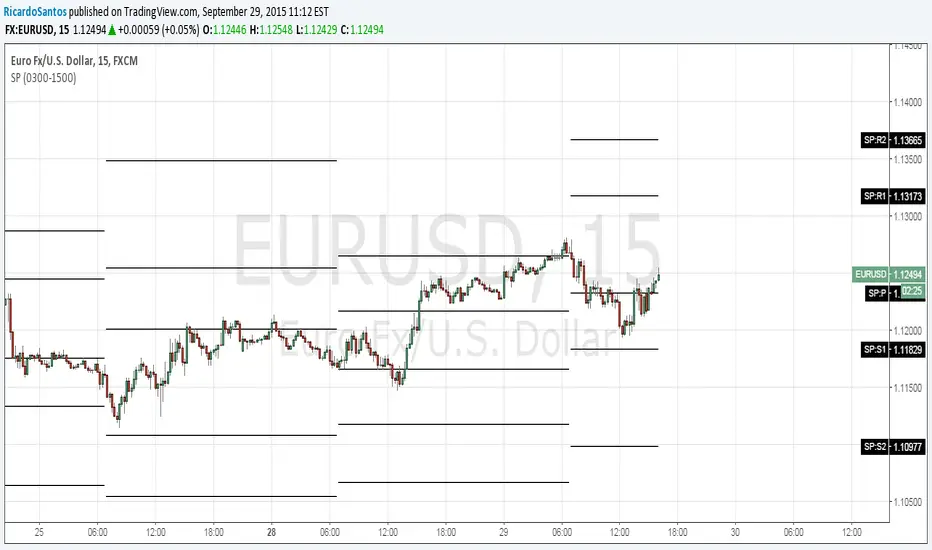
Weekend Access STS Pivot System TrialSuggested to Free Trial User. Contact us to set up your Weekend Access Trail and we will grant access to this STD Script. We recommend placing the script on 3 time frames 10 or 15 Minute, 1 Hour, and 2 Hour for Active Traders. And for Swing Traders use a 1 Hour, 2 Hour, and Daily. Open all 3 Charts and review a symbol list and review the Price Action off the STS Pivot System Charts. The more charts you review the more of a feel for the STS Pivot System you will have in determining its Value to you and your trading style and goals. Thanks for your consideration.
Weekend Access Trial freetrial.stspivotsystem.com
Using STS Pivot System Charting Package to find, plan, and execute Trade Entry and Trade Exits is what our charting package is designed for. You can use 1 Hour 2 Hour and Higher Time Frames to create your trading idea and use shorter time frames to manage a more refined entry point, monitor possible hesitation points, and manage stops as the trade matures. Traders should use their own due diligence in making trading decisions and fully understand the risk of trading. Price Action charting includes NO FUNDAMENTAL RESEARCH and caution should always be used around Earning Releases, New Events, and Social Chatter.
Charting Packages and Weekend Access Trial freetrial.stspivotsystem.com

[naoligo] Pivot Points (Daily)Suporte/Resistência do Pivot diário para gráficos intraday
Marcação do S/R tradicional e S/R Fibonacci
Daily Pivot Point Support/Resistances on intraday charts
Both Traditional and Fibonacci methods plotted

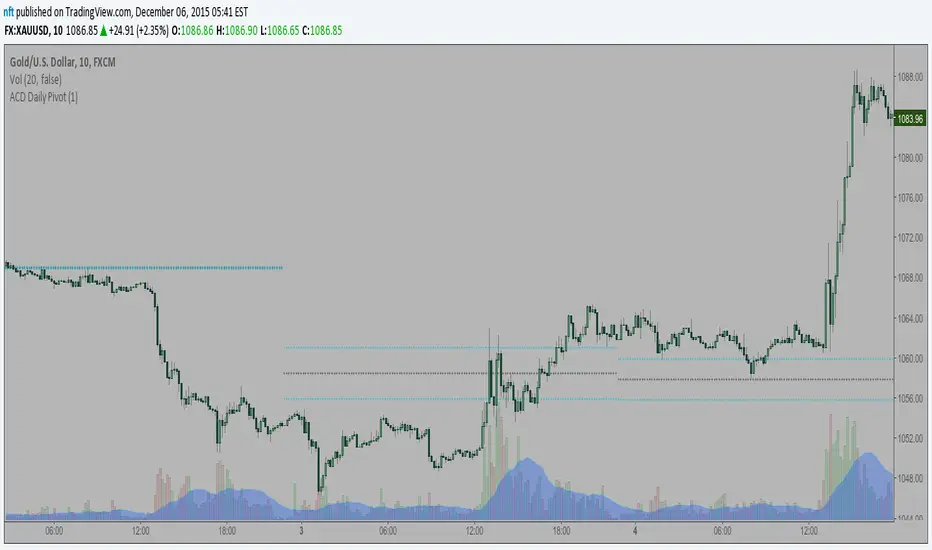
ACD Daily Pivot RangeThis indicator is to display the Daily Pivot Range for Mark Fishers "ACD" method.
If anyone knows how to offset it for different start times (LO, NYO) please let me know so I can update. Ideally the daily daily pivot calculation start should be from the same time as your opening range but i am not sure how to do this.
AperonFx ATR Pivot Points 1.0This indicator combines classic pivot levels with ATR-based extensions and a refined weekly timing logic. The objective is to provide clean, robust support and resistance levels that remain consistent across all chart timeframes.

Pivot Moving Average steteggythis Pivot Moving Average steteggy works best on a chart --->>Above 100$ crypto
Sniper is very profitable in terms of% good trades
It will perform very well on 1-5X Leverage (Solid leverage, not variable depending on the volume )
TP: 0.9 %
SL : 5.5 %

Pivot Point CandlesIndicator that highlights Hammer, Inverted Hammer, Engulfing, and Harami candlestick patterns. Great for those looking for a quick way to show the most popular reversal patterns on the charts.
Options will allow you to select to show Hammers, Engulfing or Harami patterns only. You choose the combinations that you want. Great tool to learn and training your eyes to the patterns.
You also have an option to select "Super" versions of the Engulfing and the Harami patterns, the Supers only shows if the pattern engulfs the body and the wick of the smaller candle in the pattern.
The indicator will show Bullish opportunities and Bearish opportunities on the chart for each of the patterns. The inverted hammer will show at the top indicating a Bear move, and the Hammer will show below price indicating a Bullish move.
Use this indicator in conjunction with other Support & Resistance such as the simple moving averages, trend lines, flat lines, or even Bollinger bands. When these patterns show at or around these points on the chart they will indicate a reversal is pending. Wait for the next candle as confirmation that the move will actually take place in the direction indicated and you will have your pivot point on the chart and create a higher probability of success. Leverage Stochastic, RSI, or CCI indicators to help confirm the reversal as well. Look out for resistance above or support below to determine your targets for the reversal.
Happy trading!

Algonize Pivot Strategy (APS)This study is based on several Price Action parameters of :-
• Pivot Points,
• Higher High and Lower Lows,
• High Low Index ,
• Support and Resistance.
► How To Use This Strategy?
This is a pure scalping strategy and it is advised to use this only with algo trading systems. Due to high trade frequency.
► This Strategy has inbuilt custom time frame backtester, which enables you to test for performance between any date or check for a single day.
► To Create Alerts for algo trading in this strategy simply Check "Activate Algo" from Settings then Create new alert , select your strategy in condition box, and now scroll down to message box and write
{{strategy.order.comment}}
That's it , Just Click on Create Alert Button
Backtest Values Used:-
Initial Capital : 1000000
Order Size (Lots) : 1 (Contract) Lots
Pyramiding : 0 orders
Commission : 0.003%
Sharpe Ratio : 1.741
Profit Factor : 1.174
Test Yourself and give feedback.
PM us to obtain access.

My VWAP Reversal + Pivot Points StandardThis indicator, with the addition of a standard VWAP indicator to the 5m chart, helps the operator when using a closing candle Price to initiate a VWAP Reversal strategy.
The strategy involves Price gapping up, look for a Close below the 1st 5m candle Low; else look for a Close above the 1st 5m candle High. On a break of VWAP, take the trade in the opposite direction of the gap, hence the VWAP Reversal. Not my own strat, credit to T3 Newsbeat, publicly posted on YouTube.
The Pivot Points Standard in the Pine 4 user manual, was the base source code, and leaving it here will allow me to remove the PP indicator I was using.

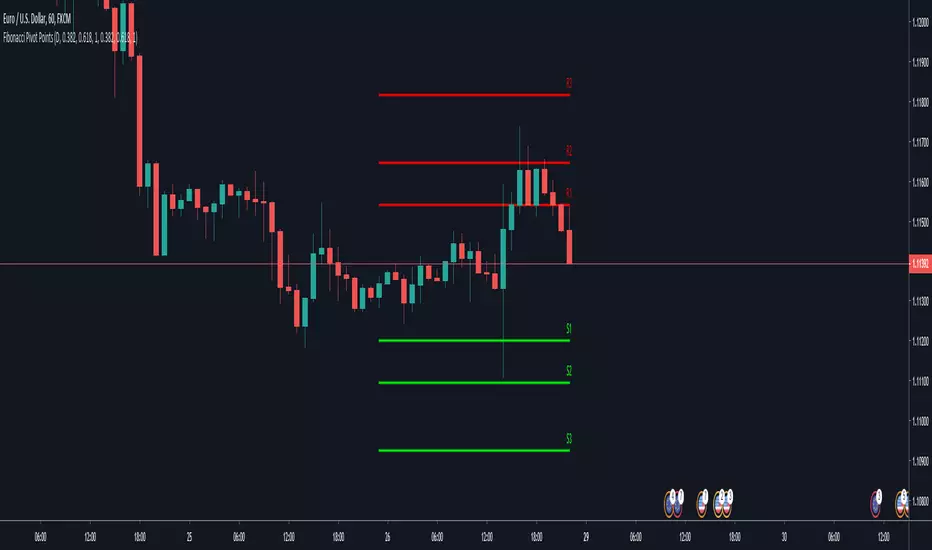
Fibonacci Pivot PointsThis indicator draw Fibonacci Pivot Points.
Levels and Time Frame can be changed from the indicator settings.

Fibonacci Pivot PointsThis is script draw Fibonacci Pivot Points.
Levels and Time Frame can be changed from the indicator settings.
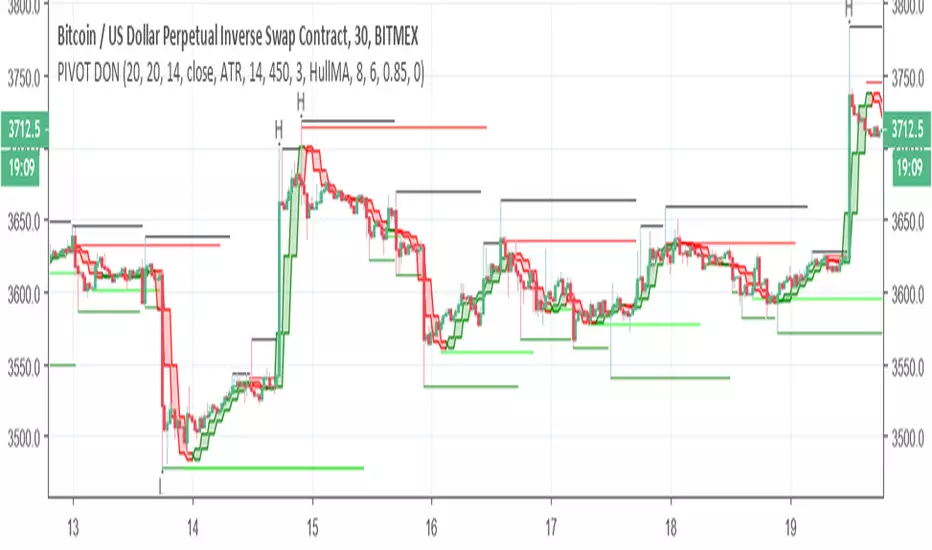
PIVOT DONThis indicator is great to detect resistance and support
The H and L are based on new high and low formed by Donchian cahnnel , the lines of support and resistance are based on pivot system
by the TF you can control the time length of the donchian channel
no alert to this system
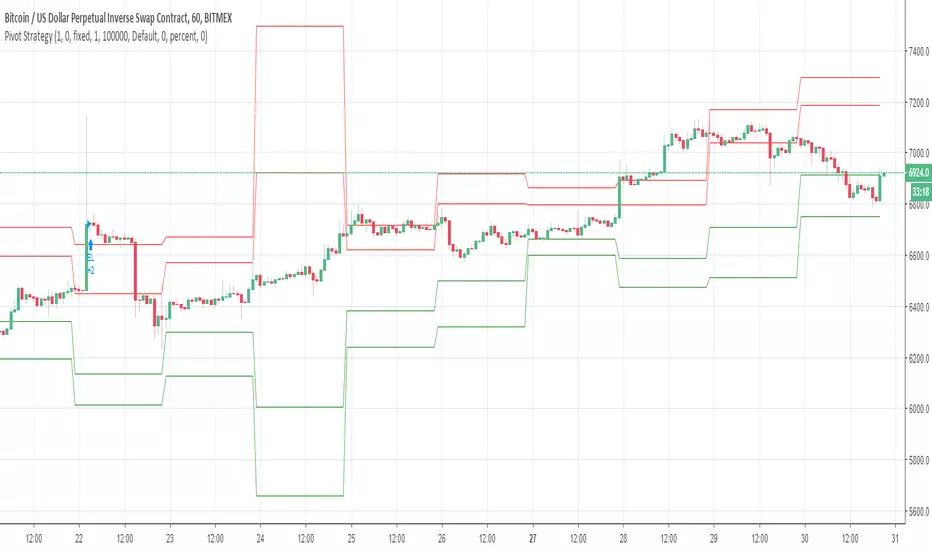
Pivot StrategyThis strategy utilises pivot points to mark support and resistance levels and trades on them.
Monthly Pivot RangeMark Fisher's Pivot Range calculations applied on the monthly timeframe (daily chart).

Standard Deviation Pivot pointsSupport Resistance points that are calculated based on the standard deviation of the traditional pivot point(previous session's high, low and close). More often stocks tend to oscillate between 3 levels of deviation forming day's high or low. A breakout of the 3rd SR level with volume indicates a strong trend day.


Pivot Trend [ChartPrime]The Pivot Trend indicator is a tool designed to identify potential trend reversals based on pivot points in the price action. It helps traders spot shifts in market sentiment and anticipate changes in price direction.
◈ User Inputs:
Left Bars: Specifies the number of bars to the left of the current bar to consider when calculating pivot points.
Right Bars: Specifies the number of bars to the right of the current bar to consider when calculating pivot points.
Offset: Adjusts the sensitivity of pivot point detection.
◈ Indicator Calculation:
The indicator calculates pivot points based on the highest and lowest prices within a specified range of bars. It then determines the trend direction based on whether the current price crossed above upper band or crossed below lower band.
Upper and Lower Bands
◈ Visualization:
Trend direction is indicated by the color of the plotted lines, with blue representing an upward trend and red representing a downward trend.
Buy and sell signals are marked on the chart with corresponding symbols (🅑 for buy signals and 🅢 for sell signals).
Buy and sell signals generated by the indicator can be used in conjunction with other technical analysis tools to confirm trading decisions and manage risk.
Overall, the Pivot Trend indicator offers traders a simple yet effective method for identifying potential trend changes and capturing trading opportunities in the market. Adjusting the input parameters allows for customization according to individual trading preferences and market conditions.
