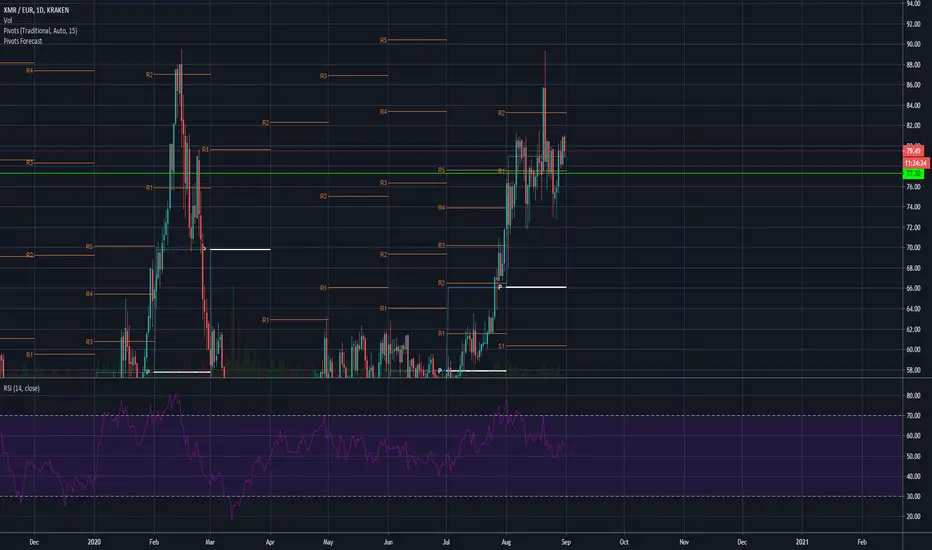
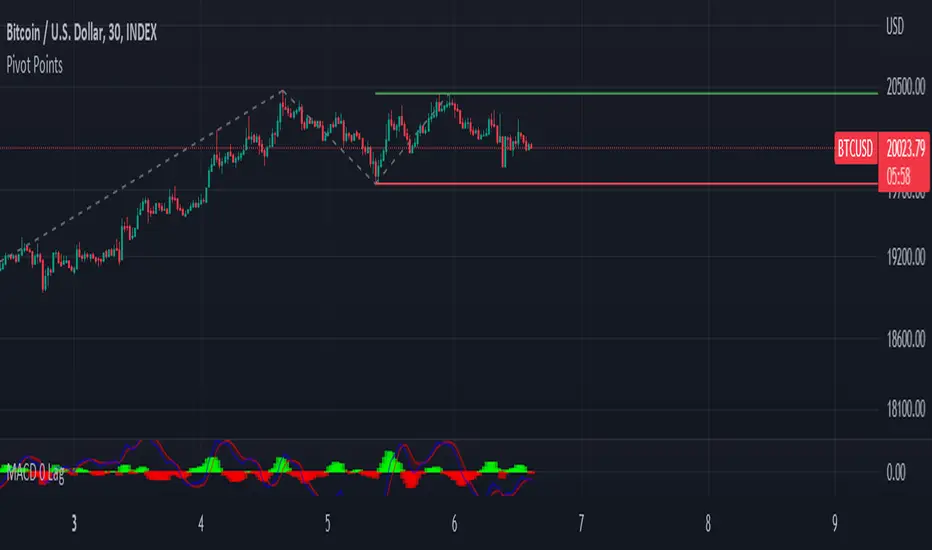
Pivots HL Trend Line (ver2)Solid line : Trend Line between current pivot point and previous pivot point
dotted line : Trend Line between currend pivot point and 2nd previous pivot point & 3rd previous pivot point
dotted grey line : extension line of solid line
Recherche dans les scripts pour "pivot"

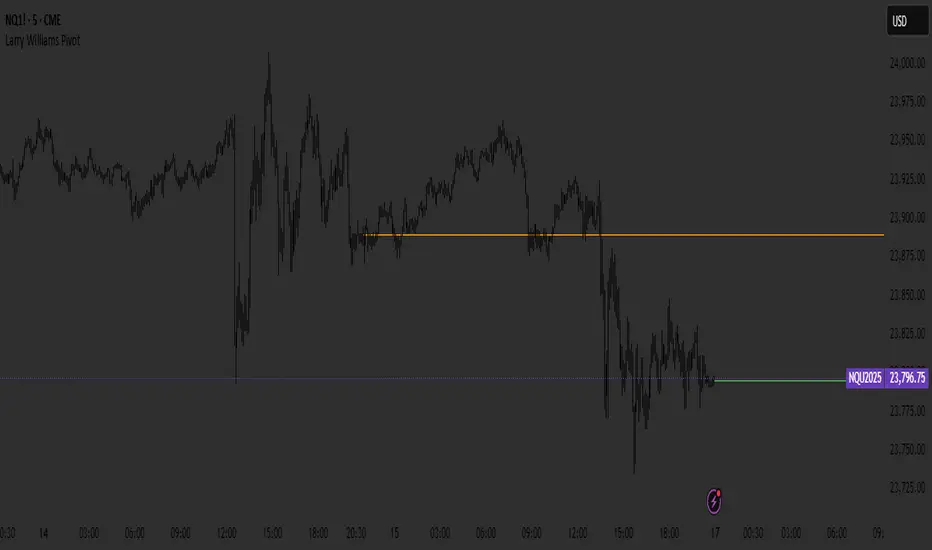
Larry Williams PivotPivots based on Larry Williams. (High + Low + Close) / 3
Not to be used as buy and sell signals.
Pivot Expotential Moving AveragesPivot MA's indicator is a combination of the following:
Pivot SMA
Pivot EMA's
Pullback to EMA Band
Pivot EMA's Cross Over
Pivot Double-EMA's Cross Over
Modified Pivot EMA's Cross Over
All the pivot EMA’s calculations are based on "Profiting With Pivot-Based Moving Averages" book by Frank Ochoa.
How to use it :-
One should have to refer this book for in depth usage of this indicator.
You can use the option's provided in the indicator and the signals have been generated according to the concept in this book.
Don't turn on multiple option's, it becomes clumsy to look.
Description:-
1. Pullback to PEMA Band:-
Perhaps the most trader-friendly PEMA setup is the PEMA Pull-Back, because it forces you to trade in the direction of an established trend.
In this, u get the signal when the price retraces to 13 EMA and closes above the PEMA Band.
It is like Buy the Dips & Sell the Rips. The idea of the PEMA Pull-Back is to buy the market at a discount during an uptrend, and sell the market at a premium during a down trend.
2. PEMA Cross Over :-
The PEMA Crossover fires a signal when the fast EMA crosses the slow EMA.
If the fast EMA crosses above the slow EMA, a long signal is fired; whereas, if the fast EMA crosses below the slow EMA, a short signal is fired.
Depending on your trader personality, you will have to choose the periodicities of the two moving averages to suit your taste.
Some combination of EMA's are provided.
3. Double EMA Cross Over :-
A double exponential moving average (DEMA) is basically the EMA of an EMA, meaning the output is the second derivative of the original exponential moving average.
While an EMA is a faster moving average than the SMA, the DEMA is on another level in terms of speed.
4. Modified PEMA Cross Over :-
This system is an ultra-fast PEMA crossover signal that has built-in trend confirmation.
The Modified PEMA Crossover system fires signals in the direction of the prevailing trend, as measured by a larger moving average.
For Example, Take (1,3),21 combination. In this we use 1- and 3-period pivot EMA’s for crossovers, and use a 21-period pivot EMA for trend confirmation.
1 and 3 period EMA's are not shown in the chart, Only 21 EMA and signals are shown for clear view.
Therefore, this system will only allow bullish crossover signals to fire when price is above the 21-period pivot EMA, and will only allow bearish crossover signals to fire when price is below the 21-period average.
In essence, the results are usually highly qualified “buy the dip, and sell rip” type of opportunities.
Disclaimer :-
The PEMA setups that are covered in this indicator offer some of the ways to approach the market using moving averages.
Not all setups and styles of trading will fit all traders, no matter how profitable the approach.
You must use what fits your trader profile and your trading approach.
Thank You ..

Pivot Point Target Prices [SS]Hey everyone,
Back with another indicator!
I have been trying to do this indicator for like months (over 6 months). I gave up on it a few times and then finally reapproached it in a different way and was able to get it working successfully!
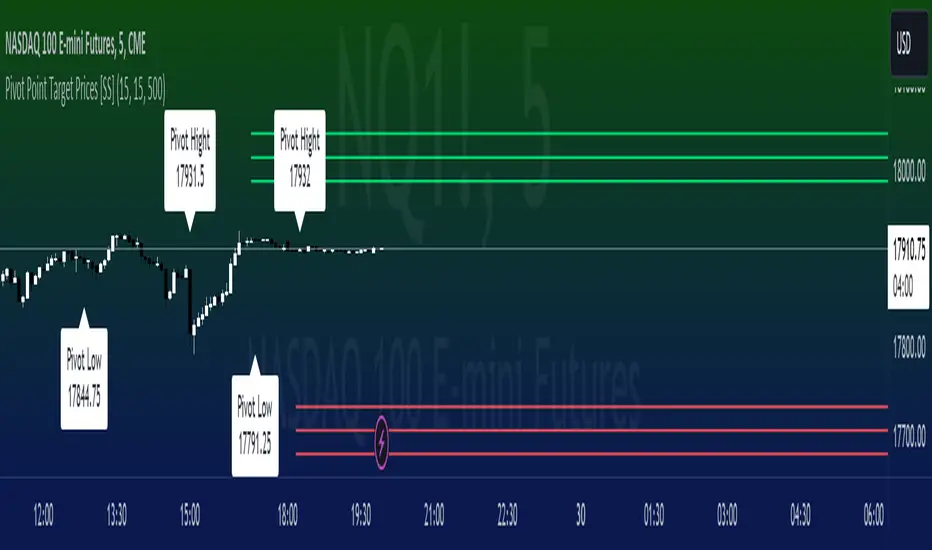
This is the pivot point target price indicator, let's get into how it works!
How it works:
The indicator keeps track of previous pivot highs and lows within your designated lookback timeframe. Using this data, it calculates the average difference between the pivot highs and pivot lows to give you an ATR range.
In addition to this, it tracks the standard deviation of this range. This allows the indicator to give us 3 price targets, 2 standard deviations below the anticipated target, the anticipated target (middle value) and 2 standard deviations above the anticipated target.
Here is a diagram:
I usually only look for the first target, which is the -2 standard deviation below the actual target, but having the added 2 gives some buffer room if a stock is particularly bullish or bearish.
How to use it:
You use this the same way you would pivot points, the only difference is this will show you target ranges to look for on a pivot low or pivot high.
There is some customizability, which I will explain below:
Customize bars: You have the ability to customize left and right bars for your pivot points. I personally like 15 and 15 but I know the most commonly used are 10 and 10.
ATR Length: The ATR Length is defaulted at 500. If you want to tighten up the length and give more conservative targets, you can shorten to between 75 and 150. If you want to be very aggressive with the targets, you can extend to 750 to 1,000.
Toggle on/off labels: You can choose to turn off the pivot labels if you wish.
Important note:
Many pivot indicators will show you pivot levels and use these as support and resistance. This indicator isn't doing that. Its combining ATR and Pivot Points. The ATR gives us the price targets by calculating the average range between pivot highs and pivot lows, and the pivot points are operating as usual.
And that's the indicator!
I hope you enjoy it, like I said it took me forever to get a functioning version of this, so hope you find it helpful!
Safe trades everyone!
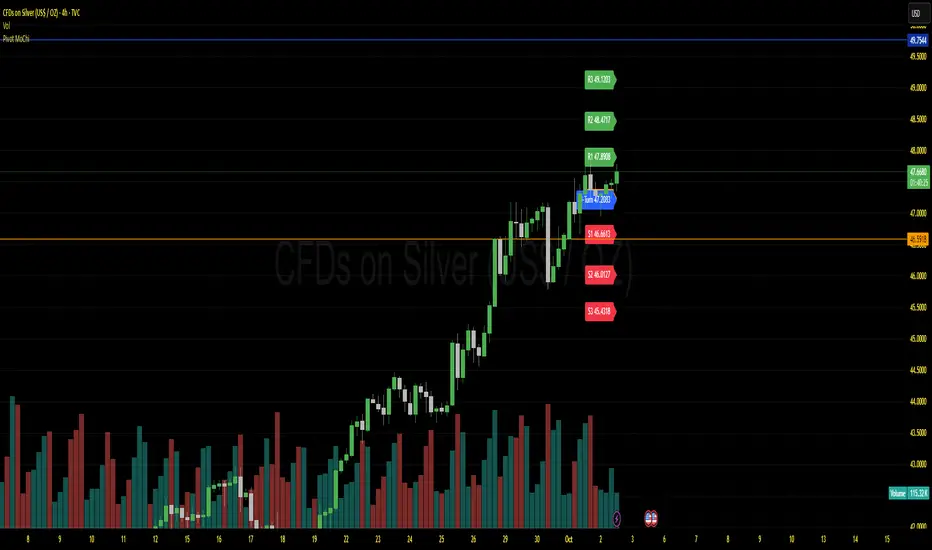
Pivot MoChiThis uses Current Day opening in place of previous day close
More Dynamic than Traditional Pivots
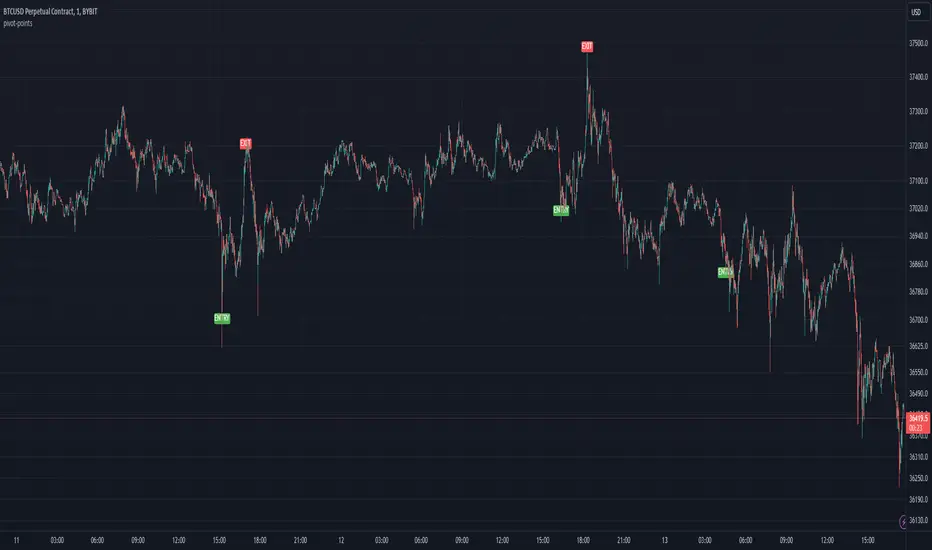
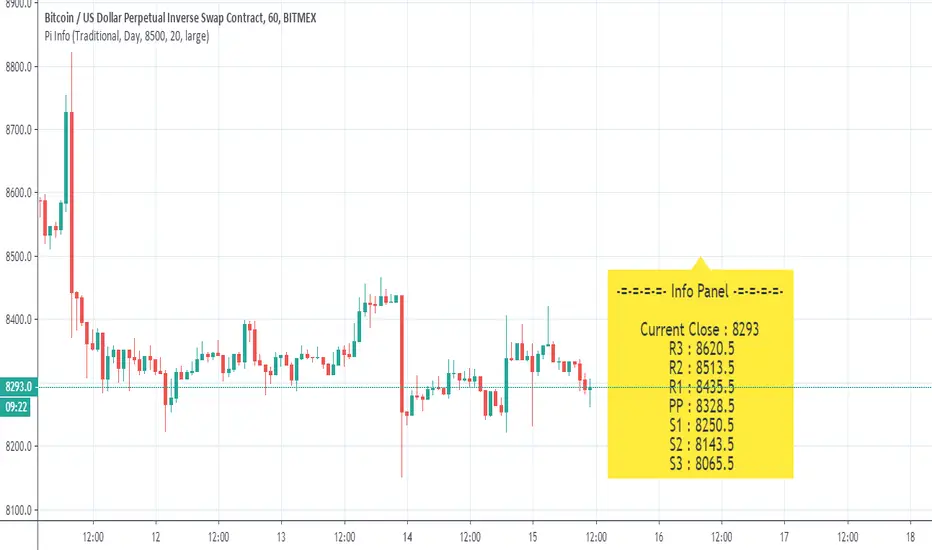
Pivot PointsDescription:
The Pivot Point indicator is designed to identify potential entry and exit points based on pivot points and manually tracks the average entry price and position size without executing actual trades, allowing for a visual simulation of pyramiding strategies.
Inputs for Customization:
i_leverage: User-defined leverage for trades.
i_takeProfit: Percentage for taking profit, adjusted by leverage.
i_dca: Percentage for dollar-cost averaging (DCA) when the price is a certain percentage below the entry, adjusted by leverage.
i_pivotFactor: Factor used to calculate the entry price from the pivot points.
i_pivotLength: The length of the lookback period to calculate the highest and lowest pivot points.
Usage Tips:
This indicator can be use by itself to provide entry and exit signals based on pivot points that will be generated from the provided `Pivot Factor`. An input of 1 will be the same as no factor.
This indicator can also be used as an input source for other indicators to facilitate other ideas.
Pivot HL ~ Om BordaThe Pivot High Low indicator is a technical analysis tool used in financial markets. It identifies significant price levels where an asset's trend may reverse. A Pivot High occurs when an asset's price reaches a peak and then declines. Conversely, a Pivot Low is when the price hits a trough before rising. Traders use these points to make decisions about buying or selling assets. ~ Om Borda

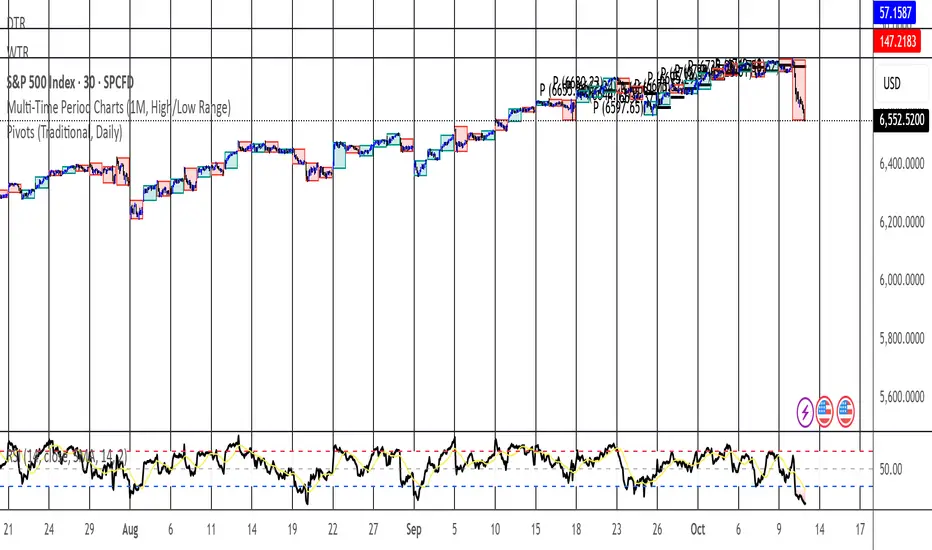
Pivot Points Multi-TimeframeI really enjoy The Pivot Point Standard indicator so I just wanted to see how it looks on lower timeframes. This indicator has additional 15min, 1H and 4H timeframes.

Pivot Points StandardTraditional Pivot Points, I am unsure why i have to make a longer description than that, but apparently i do so here i am making the description longer.
Pivot Points - [RealFact]Description:
The Pivot Points indicator is a powerful tool for identifying potential support and resistance levels based on previous price action. It calculates key pivot levels (P), along with support (S1, S2) and resistance (R1, R2) levels, which are used to forecast potential turning points in the market.
Key Features:
Pivot Calculation: Based on the previous period's high, low, and close prices.
Support and Resistance Levels: Three support (S1, S2) and three resistance (R1, R2) levels.
Customizable Timeframes: Applicable to various timeframes including daily, weekly, and monthly charts.
Visual Representation: Levels are clearly plotted on the chart, making it easy to identify key areas.
Trading Strategies: Useful for breakout, reversal, and trend-following strategies.
How to Use:
Identify Key Levels: Use the pivot point (P) to determine the general market trend.
Support and Resistance: Look for price reactions at S1, S2, R1 and R2 to find potential entry and exit points.
Combine with Other Indicators: Enhance analysis by combining with other technical indicators such as Moving Averages, RSI, or MACD.
Formula:
Pivot Point (P) = (High + Low + Close) / 3
Support 1 (S1) = 2P - High
Resistance 1 (R1) = 2P - Low
Support 2 (S2) = P - (High - Low)
Resistance 2 (R2) = P + (High - Low)
Best Practices:
Confirm with Volume: Look for volume confirmation when price approaches pivot levels.
Avoid False Breakouts: Be cautious of false breakouts and use other indicators to confirm price moves.

Pivot AverageThis is an interesting application of Tradingview's basic Pivot HL indicator.
Pivot Average Indicator takes N number of the most recent Pivot Points (for both High and Low) and computes the average of the pivot points. The average price is then plotted on the chart.
The number of pivot points to average is a user defined variable that can be adjusted in the settings.
One can develop his/her own strategy by using this. One way to use this indicator is to buy when the price breaks above the average of High Pivot points and to sell when the price breaks below the average of Low Pivot points.

Pivot Points High Low (With confirm bar)This script simply adds a visual circle confirmation to visualise the bar when the pivot has been confirmed. It's based on Pivot Points High Low scripts

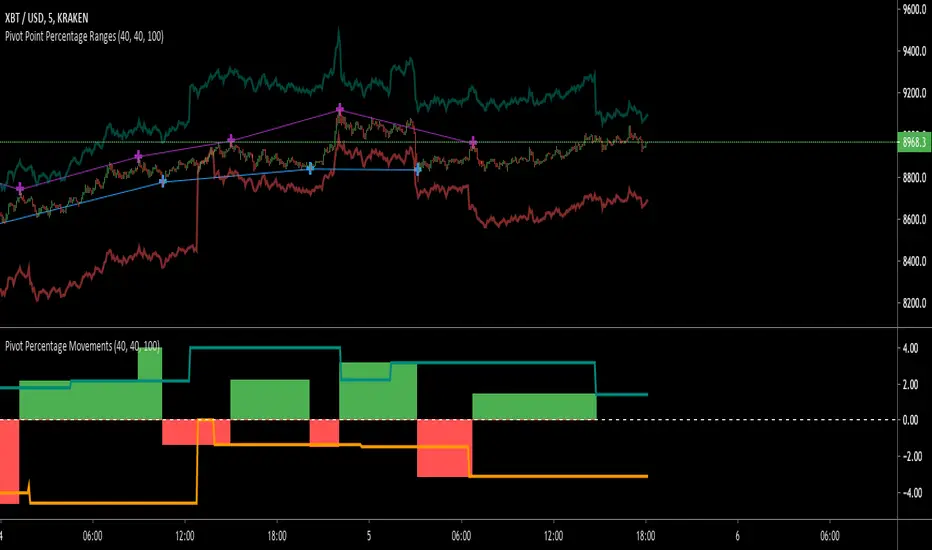
Pivot Point RangesThis script is meant to be a partner script to my Pivot Points Percentage Differences () indicator. It can be used to verify the percentages are what they should be, and give you a visual range in which to trade in.
If you have any questions please feel free to ask!
Pivot Points Standard with Middle PointsA pivot point is a technical analysis indicator, or calculations, used to determine the overall trend of the market over different time frames. The pivot point itself is simply the average of the high, low and closing prices from the previous trading day. I added middle points which are halfways between 2 pivot points as they are regularly revelant for trading.

Pivot Daily Price ColorJust daily pivot with area color:
- price above daily pivot : green area
- price below daily pivot : red area

Pivot Points High Low & Missed Reversal Levels + Alertsmake alert if there come a new high and low, best in 15 min and pivot go from 50 to 15

Pivot Extension Strategy_MoneyManagmentCreated using pinescript version 4, just an updated script of the example Pivot Extension Strategy.


