Recherche dans les scripts pour "pivot"

B3 Weeklies - Pivot S/RBy request, some more of the levels that I like to see. I find that this works well on gold and crude oil the best. Stocks and ETF's sometimes have weird bars in after hours, and this sometimes destroys the week's levels. Any non liquid jump and back bars will likely not be tolerated by the study and ruin its data. The indexes sometimes work, but I find that the other pivot study I released is better for index futures. Forex hasn't been tested on this particular pivot study as of yet. Feel free to comment with your experiences using this with currencies.
This one is designed to show you your current week's action versus last week's action. Fibonacci levels are drawn from the range created by the week before, then offset from pivot HLC/3. These do not reprint so you can trust them to remain the same straight away from Sunday night into Friday's close. On other platforms I can get the next week in future to print as well, showing you where the next week trade levels on Friday before. Maybe I can figure out how to make pinescript print in the right extension, haven't got there yet.
Pretty good selection in 12 days of being a member though, so I am psyched how well this is going in TradingView, learnin' more language all the time. Feel free to leave some feedback, and happy to answer any questions. ~B3

Pivot Reversal Signals - Multi ConfirmationPivot Reversal Signals - Multi-Confirmation System
Overview
A comprehensive reversal detection indicator designed for daytraders that combines six independent technical signals to identify high-probability pivot points. The indicator uses a scoring system to classify signal strength as Weak, Medium, or Strong based on the number of confirmations present.
How It Works
The indicator monitors six key reversal signals simultaneously:
1. RSI Divergence - Detects when price makes new highs/lows but RSI shows weakening momentum
2. MACD Divergence - Identifies divergence between price action and MACD histogram
3. Key Level Touch - Confirms price is at significant support/resistance (previous day high/low, premarket high/low, VWAP, 50 SMA)
4. Reversal Candlestick Patterns - Recognizes bullish/bearish engulfing, hammers, and shooting stars
5. Moving Average Confluence - Validates bounces/rejections at stacked moving averages (9/20/50)
6. Volume Spike - Confirms increased participation (default: 1.5x average volume)
Signal Strength Classification
• Weak (3/6 confirmations) - Small circles for situational awareness only
• Medium (4/6 confirmations) - Regular triangles, viable entry signals
• Strong (5-6/6 confirmations) - Large triangles with background highlight, highest probability setups
Visual Features
• Entry Signals: Green triangles (up) for long entries, red triangles (down) for short entries
• Exit Warnings: Orange X markers when opposing signals appear
• Signal Labels: Show confirmation score (e.g., "5/6") and strength level
• Key Levels Displayed:
o Previous Day High/Low - Solid green/red lines (uses actual daily data)
o Premarket High/Low - Blue/orange circles (4:00 AM - 9:30 AM EST)
o VWAP - Purple line
o Moving Averages - 9 EMA (blue), 20 EMA (orange), 50 SMA (red)
• Background Tinting: Subtle color on strongest reversal zones
Key Level Detection
The indicator uses request.security() to accurately fetch previous day's high/low from daily timeframe data, ensuring precise level placement. Premarket high/low levels are dynamically tracked during premarket sessions (4:00 AM - 9:30 AM EST) and plotted throughout the trading day, providing critical support/resistance zones that often influence price action during regular hours.
Customizable Parameters
• Signal strength thresholds (adjust required confirmations)
• RSI settings (length, overbought/oversold levels)
• MACD parameters (fast/slow/signal lengths)
• Moving average periods
• Volume spike multiplier
• Toggle individual display elements (levels, MAs, labels)
Best Practices
• Use on 5-minute charts for entries, confirm on 15-minute for direction
• Focus on Medium and Strong signals; Weak signals provide context only
• Strong signals (5-6 confirmations) have the highest win rate
• Pay special attention to reversals at premarket high/low - these levels frequently hold
• Previous day high/low often acts as major support/resistance
• Always use proper risk management and stop losses
• Works best in moderately trending markets
Alert Capabilities
Set custom alerts for:
• Strong long/short signals
• All entry signals (medium + strong)
• Exit warnings for open positions
Ideal For
• Daytraders and scalpers (especially SPY, QQQ, and liquid equities)
• Swing traders seeking precise entries
• Traders who prefer confirmation-based systems
• Anyone looking to reduce false signals with multi-factor validation
• Traders who utilize premarket levels in their strategy
Technical Notes
• Uses Pine Script v6
• Premarket hours: 4:00 AM - 9:30 AM EST
• Previous day levels pulled from daily timeframe for accuracy
• Maximum 500 labels to maintain chart performance
• All key levels update dynamically in real-time
________________________________________
Note: This indicator provides signal analysis only and should be used as part of a complete trading strategy. Past performance does not guarantee future results. Always practice proper risk management.

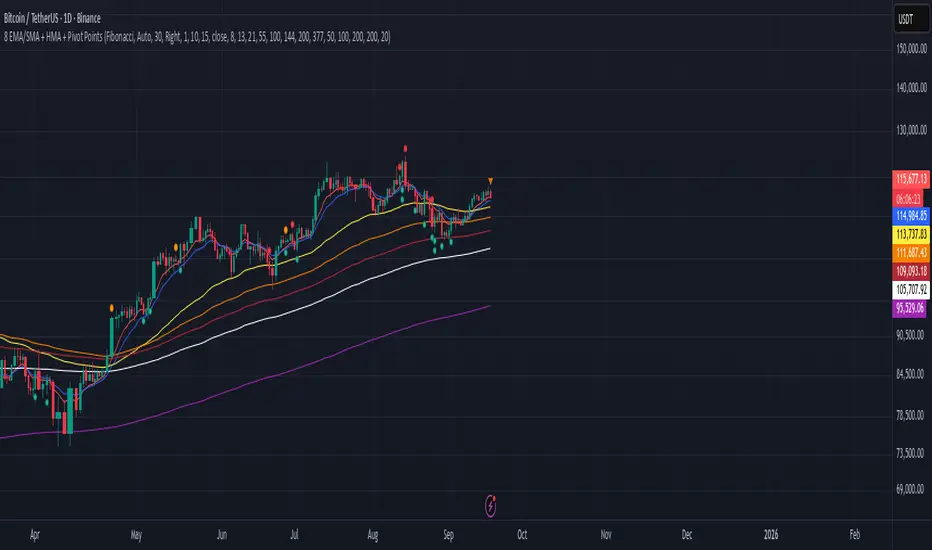
8 EMA/SMA + HMA + Pivot PointsMultiple customizeable Moing average indictors including Hall moving average, Exponential Moving average. Also includes Pivot Point indicator as an all-in-one indicator
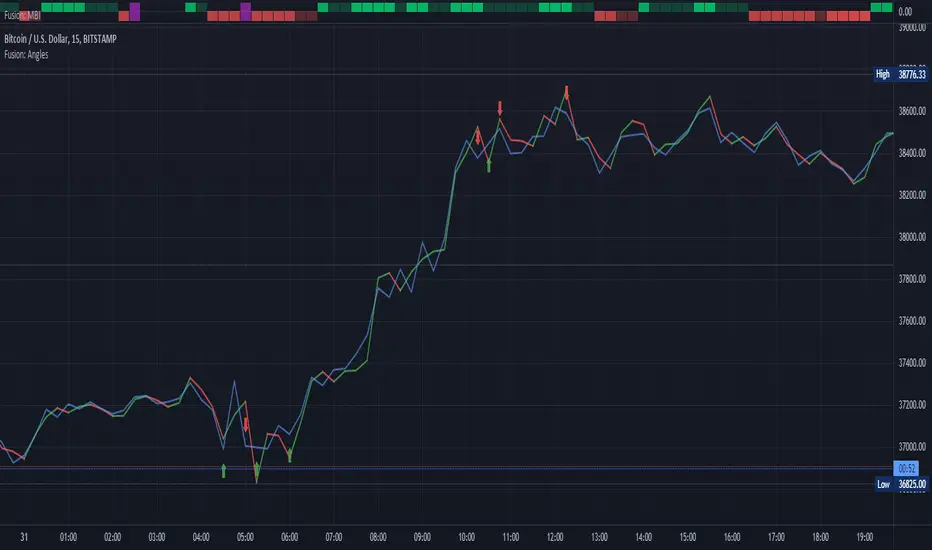
Fusion: Pivot Angles and ThresholdsThis is a somewhat unusual indicator working purely on geometry.
You set a threshold for an angle of a pivot and if the angle is LESS THAN (because the sharper the pivot the smaller the angle) your threshold then a signal is given.
I use this as an exit indicator and it works well for me when other methods don't give a clear signal. Seeing where it shows up it might also make a good entry indicator but I'll leave it up to others to play with that and see if it's a good entry indicator for them. If you find it is good for entries or other things please drop me a note or make a comment, I would appreciate knowing.
If you set the length to 1 for the moving average then it will just use the source and not perform a moving average operation.
There's half a dozen or so moving average types to select from so you will probably find one that suits you pretty well.
The settings are certainly not optimized so set to whatever suits your needs as my defaults will probably be wrong for you.
The code is structured to easily drop into a bigger system so use it as a lone indicator or add the code to some bigger project you are creating. If you do integrate it into something else then send me a note as it would be nice to know it's being well used.
Finally, if you find value please do make a comment, give a thumbs up etc.
Enjoy and good luck!
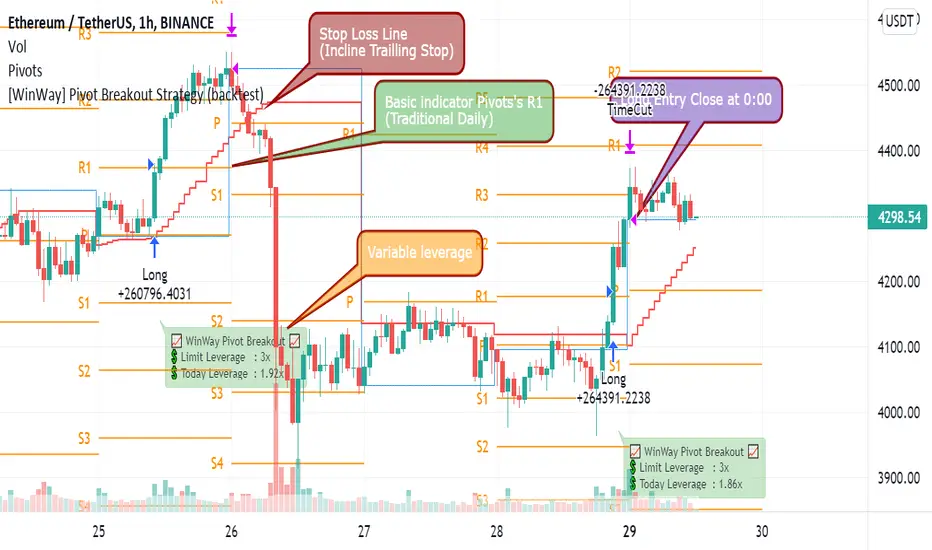
[WinWay] Pivot Breakout Strategy (backtest)This is the Winway's Pivot breaktout,
Using the Pivot point , we made a new volatility breakout strategy.
It's the strategy for ETH / BTC.
Please choose 1H time frame.
No repaint.
"As a long-only day trend strategy, we pursue profits in the downward / transverse / rising market."
- It will be exited based on the closing price of the day as a strategy to take only the day trend.
- It's a long-only strategy without short trade.
- It has high market adaptability in response to market volatility .
"The efficiency has been increased by delicate control of entry volume ."
- Control losses by managing funds in line with market changes.
- Calculate the leverage on the real time automatically.
- It goes in more when it's advantageous and less when it's disadvantageous
- It's a welfare strategy that works against assets
"We further lowered the risk by cutting off in installments."
- If you judge that the trend has declined on the day, you will break off and respond to a sharp drop by using the real time trailing stop.
========================================================================================
윈웨이의 피봇돌파입니다.
피봇 포인트를 이용한 새로운 변동성 돌파 전략입니다.
이더리움과 비트코인을 위한 전략이며
1H 타임프레임으로 선택해주세요
리페인트는 발생하지 않습니다.
롱 온리 당일 추세 전략으로 하락/횡보/상승 장에서 수익을 추구합니다.
- 당일 추세만 취하는 전략으로 일봉 종가 기준 청산됩니다.
- 숏은 없는 롱 온리 전략입니다.
- 시장 변동성에 따라 대응하여 시장 적응력이 높습니다.섬세한 진입 물량 제어로 효율을 높였습니다.
- 시장 변화에 맞춰 자금관리를 하여 손실을 제어합니다.
- 당일 레버리지를 실시간으로 자동 계산합니다.
- 유리할때 더 들어가고, 불리할때 적게 들어갑니다.
- 자산대비로 작동하는 복리 전략입니다.
손절로 리스크를 더욱 낮췄습니다.
- 당일 추세가 꺾였다고 판단하면 손절하여, 실시간 트레일링 스탑을 이용하여 급락에 대응합니다.
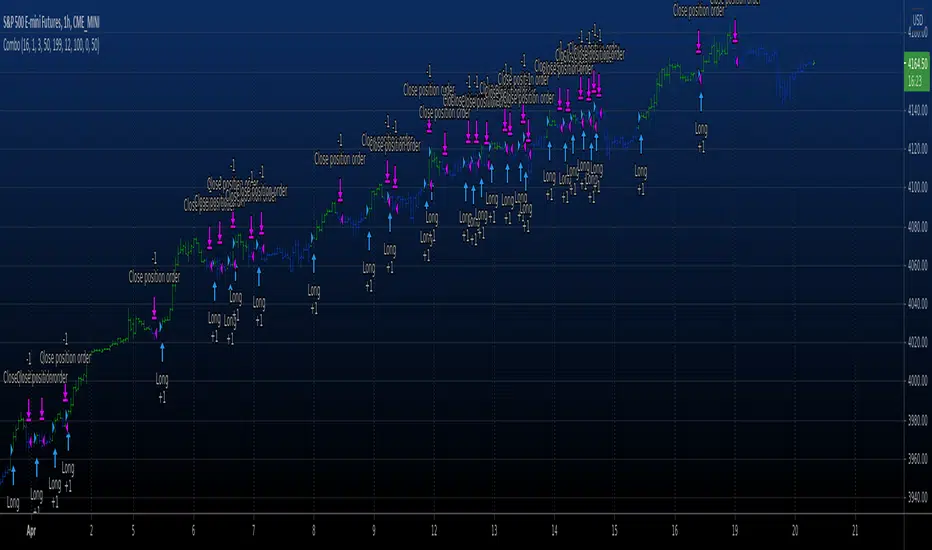
Combo Backtest 123 Reversal & Pivot Detector Oscillator Copyright by HPotter v1.0 20/04/2021
This is combo strategies for get a cumulative signal.
First strategy
This System was created from the Book "How I Tripled My Money In The
Futures Market" by Ulf Jensen, Page 183. This is reverse type of strategies.
The strategy buys at market, if close price is higher than the previous close
during 2 days and the meaning of 9-days Stochastic Slow Oscillator is lower than 50.
The strategy sells at market, if close price is lower than the previous close price
during 2 days and the meaning of 9-days Stochastic Fast Oscillator is higher than 50.
Second strategy
The Pivot Detector Oscillator, by Giorgos E. Siligardos
The related article is copyrighted material from Stocks & Commodities 2009 Sep
WARNING:
- For purpose educate only
- This script to change bars colors.
Chonky Pivot Pointsstandard pivot points re-written with circle plots.
Only shows the current pivot points. P, R1/R2, S1/S2
I don't use R3, R4 etc. so I didnt include them but feel free to modify the code.
You can change the resolution in indicator settings, default is set to Monthly.
Also to change the size of the circles all at once, you can input a number 1-4 in the inputs section.

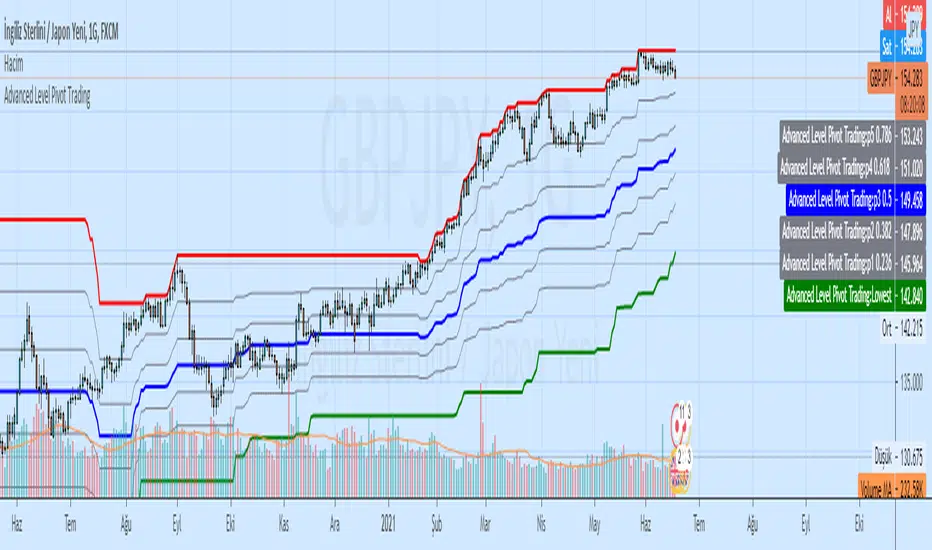
Advanced Level Pivot TradingAdvanced Level Pivot Trading
Highest Lowest Channel and Level Pivot (Fibonacci)


SMA/pivot/Bollinger/MACD/RSI en pantalla gráficoMulti-indicador con los indicadores que empleo más pero sin añadir ventanas abajo.
Contiene:
Cruce de 3 medias móviles
La idea es no tenerlas en pantalla, pero están dibujadas también. Yo las dejo ocultas salvo que las quiera mirar para algo.
Lo que presento en pantalla es la media lenta con verde si el cruce de las 3 marca alcista, amarillo si no está claro y rojo si marca bajista.
Pivot
Normalmente los tengo ocultos pero los muestro cuando me interesa. Están todos aunque aparezcan 2 seguidos.
Bandas de Bollinger
No dibujo la línea central porque empleo la media como tal.
Parabollic SAR
Lo empleo para dibujar las ondas de Elliott como postula Matías Menéndez Larre en el capítulo 11 de su libro "Las ondas de Elliott". Así que, aunque se puede mostrar, lo mantengo oculto y lo que muestro es dónde cambia (SAR cambio).
MACD
No está dibujado porque necesitaría sacarlo del gráfico.
Marco en la parte superior cuándo la señal sobrepasa al MACD hacia arriba o hacia abajo con un flecha indicando el sentido de esta señal.
RSI
Similar al MACD pero en la parte inferior.
Probablemente, programe otro indicador para visualizar en una ventanita MACD, RSI y volumen todo junto. El volumen en la principal hay veces que no te permite ver bien alguna sombra y los otros 2 te quitan mucho espacio para graficar si los tienes permanentemente en 2 ventanas separadas.
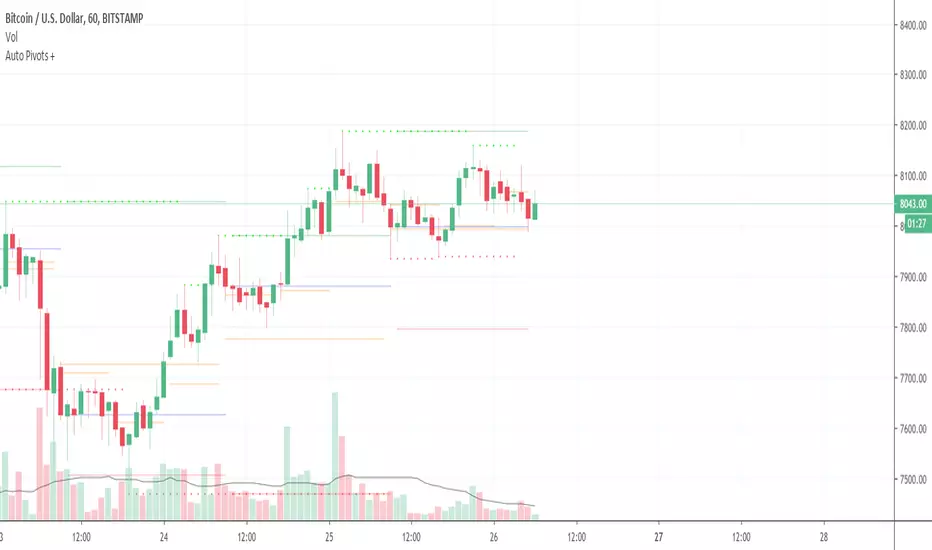
Auto Pivot PointsThis indicator plots a Pivot Point and 3 Support and Resistance lines that automatically adapt to the Timeframe
These can also be plotted against a Custom Timeframe
Floor Trader Pivot PointsAdds plotting of daily pivot point which acts as a demarcation between bullish/bearish market sentiment.

10 indicators in 1 : MACD RSI PIVOT EMA-CROSS and 7 EMA/SMA10 indicators in 1
MACD
RSI
PIVOT weekly:best
200 sma
100 sma
75 ema
55 ema
50 sma
20 ema
Golden EMA Crossover 13/48 based on tests Results of 1750 Moving Average Crossovers
Alert included, You can find "Bullish signal" and "Bearish signal" When you add Alert

Hybrid Pivot Zones [DW]This is an experimental study designed to identify potential areas of support and resistance using a hybrid between Camarilla and Fibonacci pivot calculations.
The levels are calculated by taking 110% of the previous interval's range multiplied by 8.33%, 16.67%, 25%, 50%, 61.8%, 78.6%, 100%, 127.2%, 141.4%, and 161.8%, then adding them above and below the interval open.
Custom bar colors are included.

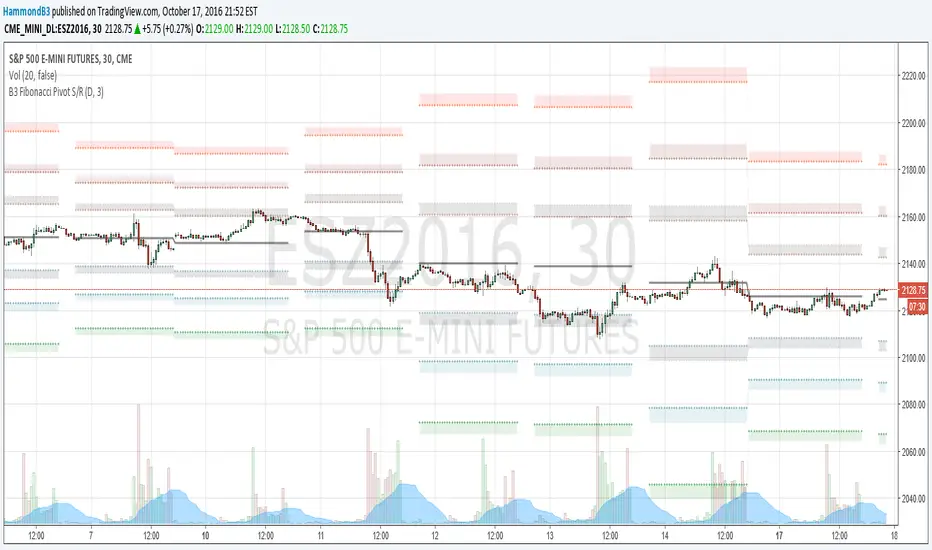
B3 Fibonacci Pivot S/RFor my second share, I give you some levels I look at everyday for the ES minis. HLC/3 of the MTF (multi-time-frame) inputs = mean and Fib-levels formed as support and resistance zones. There are some websites that will show you 20 ways to figure out a pivot for the day's intraday workings, and this one always rang true for me. I keep it set at Res=D and Len=3or5 and use on hourly charts. This indicator is capable of doing like a Res=60m Len=8 for a 5m chart or something of that nature if you wish to test it out.
I haven't tested it out for tick charts and I have noticed that this is good on index and commodity futures, and not so much other things.
Uncanny to me how well this works as reversal awareness for ES. Doesn't mean that one will happen, or if it does that it will have trade-able juice, though it is very important awareness never-the-less.
screencast.com

Pivot Sniper (Double RSI, Safe Zones, Divergence, Trend Sensor)Pivot Sniper establishes safe zones to trade at the top half or bottom half of the market using 1000 bar highest high and lowest low respectively. It makes entry decisions scanning for a special RSI pattern and then confirms using Divergence and whether it is above or below a moving average. It also has a trend sensor that avoid betting against long running trends.
Use on a 5 minute chart only. It needs this resolution to make it's decisions. It is designed for forex only.
If you would like access to try this script out post below or message me.
Thanks, Doug


