Alpha Capital Wealth - Supertrend Any Crypto Any TimeframeAlpha Capital Wealth - Supertrend Any Crypto Any Timeframe
Recherche dans les scripts pour "supertrend"

ACW SUPERTREND v3 as per testing
xbtusd works fine on 5,15,30 and above
100% accuracy on 30mins
ethusd works on any time frame
100% accuracy on 30mins
updated the code script to provide go long , go short 2/3 candles as compared to acw supertrend v2
script is still being updated

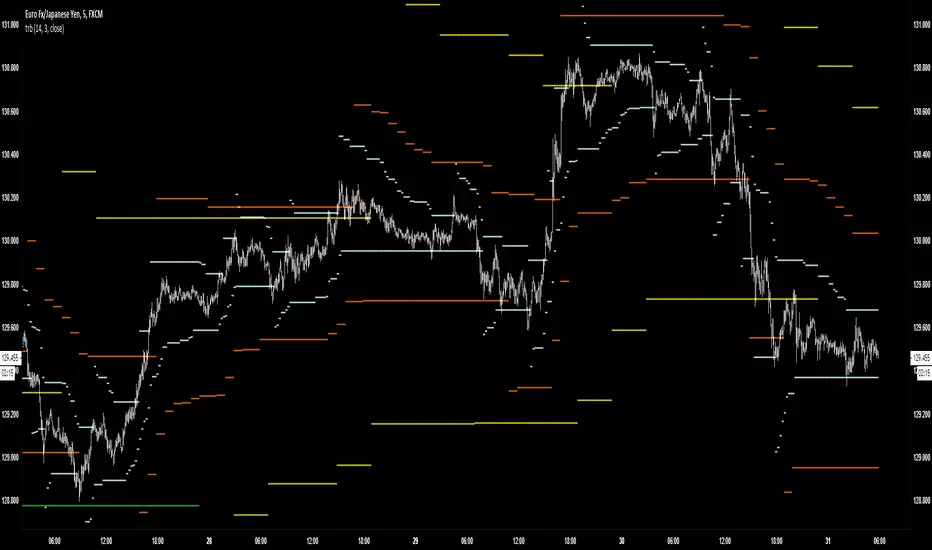
TRBTrue Range Bands; the 'Supertrend', also known as a volatility stop, using a 14 period length and 3x multiplier.


CPR PIVOT, 2ST, 5MA, VWAPSUPERTREND
2 supertrend with diffrent patameters.
MOVING AVERAGE RIBBON
5 differenT EMA
VWAP
Simple vwap with bands nothing special
every parameters and looks can be change
AND CPR


SuperTrend Zone Rejection [STRZ] CONCEPT -
This indicator identifies trend-continuation setups by combining the Super Trend with dynamic Average True Range (ATR) value zones. It highlights specific price action behaviour's—specifically wick rejections and momentum closes—that occur during pullbacks into the trend baseline.
HOW IT WORKS -
The script operates on three logic gates:
>> Trend Filter: Uses a standard Super Trend (Factor 3, Period 10 default) to define market direction.
>> Dynamic Zones: Projects a volatility-based zone (default 2.0x ATR) above or below the Super Trend line to define a valid pullback area.
>> Signal Detection: Identifies specific candle geometries occurring within these zones.
>> Rejection: Candles with significant wicks testing the zone support/resistance.
>> Momentum: Candles that open within the zone and close in the upper/lower quartile of their range.
FEATURES -
>> Dynamic Channel: Visualizes the active buy/sell zone using a continuous, non-repainting box.
>> Volatile Filtering: Filters out low-volatility candles (doji's/noise) based on minimum ATR size.
>> Visuals: Color-coded trend visualization with distinct signal markers for qualified entries.
SETTINGS -
>> Super Trend: Adjustable Factor and ATR Period.
>> Zone Multiplier: Controls the width of the pullback zone relative to ATR.
>> Visuals: Customizable colours for zones and signals to fit light/dark themes.

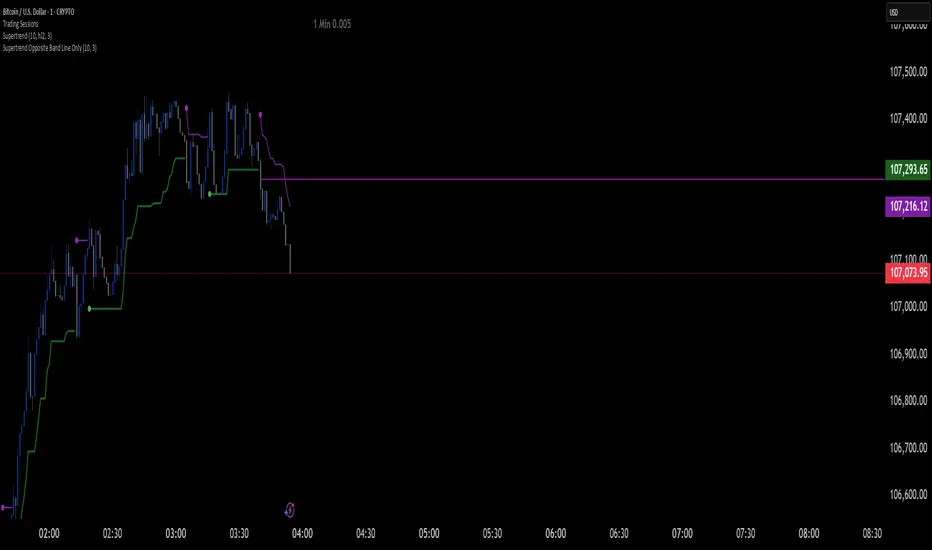
Supertrend Opposite Band Line Onlywhen super trend changes Trend , its important to wait for crossing the Price line of opposite Band so i have written this script . this will help you Traders for sure
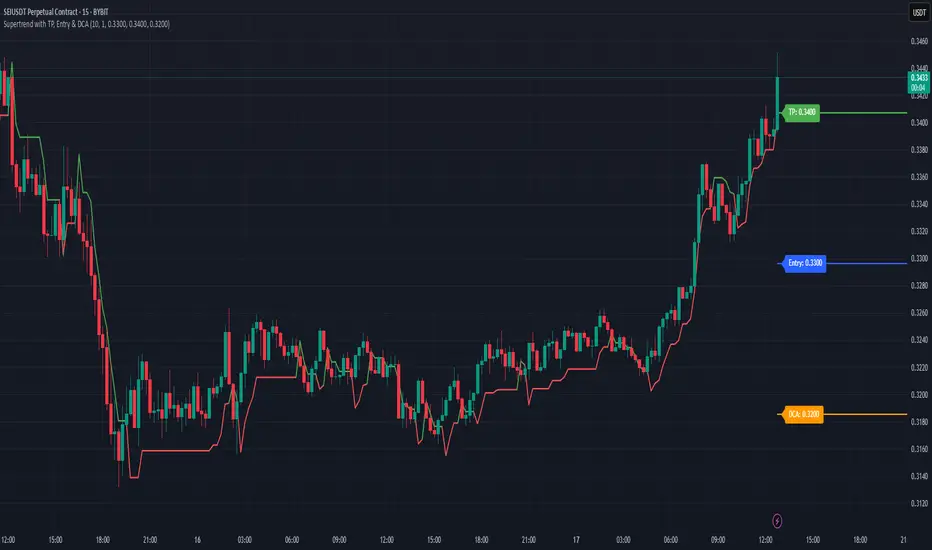
Supertrend with TP, Entry & DCAThis script is super trend plus, horizontal lines for Take Profit, Entry Price and DCA.
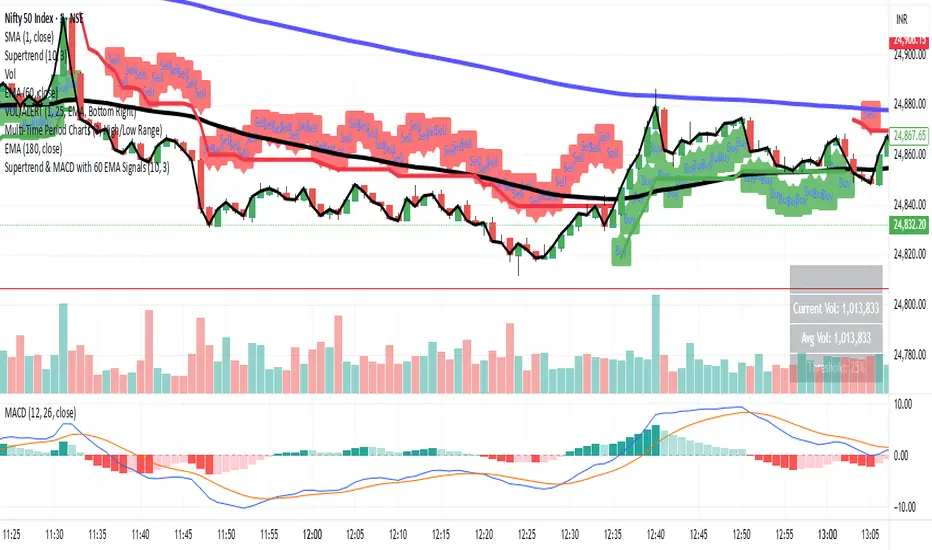
Supertrend & MACD with 60 EMA Signalsthis is a great way to understand market without getting biased ...excellent for intraday entry
SuperTrend VolatilityThis indicator is actually composition of 3 indicator to one common one
it based on super trend , OBV and volatility % range
obv act as our source for the super trend to make it more sensitive
you can control it as a regular super trend + the addition of volatility % range (volatility factor)
so 1 is volatility range , can be from 0.1 to 5 depend on your liking.
i set it here in this example of btc 4 hour chart to be 0.5 which is 1/2 of the volatility % range since it fitted better this particular asset . for stock i prefer 1 as my factor
this indicator as i normally do have alert and signal inside.
the aim of this indicator is to maximize trend on one hand and other to keep sensitivity high
one of the problem with regular super trend that as we keep the we increase the trend to be longer it lose sensitivity .
by this method that i show here i try to minimize that bad effect and make it both sensitive and more responsive. this is one of the reason i use a modified version of OBV as a source to it .
for each asset that you use try to find the best fit so this model can work properly
here apple with factor=1 as range
on daily it better half of volatility range
NIO
gold 4 hour
gold 1 hour


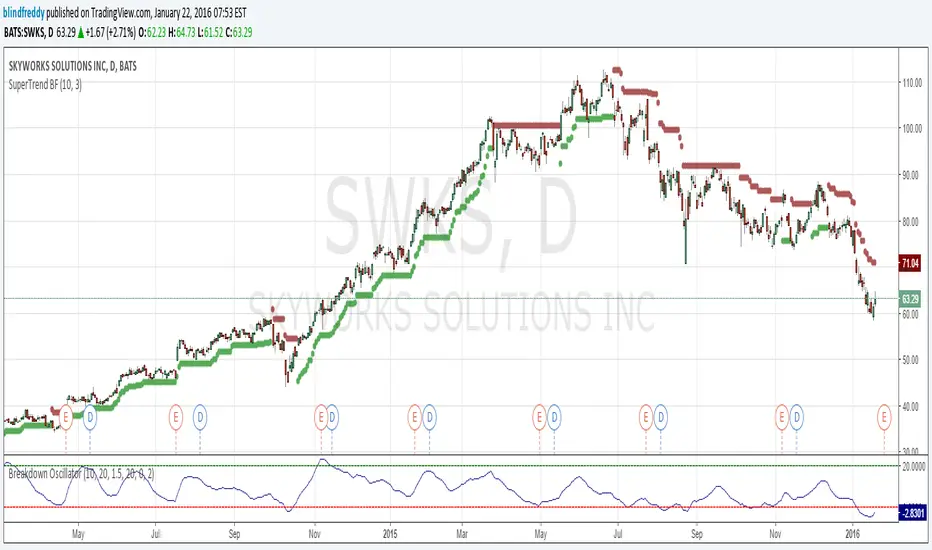
SuperTrend BFI am republishing this indicator as something changed within TradingView's script engine so that the old script ceased to function ( a minor syntax error that used to be acceptable but no longer is).
Anyhow here's the fixed version which as you can see has done a great job of keeping us on the right side of the trend with once-hot stocks like Skyworks !
Multitime ATR with ATR Heat Line# Multi-Timeframe ATR Supertrend with ATH Finder
## Overview
This advanced Pine Script indicator combines multi-timeframe ATR-based Supertrend analysis with an All-Time High (ATH) tracking system. Designed for swing traders who need comprehensive trend analysis across multiple timeframes while monitoring key price levels.
## Key Features
### 1. Multi-Timeframe ATR Supertrend (1H, 4H, 1D)
- **1 Hour Supertrend** (Blue): Short-term trend identification
- **4 Hour Supertrend** (Purple): Medium-term trend confirmation
- **1 Day Supertrend** (Green/Red): Primary trend direction
- Each timeframe displays independent trend lines with customizable colors and visibility
### 2. Dual ATR Data System (1D Only)
- **Previous Day ATR** (lookahead_off): Used for main ATR lines - enables pre-market study and avoids intraday crossover issues
- **Current Day ATR** (lookahead_on): Used for Overheating Line calculation - provides real-time profit-taking signals
### 3. Overheating Line
- Dynamically calculated as: `1D ATR + (ATR Width × 1.3)`
- Orange line indicating potential overextension zones
- Uses current day real-time ATR for intraday decision-making
- Only displays during uptrends
- Customizable multiplier (default: 1.3)
### 4. ATH (All-Time High) Finder
- Automatically tracks and displays the all-time high with a horizontal line
- **Line Color**: Lime green (customizable)
- **Label System**:
- Green label when price is at ATH
- Red label when ATH is historical
- Toggle label visibility independently
- **Bug Fix**: Prevents vertical line display when ATH occurs on current bar
- Line extends to the right for easy visualization
### 5. Warning & Break Signals
Each timeframe provides two types of alerts:
- **Warning Signal** (⚠️): Price closes below uptrend line (potential reversal warning)
- **Break Signal** (⚡): Price closes above downtrend line (potential breakout)
- Smart timing intervals prevent signal spam:
- 1H: Checks every 4 hours (warning) / 1 hour (break)
- 4H/1D: Max 2 signals per day
### 6. Trend Change Indicators
- Small circles mark the exact bar where trend changes occur
- Color-coded for each timeframe
- Helps identify reversal points and trend strength
### 7. Master Control Switches
Efficiently manage all visual elements:
- **Master Highlighter**: Toggle all background fills on/off
- **Master Signals**: Toggle all warning/break signals
- **Master Up Trend**: Toggle all uptrend lines and circles
- **Master Down Trend**: Toggle all downtrend lines and circles
### 8. Fast Cut Lines (Optional)
- Additional support/resistance lines offset by a percentage from main ATR lines
- Useful for tighter stop-loss management
- Separate controls for up and down trends
- Default: OFF (customizable offset percentage)
### 9. Timeframe Visibility Control
- **Hide on Daily+**: Automatically hides indicators (except 1D ATR) on daily timeframes and above
- Reduces chart clutter on higher timeframes
- 1D ATR always visible regardless of chart timeframe
### 10. EMA Integration (Optional)
- Display 20/50/200 EMAs for confluence with ATR trends
- Toggle on/off independently
## Use Cases
### For Swing Traders
1. **Entry Timing**: Wait for multiple timeframe alignment (1H, 4H, 1D all in uptrend)
2. **Trend Confirmation**: Use trend change circles to identify momentum shifts
3. **Profit Taking**: Monitor Overheating Line for potential exit zones
### For Position Management
1. **Stop Loss Placement**: Use 1D ATR line or Fast Cut lines as dynamic stop levels
2. **Risk Assessment**: Distance between timeframe ATR lines indicates volatility
3. **Breakout Trading**: Break signals (⚡) identify potential breakout opportunities
### For Pre-Market Analysis
- 1D ATR uses previous day data, allowing traders to:
- Study support/resistance levels before market open
- Plan entry/exit strategies based on confirmed data
- Avoid false signals from incomplete daily candles
## Settings Guide
### ATH Finder Settings
- **Show ATH Line**: Toggle ATH line visibility
- **Show ATH Label**: Toggle ATH label display (can hide label while keeping line)
- **ATH Line Color**: Customize line color (default: lime)
- **ATH Line Width**: Adjust line thickness (1-5)
### Timeframe Settings (Each timeframe has independent controls)
- **ATR Period**: Lookback period for ATR calculation (default: 10)
- **ATR Multiplier**: Distance multiplier from price (default: 1.0)
- **Show Label**: Display " " / " " / " " text labels
- **Show Warning/Break Signals**: Toggle alert symbols
- **Highlighter**: Toggle background fill between price and ATR line
### Overheating Line Settings
- **Show Overheating Line**: Toggle visibility
- **Overheating Multiplier**: Adjust distance above 1D ATR (default: 1.3)
### Cut Lines Settings
- **Show Fast Cut Line (Up/Down)**: Toggle visibility
- **Fast Cut Offset %**: Percentage distance from ATR lines (default: 1.0%)
## Color Scheme
- **Current TF**: Green (up) / Red (down)
- **1H ATR**: Blue (#1848cc) / Dark Blue (#210ba2)
- **4H ATR**: Purple (#7b1fa2) / Dark Purple (#4e0f60)
- **1D ATR**: Green (#4caf50) / Dark Red (#8c101a)
- **Overheating Line**: Orange (#ff9800)
- **ATH Line**: Lime (customizable)
## Technical Notes
### ATR Calculation
- Uses True Range for volatility measurement
- Option to switch between SMA and EMA calculation methods
- Adapts to both volatile and stable market conditions
### Performance Optimization
- Maximum 500 lines and 500 labels to prevent memory issues
- Bar index limitations prevent historical data errors
- Efficient repainting prevention for 1D timeframe
### Alert System
Built-in alert conditions for:
- Buy/Sell signals (Current TF)
- Warning signals (all timeframes)
- Break signals (all timeframes)
## Best Practices
1. **Multiple Timeframe Confirmation**: Don't trade against higher timeframe trends
2. **Overheating Awareness**: Consider profit-taking when price reaches orange line
3. **ATH Monitoring**: Exercise caution near all-time highs (increased volatility risk)
4. **Signal Filtering**: Use warning signals as alerts, not immediate action triggers
5. **Stop Loss Management**: Place stops below the most relevant ATR line for your timeframe
## Version Information
- Pine Script Version: 5
- Indicator Type: Overlay
- Max Lines: 500
- Max Labels: 500
## Credits
Created by @yohei ogura with <3
Modified for Multi-Timeframe functionality with ATH tracking

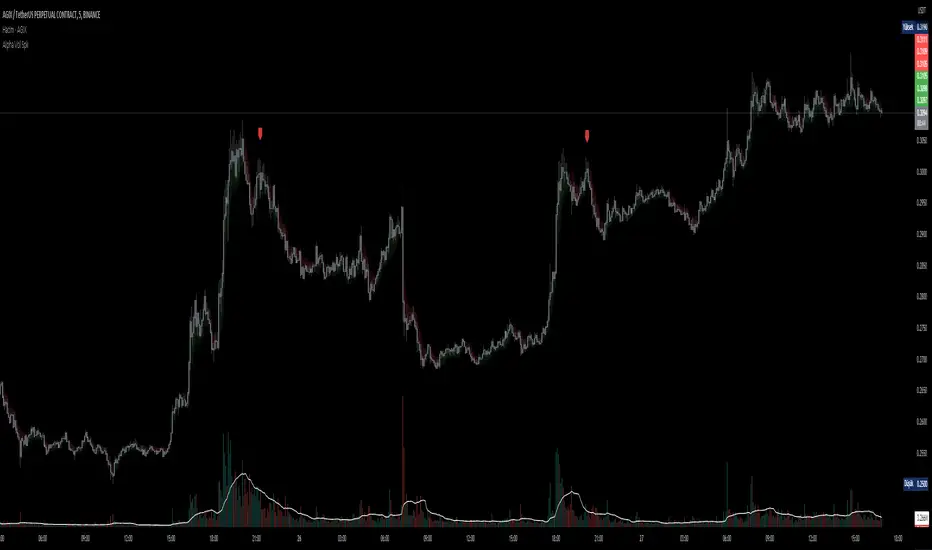
D-BoT Alpha Volume SpikeHello traders, Let me explain the code and provide an example of how to trade using this indicator.
The code you provided is a Pine Script indicator that combines multiple technical indicators, such as Supertrend, ADX, RSI, and MFI, to generate buy and sell signals. Here's a breakdown of the code:
User Settings:
The user can adjust parameters like overbought_limit, oversold_limit, volume_multiplier, volume_ma_length, volume_spike_multiple, lookback_period, and use_extremities_confirmation according to their preference.
Calculate Supertrend:
The Supertrend indicator is calculated using three different ATR lengths (supertrend_atr_period1, supertrend_atr_period2, supertrend_atr_period3) and corresponding factors (supertrend_factor1, supertrend_factor2, supertrend_factor3).
The supertrend_value1, supertrend_value2, and supertrend_value3 represent the Supertrend values, while trend_direction1, trend_direction2, and trend_direction3 indicate the trend direction (negative for downtrend, positive for uptrend).
Candle calculations:
The high and low values are checked to identify bullish and bearish candles based on specific conditions.
Volume Spikes:
Volume spikes are detected by comparing the current volume with a median volume over a specified lookback period.
If the volume exceeds a certain multiple of the median volume and the DI+ value is greater than the DI- value, an "up" signal is generated. Similarly, if the DI- value is greater than the DI+ value, a "down" signal is generated.
Additional Filters (RSI and MFI):
Relative Strength Index (RSI) and Money Flow Index (MFI) are used as additional filters.
The RSI and MFI parameters can be adjusted according to the user's preference.
The signals generated by the volume spikes are filtered based on RSI and MFI conditions.
Plotting:
The indicator plots shapes (triangles) to represent buy and sell signals.
The Supertrend lines are plotted using different colors and transparency levels based on the distance from the current price.
The "bodyMiddle" plot is used for filling the area between the Supertrend lines.
Example Trade Scenario:
Let's consider an example trade scenario using this indicator:
When the indicator generates an "up" signal (trendBuy = true), indicating a potential bullish trend, and all the confirmation conditions (RSI, MFI, Supertrend) are met, you can consider opening a long position.
Conversely, when the indicator generates a "down" signal (trendSell = true), indicating a potential bearish trend, and all the confirmation conditions are met, you can consider opening a short position.
Remember, this is just an example, and it's crucial to perform thorough analysis and consider other factors before making trading decisions. It's recommended to backtest the strategy, assess risk management, and apply appropriate position sizing techniques.
Please note that the code provided is a simplified version, and there might be additional factors and considerations specific to your trading strategy that are not included in this code. *******"I have also reviewed the following indicators, and the volume calculation approaches of my friends have been very helpful in creating this indicator: "Volume Spikes " © tradeforopp and "Volume Spikes & Growing Volume Signals With Alerts & Scanner" © FriendOfTheTrend."*******
The Quantum Leap: Renko + ML(Note: This indicator uses the BackQuant & SuperTrend which takes a 4-5 seconds to load)
This strategy uses the following indicators (please see source code)
Synthetic Renko: Ignores time and focuses purely on price movement to detect clear trend reversals (Red-to-Green).
ATR (Average True Range): Measures volatility to calculate the Renko brick sizes and SuperTrend sensitivity.
Adaptive SuperTrend: A trend filter that uses volatility clustering to confirm if the market is currently in a "Bearish" state.
RSI (Relative Strength Index): A momentum gauge ensuring the asset is "Oversold" (exhausted) before we consider a setup.
Monthly Pivots: Horizontal support lines based on last month's data acting as price "floors" (S1, S2, S3).
SMA (Simple Moving Average): A 100-bar average ensuring we are strictly buying below the long-term mean (deep value).
BackQuant (KNN): A Machine Learning engine that compares current data to historical patterns to predict immediate momentum.
This is a sophisticated, multi-stage strategy script. It combines "Old School" price action (Renko) with "New School" Machine Learning (KNN and Clustering).
Here is the high-level summary of how we will break this down:
Topic 1: The "Bottom Hunter" Setup. How the script uses Renko bricks and aggressive filtering (SuperTrend, SMA, RSI, Pivots) to find a potential market bottom.
Topic 2: The ML Engine (BackQuant & SuperTrend). How the script uses K-Nearest Neighbors (KNN) to predict momentum and Volatility Clustering to adjust the SuperTrend.
Topic 3: The "Leap" Execution. How the script synchronizes the Setup (Topic 1) with the ML Trigger (Topic 2) using a time window.
Topic 1: The "Bottom Hunter" Setup
This script is designed as a Mean Reversion strategy (often called "catching a falling knife" or "bottom fishing"). It is trying to find the exact moment a downtrend stops and reverses.
Most strategies buy when price is above the 200 SMA or above the SuperTrend. This script does the exact opposite.
The Logic:
Renko Bricks: It simulates Renko bricks internally (without changing your chart view). It waits for a specific pattern: A Red Brick followed immediately by a Green Brick (a reversal).
The "Bearish" Filters: To generate a "WATCH" signal, the following must be true:
Price < SuperTrend: The market must officially be in a downtrend.
Price < SMA: Long-term trend is down.
Price < Monthly Pivot: Price is deeply discounted.
RSI < Threshold: The asset is oversold (exhausted).
Recommended Settings for daily signals for Stocks :
Confirmation : 10. (How many bars after Renko Buy signal the AI has to identify a bullish move).
Percentage : 2 (This is the Renko bar size. This represents 2% move.)
SMA: 100 (Signal must be found below 100 SMA)
Price must be below: PIVOT (This is the monthly Pivot levels)

IU Trailing Stop Loss MethodsThe 'IU Trailing Stop Loss Methods' it's a risk management tool which allows users to apply 12 trailing stop-loss (SL) methods for risk management of their trades and gives live alerts when the trailing Stop loss has hit. Below is a detailed explanation of each input and the working of the Script.
Main Inputs:
- bar_time: Specifies the date from which the trade begins and entry price will be the open of the first candle.
- entry_type: Choose between 'Long' or 'Short' positions.
- trailing_method: Select the trailing stop-loss method. Options include ATR, Parabolic SAR, Supertrend, Point/Pip based, Percentage, EMA, Highest/Lowest, Standard Deviation, and multiple target-based methods.
- exit_after_close: If checked, exits the trade only after the candle closes.
Optional Inputs:
ATR Settings:
- atr_Length: Length for the ATR calculation.
- atr_factor: ATR multiplier for SL calculation.
Parabolic SAR Settings:
- start, increment, maximum: Parameters for the Parabolic SAR indicator.
Supertrend Settings:
- supertrend_Length, supertrend_factor: Length and factor for the Supertrend indicator.
Point/Pip Based:
- point_base: Set trailing SL in points/pips.
Percentage Based:
- percentage_base: Set SL as a percentage of entry price.
EMA Settings:
- ema_Length: Length for EMA calculation.
Standard Deviation Settings:
- std_Length, std_factor: Length and factor for standard deviation calculation.
Highest/Lowest Settings:
- highest_lowest_Length: Length for the highest/lowest SL calculation.
Target-Based Inputs:
- ATR, Point, Percentage, and Standard Deviation based target SL settings with customizable lengths and multipliers.
Entry Logic:
- Trades initiate based on the entry_type selected and the specified bar_time.
- If Long is selected, a long trade is initiated when the conditions match, and vice versa for Short.
Trailing Stop-Loss (SL) Methods Explained:
The strategy dynamically adjusts stop-loss based on the chosen method. Each method has its calculation logic:
- ATR: Stop-loss calculated using ATR multiplied by a user-defined factor.
- Parabolic SAR: Uses the Parabolic SAR indicator for trailing stop-loss.
- Supertrend: Utilizes the Supertrend indicator as the stop-loss line.
- Point/Pip Based: Fixed point-based stop-loss.
- Percentage Based: SL set as a percentage of entry price.
- EMA: SL based on the Exponential Moving Average.
- Highest/Lowest: Uses the highest high or lowest low over a specified period.
- Standard Deviation: SL calculated using standard deviation.
Exit Conditions:
- If exit_after_close is enabled, the position will only close after the candle confirms the stop-loss hit.
- If exit_after_close is disabled, the strategy will close the trade immediately when the SL is breached.
Visualization:
The script plots the chosen trailing stop-loss method on the chart for easy visualization.
Target-Based Trailing SL Logic:
- When a position is opened, the strategy calculates the initial stop-loss and progressively adjusts it as the price moves favorably.
- Each SL adjustment is stored in an array for accurate tracking and visualization.
Alerts and Labels:
- When the Entry or trailing stop loss is hit this scripts draws a label and give alert to the user that trailing stop has been hit for the trade.
Note - on the historical data The Script will show nothing if the entry and the exit has happened on the same candle, because we don't know what was hit first SL or TP (basically how the candle was formed on the lower timeframe).
Summary:
This script offers flexible trailing stop-loss options for traders who want dynamic risk management in their strategies. By offering multiple methods like ATR, SAR, Supertrend, and EMA, it caters to various trading styles and risk preferences.

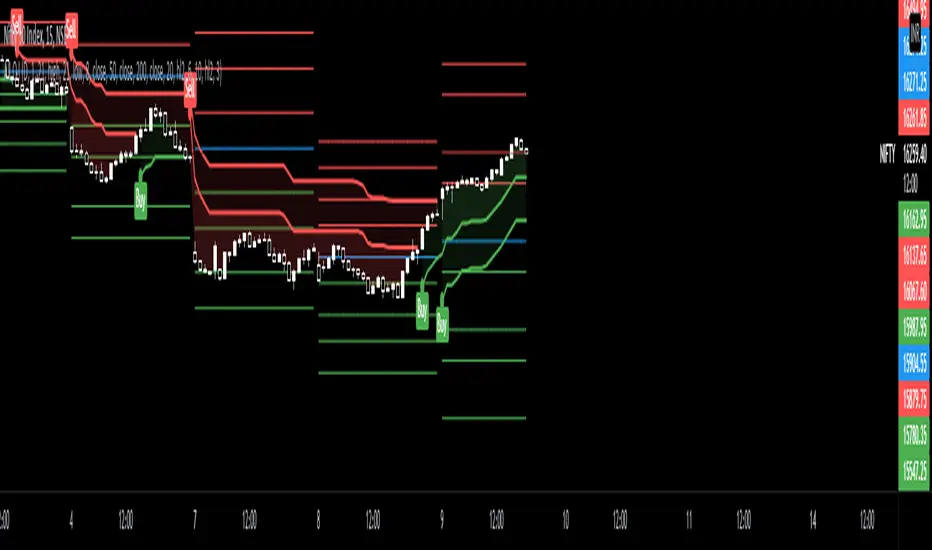
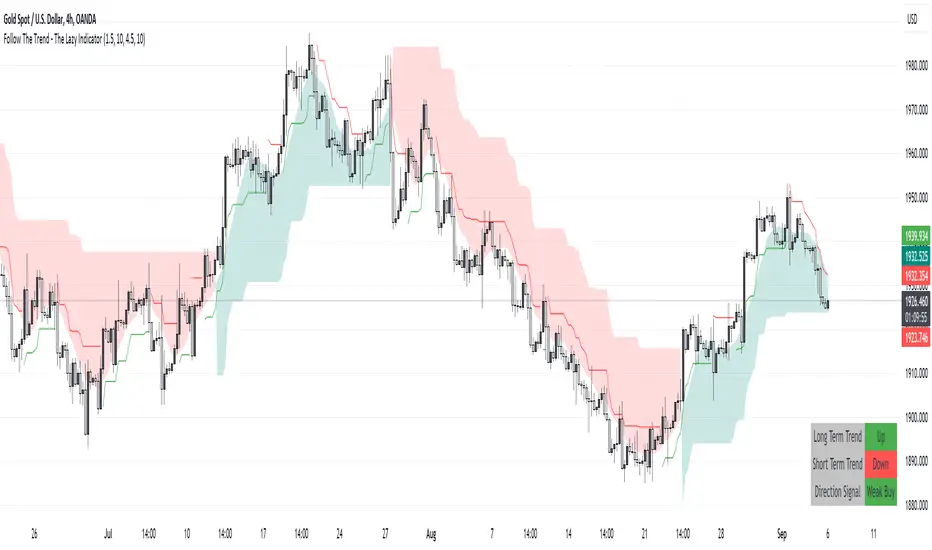
Follow The Trend - The Lazy Indicator**Understanding the 'Follow The Trend - The Lazy Indicator'**
This indicator is designed to help traders visualize the trend direction over both short-term and long-term periods. Let's dive deeper into understanding how it's designed and how it can be beneficial.
**1. How It's Designed:**
* **User Inputs:**
The first few lines ask the user for specific inputs related to the Average True Range (ATR) length and values for both short-term and long-term trends. ATR is a volatility indicator and, in this context, is used as part of the SuperTrend calculation.
* **SuperTrend Calculations:**
This indicator uses the SuperTrend, a popular trend-following indicator. Here, two SuperTrends are being calculated – one for short-term trends and another for long-term trends. The direction of the SuperTrend is also determined, signaling whether the trend is upwards or downwards.
* **Visual Representations:**
* The short-term SuperTrend is represented using green lines (for uptrend) and red lines (for downtrend).
* The indicator also provides a "cloud" between a Simple Moving Average (SMA) of the closing price (over the past 10 periods) and the long-term SuperTrend. This cloud changes color based on the direction of the long-term trend, providing another visual cue about market direction.
* **Signal Evaluation:**
This part of the code interprets the combination of short-term and long-term trends and assigns trading signals like "Strong Buy," "Weak Buy," "Strong Sell," "Weak Sell," and so on. This can act as a guide for traders, suggesting potential trading actions based on the prevailing trends.
* **Signal Coloration:**
The indicator also assigns colors to each signal. For instance, "Strong Buy" is green, "Strong Sell" is red, and there are transparency adjustments for weak signals to differentiate them from strong ones.
* **Tabular Presentation:**
At the end of the script, there’s a table displayed on the chart, summarizing the direction of both the long-term and short-term trends, as well as the overall trading signal. It provides a quick snapshot for traders to understand the current market scenario.
**2. How It May Be Helpful:**
* **Simplicity:**
The "Follow The Trend" indicator, despite its underlying complexity, is presented in a very user-friendly way. By just looking at the color cues and the table, traders can quickly understand the market's trend and potential direction.
* **Dual Trend Analysis:**
By analyzing both short-term and long-term trends, traders get a comprehensive view. This helps in understanding if the market is just having a short-term retracement (temporary reverse in direction) or if there's a genuine change in the long-term trend.
* **Adaptability:**
Traders can adjust the ATR values and lengths to customize the sensitivity of the indicator. This means it can be adapted to different assets or varying market conditions.
* **Actionable Signals:**
The signals like "Strong Buy" or "Weak Sell" are direct suggestions that can help in decision-making. Especially for beginners or those who might be overwhelmed by complex charts, such signals can be very beneficial.
* **Visual Appeal:**
The combination of trend lines, cloud coloring, and tabulated information provides a visually pleasing and easy-to-understand representation of market data. This can help reduce analysis fatigue and make chart reading more enjoyable.
In conclusion, the "Follow The Trend - The Lazy Indicator" is designed to make trend-following more accessible and actionable. By providing clear visual cues and combining short-term and long-term trend analysis, it offers traders a tool that's both comprehensive and user-friendly. Whether you're a beginner looking for clear signals or an experienced trader wanting an overview of the market trend, this indicator might be a useful addition to your toolkit.
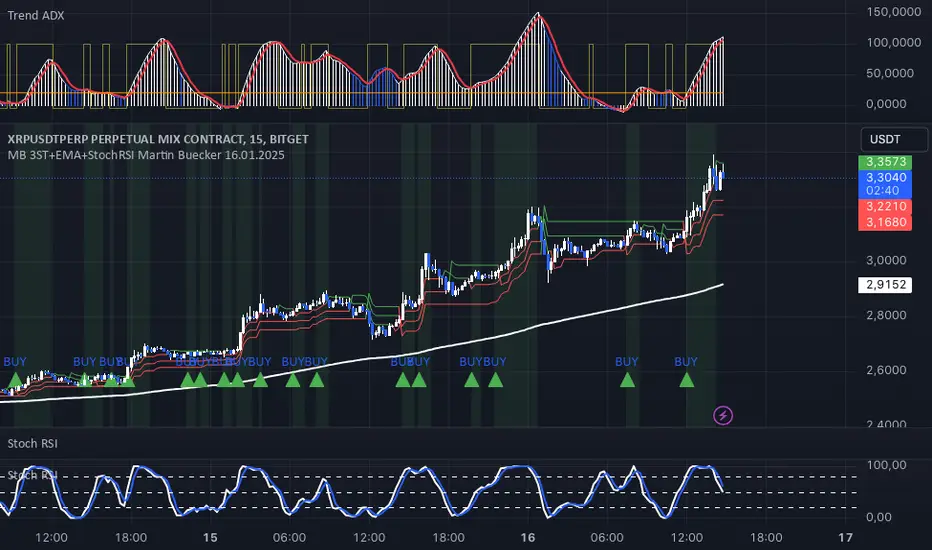
MB 3ST+EMA+StochRSI Martin Buecker 16.01.2025Short Description of the Indicator "MB 3ST+EMA+StochRSI Martin Buecker 16.01.2025"
This trend-following and momentum-based indicator combines Supertrend, EMA 200, and Stochastic RSI to generate buy and sell signals with improved accuracy.
1. Key Components
Supertrend (3 variations):
Uses three Supertrend indicators with different periods to confirm trend direction.
Buy signal when at least 2 Supertrends are bearish.
Sell signal when at least 2 Supertrends are bullish.
EMA 200 (Exponential Moving Average):
Buy signals only when the price is above EMA 200 (uptrend confirmation).
Sell signals only when the price is below EMA 200 (downtrend confirmation).
Multi-Timeframe Stochastic RSI:
Uses a higher timeframe Stoch RSI (default: 15 minutes) to filter signals.
Buy signal when %K crosses above %D (bullish momentum).
Sell signal when %K crosses below %D (bearish momentum).
2. Signal Generation
📈 Buy Signal Conditions:
✅ At least 2 of 3 Supertrends are bearish
✅ Price is above EMA 200
✅ Stoch RSI shows a bullish crossover (%K > %D)
📉 Sell Signal Conditions:
✅ At least 2 of 3 Supertrends are bullish
✅ Price is below EMA 200
✅ Stoch RSI shows a bearish crossover (%K < %D)
3. Visual Representation & Alerts
Supertrend Lines:
Green = Bullish, Red = Bearish
EMA 200: White Line
Buy/Sell Signals:
Green triangle (below bar) = Buy
Red triangle (above bar) = Sell
Alerts:
Notifies users when a buy or sell signal is triggered.
Background Coloring:
Green for Buy signals, Red for Sell signals
4. Purpose & Benefits
🔥 Combines trend (EMA 200, Supertrend) and momentum analysis (Stoch RSI) for better signal accuracy.
🔥 Works best in trending markets, filtering out false signals in sideways movements.
🔥 Suitable for scalping and day trading, providing clear and structured trade entries.