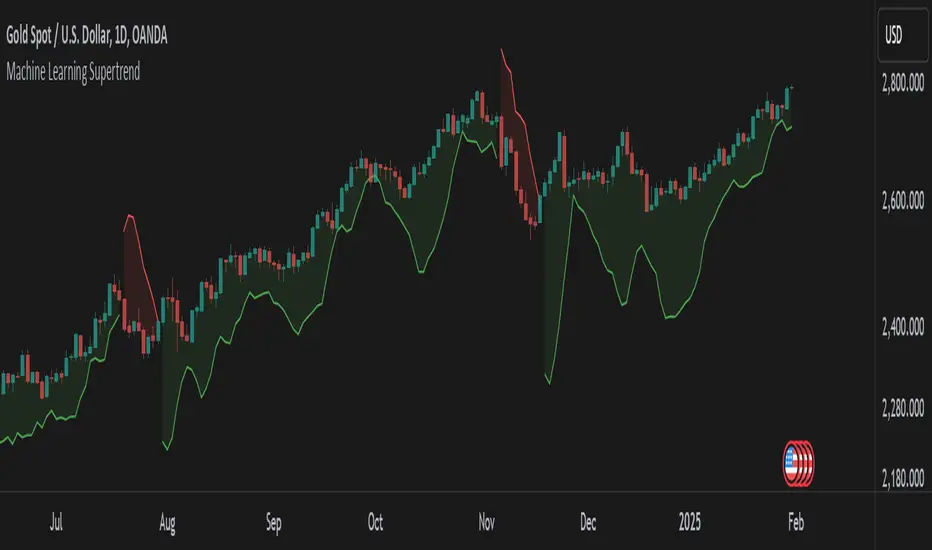
Deadband Hysteresis Supertrend [BackQuant]Deadband Hysteresis Supertrend
A two-stage trend tool that first filters price with a deadband baseline, then runs a Supertrend around that baseline with optional flip hysteresis and ATR-based adverse exits.
What this is
A hybrid of two ideas:
Deadband Hysteresis Baseline that only advances when price pulls far enough from the baseline to matter. This suppresses micro noise and gives you a stable centerline.
Supertrend bands wrapped around that baseline instead of raw price. Flips are further gated by an extra margin so side changes are more deliberate.
The goal is fewer whipsaws in chop and clearer regime identification during trends.
How it works (high level)
Deadband step — compute a per-bar “deadband” size from one of four modes: ATR, Percent of price, Ticks, or Points. If price deviates from the baseline by more than this amount, move the baseline forward by a fraction of the excess. If not, hold the line.
Centered Supertrend — build upper and lower bands around the baseline using ATR and a user factor. Track the usual trailing logic that tightens a band while price moves in its favor.
Flip hysteresis — require price to exceed the active band by an extra flip offset × ATR before switching sides. This adds stickiness at the boundary.
Adverse exit — once a side is taken, trigger an exit if price moves against the entry by K × ATR .
If you would like to check out the filter by itself:
What it plots
DBHF baseline (optional) as a smooth centerline.
DBHF Supertrend as the active trailing band.
Candle coloring by trend side for quick read.
Signal markers 𝕃 and 𝕊 at flips plus ✖ on adverse exits.
Inputs that matter
Price Source — series being filtered. Close is typical. HL2 or HLC3 can be steadier.
Deadband mode — ATR, Percent, Ticks, or Points. This defines the “it’s big enough to matter” zone.
ATR Length / Mult (DBHF) — only used when mode = ATR. Larger values widen the do-nothing zone.
Percent / Ticks / Points — alternatives to ATR; pick what fits your market’s convention.
Enter Mult — scales the deadband you must clear before the baseline moves. Increase to filter more noise.
Response — fraction of the excess applied to baseline movement. Higher responds faster; lower is smoother.
Supertrend ATR Period & Factor — traditional band size controls; higher factor widens and flips less often.
Flip Offset ATR — extra ATR buffer required to flip. Useful in choppy regimes.
Adverse Stop K·ATR — per-trade danger brake that forces an exit if price moves K×ATR against entry.
UI — toggle baseline, supertrend, signals, and bar painting; choose long and short colors.
How to read it
Green regime — candles painted long and the Supertrend running below price. Pullbacks toward the baseline that fail to breach the opposite band often resume higher.
Red regime — candles painted short and the Supertrend running above price. Rallies that cannot reclaim the band may roll over.
Frequent side swaps — reduce sensitivity by increasing Enter Mult, using ATR mode, raising the Supertrend factor, or adding Flip Offset ATR.
Use cases
Bias filter — allow entries only in the direction of the current side. Use your preferred triggers inside that bias.
Trailing logic — treat the active band as a dynamic stop. If the side flips or an adverse K·ATR exit prints, reduce or close exposure.
Regime map — on higher timeframes, the combination baseline + band produces a clean up vs down template for allocation decisions.
Tuning guidance
Fast markets — ATR deadband, modest Enter Mult (0.8–1.2), response 0.2–0.35, Supertrend factor 1.7–2.2, small Flip Offset (0.2–0.5 ATR).
Choppy ranges — widen deadband or raise Enter Mult, lower response, and add more Flip Offset so flips require stronger evidence.
Slow trends — longer ATR periods and higher Supertrend factor to keep you on side longer; use a conservative adverse K.
Included alerts
DBHF ST Long — side flips to long.
DBHF ST Short — side flips to short.
Adverse Exit Long / Short — K·ATR stop triggers against the current side.
Strengths
Deadbanded baseline reduces micro whipsaws before Supertrend logic even begins.
Flip hysteresis adds a second layer of confirmation at the boundary.
Optional adverse ATR stop provides a uniform risk cut across assets and regimes.
Clear visuals and minimal parameters to adjust for symbol behavior.
Putting it together
Think of this tool as two decisions layered into one view. The deadband baseline answers “does this move even count,” then the Supertrend wrapped around that baseline answers “if it counts, which side should I be on and where do I flip.” When both parts agree you tend to stay on the correct side of a trend for longer, and when they disagree you get an early warning that conditions are changing.
When the baseline bends and price cannot reclaim the opposite band , momentum is usually continuing. Pullbacks into the baseline that stall before the far band often resolve in trend.
When the baseline flattens and the bands compress , expect indecision. Use the Flip Offset ATR to avoid reacting to the first feint. Wait for a clean band breach with follow through.
When an adverse K·ATR exit prints while the side has not flipped , treat it as a risk event rather than a full regime change. Many users cut size, re-enter only if the side reasserts, and let the next flip confirm a new trend.
Final thoughts
Deadband Hysteresis Supertrend is best read as a regime lens. The baseline defines your tolerance for noise, the bands define your trailing structure, and the flip offset plus adverse ATR stop define how forgiving or strict you want to be at the boundary. On strong trends it helps you hold through shallow shakeouts. In choppy conditions it encourages patience until price does something meaningful. Start with settings that reflect the cadence of your market, observe how often flips occur, then nudge the deadband and flip offset until the tool spends most of its time describing the move you care about rather than the noise in between.
Recherche dans les scripts pour "supertrend"

SMA MAD SuperTrend | OquantThe SMA MAD SuperTrend | Oquant is an trend-following indicator designed to help traders identify potential trend directions and reversals using a unique combination of a Simple Moving Average (SMA), Mean Absolute Deviation (MAD), and a SuperTrend mechanism. This script aims to provide clear visual signals for trend entries and exits, making it suitable for traders looking to capture trends.
This indicator innovatively combines the smoothing properties of an SMA with the volatility-adaptive qualities of MAD to create dynamic SuperTrend bands. Unlike traditional SuperTrend indicators that rely on Average True Range (ATR) for volatility, this script uses Mean Absolute Deviation(MAD) to measure the average absolute deviation from the mean price, providing a different perspective on price volatility. The result is a SuperTrend system that adapts to market conditions with a focus on price deviation, offering a unique tool for trend detection.
Components and Calculations
Simple Moving Average (SMA):
The SMA is a widely used indicator that calculates the average of a specified number of closing prices. It smooths price data to identify the overall trend direction. In this script, the SMA serves as the baseline for calculating dynamic upper and lower bands.
Mean Absolute Deviation (MAD):
MAD measures the average absolute deviation of the price from its mean. It quantifies volatility by calculating how far prices deviate from the mean price, offering an alternative to ATR.
SuperTrend Mechanism:
This SuperTrend indicator generates dynamic upper and lower bands around the Simple Moving Average (SMA) using mean absolute deviation as measure of volatility.
It tracks trend direction by comparing the close price to the bands:
If the price crosses above the upper band, the trend turns bullish, and the SuperTrend follows the lower band.
If the price crosses below the lower band, the trend turns bearish, and the SuperTrend follows the upper band.
The bands adjust based on their previous values, updating only when the price crosses a band or the band shifts in the correct direction, reducing false signals and ensuring stable trend detection.
How to Use the Indicator
Trend Signals:
Green Line: Indicates a bullish trend (price above the SuperTrend line).
Purple Line: Indicates a bearish trend (price below the SuperTrend line).
Bar and Candle Coloring: Bars and candles are colored green for bullish trends and purple for bearish trends, making it easy to visualize trend direction.
Filled Areas: The area between the price and the SuperTrend line is filled with transparent colors (green for bullish, purple for bearish) to highlight trend.
Inputs:
Source: Choose the price data for calculations.
SMA Length: Adjust the period for the SMA. Longer periods smooth the trend further.
MAD Length: Set the period for MAD calculation. Shorter periods make the MAD more sensitive.
Factor: Control the distance of the SuperTrend bands from the SMA. Higher values widen the bands, reducing sensitivity to price fluctuations.
Alerts:
The script includes alert conditions for trend changes:
SMA MAD SuperTrend Long: Triggered when the trend turns bullish.
SMA MAD SuperTrend Short: Triggered when the trend turns bearish.
Set up alerts in TradingView to receive notifications for these conditions.
Why Use This Script?
The SMA MAD SuperTrend | Oquant offers a fresh take on trend-following by integrating SMA as baseline and MAD for volatility measurement, providing an alternative to ATR-based SuperTrend indicators. Its clear visual signals, customizable inputs, and alert conditions make it versatile for traders of all levels.
⚠️ Disclaimer: This indicator is intended for educational and informational purposes only. Trading/investing involves risk, and past performance does not guarantee future results. Always test and evaluate indicators/strategies before applying them in live markets. Use at your own risk.

Supertrend with ADX & MTF MA Filter# **Supertrend with ADX & MTF MA Filter - Comprehensive Explanation**
---
## **1. Purpose of This Indicator**
This indicator combines three powerful technical analysis tools to create a robust trading system:
✅ **Supertrend** (Trend-following)
✅ **ADX Filter** (Trend strength confirmation)
✅ **MTF MA Filter** (Multi-timeframe trend direction confirmation)
**Primary Goals:**
✔ **Identify high-probability trend reversals** with confirmation from multiple indicators
✔ **Filter out weak trends** using ADX (Average Directional Index)
✔ **Add higher timeframe context** with MTF (Multi-TimeFrame) Moving Average
✔ **Reduce false signals** by requiring confluence between all three components
---
## **2. Core Logic & Components**
### **A. Supertrend (Base Indicator)**
- **Calculation:**
```pine
up = hl2 - (Multiplier * ATR(Periods))
dn = hl2 + (Multiplier * ATR(Periods))
```
- **Bullish trend** when price > `up` (green line)
- **Bearish trend** when price < `dn` (red line)
- **Why Supertrend?**
- Simple yet effective trend-following system
- Adapts to volatility via ATR (Average True Range)
---
### **B. ADX Filter (Trend Strength Confirmation)**
- **ADX Calculation:**
```pine
= calcADX(adxLength, adxSmoothing)
strongTrend = adxVal >= adxThreshold
```
- **ADX > Threshold (Default: 20)** = Strong trend
- **DI+ > DI-** = Bullish momentum
- **DI- > DI+** = Bearish momentum
- **Why ADX?**
- Avoids trading in choppy markets (low ADX = weak trend)
- Confirms if Supertrend signals occur in a strong trend
---
### **C. MTF MA Filter (Higher Timeframe Trend Alignment)**
- **Moving Average Calculation:**
```pine
= getMA(maSource, maLength, maType, maTF)
```
- **MA Type:** SMA, EMA, WMA, or DEMA
- **Timeframe:** Any (1m, 5m, 1H, 4H, D, W, M)
- **Trend Direction:**
- **Buy Signal:** MA must be **rising**
- **Sell Signal:** MA must be **falling**
- **Why MTF MA?**
- Aligns trades with the **higher timeframe trend**
- Reduces counter-trend entries
---
## **3. How to Use This Indicator**
### **A. Buy Conditions (All Must Be True)**
1. **Supertrend turns bullish** (price crosses above `up` line)
2. **ADX ≥ Threshold** (trend is strong)
3. **Higher timeframe MA is rising** (confirms bullish bias)
### **B. Sell Conditions (All Must Be True)**
1. **Supertrend turns bearish** (price crosses below `dn` line)
2. **ADX ≥ Threshold** (trend is strong)
3. **Higher timeframe MA is falling** (confirms bearish bias)
### **C. Recommended Settings**
| Parameter | Recommended Value | Description |
|-----------|------------------|-------------|
| **ATR Period** | 14 | Sensitivity of Supertrend |
| **Multiplier** | 1.5-3.0 | Adjust for volatility |
| **ADX Threshold** | 20-25 | Higher = stricter trend filter |
| **MA Length** | 20-50 | Smoothness of trend filter |
| **MA Timeframe** | 1H/D | Align with trading style |
---
## **4. Trading Strategies**
### **A. Trend-Following Strategy**
- **Enter:** When all 3 conditions align (Supertrend + ADX + MA)
- **Exit:** When Supertrend flips or ADX drops below threshold
### **B. Pullback Strategy**
- **Wait for:**
- Supertrend in trend direction
- ADX remains strong
- MA still aligned
- **Enter:** On pullback to Supertrend line
### **C. Multi-Timeframe Confirmation**
- **Intraday traders:** Use 4H/D MA for trend bias
- **Swing traders:** Use D/W MA for trend bias
---
## **5. Advantages Over Standard Supertrend**
✔ **Fewer false signals** (ADX filters weak trends)
✔ **Higher timeframe alignment** (avoids trading against larger trends)
✔ **Customizable MA types** (SMA, EMA, WMA, DEMA)
✔ **Works on all markets** (stocks, forex, crypto)
---
### **Final Thoughts**
This indicator is designed for traders who want **high-confidence trend signals** by combining:
🔹 **Supertrend** (entry trigger)
🔹 **ADX** (trend strength filter)
🔹 **MTF MA** (higher timeframe trend alignment)
By requiring all three components to align, it significantly improves signal quality compared to standalone Supertrend systems.
**→ Best for:** Swing trading, trend-following, and avoiding choppy markets.
CoffeeShopCrypto Supertrend Liquidity EngineMost SuperTrend indicators use fixed ATR multipliers that ignore context—forcing traders to constantly tweak settings that rarely adapt well across timeframes or assets.
This Supertrend is a nodd to and a more completion of the work
done by Olivier Seban ( @olivierseban )
This version replaces guesswork with an adaptive factor based on prior session volatility, dynamically adjusting stops to match current conditions. It also introduces liquidity-aware zones, real-time strength histograms, and a visual control panel—making your stoploss smarter, more responsive, and aligned with how the market actually moves.
📏 The Multiplier Problem & Adaptive Factor Solution
Traditional SuperTrend indicators rely on fixed ATR multipliers—often arbitrary numbers like 1.5, 2, or 3. The issue? No logical basis ties these values to actual market conditions. What works on a 5-minute Nasdaq chart fails on a daily EUR/USD chart. Traders spend hours tweaking multipliers per asset, timeframe, or volatility phase—and still end up with stoplosses that are either too tight or too loose. Worse, the market doesn’t care about your setting—it behaves according to underlying volatility, not your parameter.
This version fixes that by automating the multiplier selection entirely. It uses a 4-zone model based on the current ATR relative to the previous session’s ATR, dynamically adjusting the SuperTrend factor to match current volatility. It eliminates guesswork, adapts to the asset and timeframe, and ensures you’re always using a context-aware stoploss—one that evolves with the market instead of fighting it.
ATR EXAMPLE
Let’s say prior session ATR = 2.00
Now suppose current ATR = 0.32
This places us in Zone 1 (Very Low Volatility)
It doesn’t imply "overbought" or "oversold" — it tells you the market is moving very little, which often means:
Lower risk | Smaller stops | Smaller opportunities (and losses)
🔁 Liquidity Zones vs. Arbitrary Pullbacks
The standard SuperTrend stop loss line often looks like price “barely misses it” before continuing its trend. Traders call this "stop hunting," but what’s really happening is liquidity collection—price pulls back into a zone rich in orders before continuing. The problem? The old SuperTrend doesn’t show this zone. It only draws the outer limit, leaving no visual cue for where entries or continuation moves might realistically originate.
This script introduces 2 levels in the Liquidity Zone. One for Support and one for Stophunts, which draw dynamically between the current price and the SuperTrend line. These levels reflect where the market is most likely to revisit before resuming the trend. By visualizing the area just above the Supertrend stop loss, you can anticipate pullbacks, spot ideal re-entries, and avoid premature exits. This bridges the gap between mechanical stoploss logic and real-world liquidity behavior.
⏳ Prior Session ATR vs. Live ATR
Using real-time ATR to determine movement potential is like driving by looking in your rearview mirror. It’s reactive, not predictive. Traders often base decisions on live ATR, unaware that today’s range is still unfolding —creating volatility mismatches between what’s calculated and what actually matters. Since ATR reflects range, calculating it mid-session gives an incomplete and misleading picture of true volatility.
Instead, this system uses the ATR from the previous session , anchoring your volatility assumptions in a fully-formed price structure . It tells you how far price moved in the last full market phase—be it London, New York, or Tokyo—giving you a more reliable gauge of expected range today. This is a smarter way to estimate how far price could move rather than how far it has moved.
The Smoothing function will take the ATR, Support, Resistance, Stophunt Levels, and the Moving Avearage and smooth them by the calculation you choose.
It will also plot a moving average on your chart against closing prices by the smoothing function you choose.
🧭 Scalping vs. Trending Modes
The market moves in at least 4 phases. Trending, Ranging, Consolidation, Distribution.
Every trader has a different style —some scalp low-volatility moves during off-hours, while others ride macro trends across days. The problem with classic SuperTrend? It treats every market condition the same. A fixed system can’t possibly provide proper stoploss spacing for both a fast scalp and a long-term swing. Traders are forced to rebuild their system every time the market changes character or the session shifts.
This version solves that with a simple toggle:
Scalping or Trend Mode . With one switch, it inverts the logic of the adaptive factor to either tighten or loosen your trailing stops. During low-liquidity hours or consolidation phases, Scalping Mode offers snug stoplosses. During expansion or clear directional bias.
Trend Mode lets the trade breathe. This is flexibility built directly into the logic—not something you have to recalibrate manually.
📉 Histogram Oscillator for Move Strength
In legacy indicators, there’s no built-in way to gauge when the move is losing power . Traders rely on price action or momentum indicators to guess if a trend is fading. But this adds clutter, lag, and often contradiction. The classic SuperTrend doesn’t offer insight into how strong or weak the current trend leg is—only whether price has crossed a line.
This version includes a Trending Liquidity Histogram —a histogram that shows whether the liquidity in the SuperTrend zone is expanding or compressing. When the bars weaken or cross toward zero, it signals liquidity exhaustion . This early warning gives you time to prep for reversals or anticipate pullbacks. It even adapts visually depending on your trading mode, showing color-coded signals for scalping vs. trending behavior. It's both a strength gauge and a trade timing tool—built into your stoploss logic.
Histogram in Scalping Mode
Histogram in Trending Mode
📊 Visual Table for Real-Time Clarity
A major issue with custom indicators is opacity —you don’t always know what settings or values are currently being used. Even worse, if your dynamic logic changes mid-trade, you may not notice unless you go digging into the code or logs. This can create confusion, especially for discretionary traders.
This SuperTrend solves it with a clean visual summary table right on your chart. It shows your current ATR value, adaptive multiplier, trailing stop level, and whether a new zone size is active. That means no surprises and no second-guessing—everything important is visible and updated in real-time.

Supertrend with Volume Filter AlertSupertrend with Volume Filter Alert - Indicator Overview
What is the Supertrend Indicator?
The Supertrend indicator is a popular trend-following tool used by traders to identify the direction of the market and potential entry/exit points. It is based on the Average True Range (ATR), which measures volatility, and plots a line on the chart that acts as a dynamic support or resistance level. When the price is above the Supertrend line, it signals an uptrend (bullish), and when the price is below, it indicates a downtrend (bearish). The indicator is particularly effective in trending markets but can generate false signals during choppy or sideways conditions.
How This Script Works
The "Supertrend with Volume Filter Alert" enhances the classic Supertrend indicator by adding a customizable volume filter to improve signal reliability.
Here's how it functions:
Supertrend Calculation:The Supertrend is calculated using the ATR over a user-defined period (default: 55) and a multiplier (default: 1.85). These parameters control the sensitivity of the indicator:A higher ATR period smooths out volatility, making the indicator less reactive to short-term price fluctuations.The multiplier determines the distance of the Supertrend line from the price, affecting how quickly it responds to trend changes.The script plots the Supertrend line in cyan for uptrends and red for downtrends, making it easy to visualize the market direction.
Volume Filter:A key feature of this script is the volume filter, which helps filter out false signals in choppy markets. The filter compares the current volume to the average volume over a lookback period (default: 20) and only triggers signals if the volume exceeds the average by a specified multiplier (default: 2.0).This ensures that trend changes are accompanied by significant market participation, increasing the likelihood of a genuine trend shift.
Signals and Alerts:
Buy signals (cyan triangle below the bar) are generated when the price crosses above the Supertrend line (indicating an uptrend) and the volume condition is met.Sell signals (red triangle above the bar) are generated when the price crosses below the Supertrend line (indicating a downtrend) and the volume condition is met.Alerts are set up for both buy and sell signals, notifying traders only when the volume filter confirms the trend change.
Customizable Settings for Multiple Markets
The default settings in this script (ATR Period: 55, ATR Multiplier: 1.85, Volume Lookback Period: 20, Volume Multiplier: 2.0) were carefully chosen to provide a balance of sensitivity and reliability across various markets, including stocks, indices (like the S&P 500), forex, and cryptocurrencies.
Here's why these settings work well:
ATR Period (55): A longer ATR period smooths out volatility, making the indicator less prone to whipsaws in volatile markets like crypto or forex, while still being responsive enough for trending markets like indices.
ATR Multiplier (1.85): This multiplier strikes a balance between capturing early trend changes and avoiding noise. A smaller multiplier would make the indicator too sensitive, while a larger one might miss early opportunities.
Volume Lookback Period (20): A 20-bar lookback for volume averaging provides a robust baseline for identifying significant volume spikes, adaptable to both short-term (e.g., daily charts) and longer-term (e.g., weekly charts) timeframes.
Volume Multiplier (2.0): Requiring volume to be at least 2x the average ensures that only high-conviction moves trigger signals, which is crucial for markets with varying liquidity levels.
These parameters are fully customizable, allowing traders to adjust the indicator to their specific market, timeframe, or trading style. For example, you might reduce the ATR period for faster-moving markets or increase the volume multiplier for more conservative signal filtering.
How the Volume Filter Reduces Bad Trades in Choppy Markets
One of the main drawbacks of the Supertrend indicator is its tendency to generate false signals during choppy or ranging markets, where price fluctuates without a clear trend. The volume filter in this script addresses this issue by ensuring that trend changes are backed by significant market activity:
In choppy markets, price movements often lack strong volume, leading to false breakouts or reversals. By requiring volume to be a multiple (default: 2x) of the average volume over the lookback period, the script filters out these low-volume, low-conviction moves.This reduces the likelihood of taking bad trades during sideways markets, as only trend changes with strong volume confirmation will trigger signals. For example, on a daily chart of the S&P 500, a buy signal will only fire if the price crosses above the Supertrend line and the volume on that day is at least twice the 20-day average, indicating genuine buying pressure.
Usage Tips
Markets and Timeframes: This indicator is versatile and can be used on various assets (stocks, indices, forex, crypto) and timeframes (1-minute, 1-hour, daily, etc.). Adjust the settings based on the market's volatility and your trading strategy.
Combine with Other Indicators: While the volume filter improves reliability, consider using additional indicators like RSI or MACD to confirm trends, especially in ranging markets.
Backtesting: Test the indicator on historical data for your chosen market to optimize the settings and ensure they align with your trading goals.
Alerts: Set up alerts for buy and sell signals to stay informed of high-probability trend changes without constantly monitoring the chart.
ConclusionThe "Supertrend with Volume Filter Alert" is a powerful tool for trend-following traders, combining the simplicity of the Supertrend indicator with a volume-based filter to enhance signal accuracy. Its customizable settings make it adaptable to multiple markets, while the volume filter helps reduce false signals in choppy conditions, allowing traders to focus on high-probability trades. Whether you're trading stocks, indices, forex, or crypto, this indicator can help you identify trends with greater confidence.

Dynamic Score Supertrend [QuantAlgo]Dynamic Score Supertrend 📈🚀
The Dynamic Score Supertrend by QuantAlgo introduces a sophisticated trend-following tool that combines the well-known Supertrend indicator with an innovative dynamic trend scoring technique . By tracking market momentum through a scoring system that evaluates price behavior over a customizable window, this indicator adapts to changing market conditions. The result is a clearer, more adaptive tool that helps traders and investors detect and capitalize on trend shifts with greater precision.
💫 Conceptual Foundation and Innovation
At the core of the Dynamic Score Supertrend is the dynamic trend score system , which measures price movements relative to the Supertrend’s upper and lower bands. This scoring technique adds a layer of trend validation, assessing the strength of price trends over time. Unlike traditional Supertrend indicators that rely solely on ATR calculations, this system incorporates a scoring mechanism that provides more insight into trend direction, allowing traders and investors to navigate both trending and choppy markets with greater confidence.
✨ Technical Composition and Calculation
The Dynamic Score Supertrend utilizes the Average True Range (ATR) to calculate the upper and lower Supertrend bands. The dynamic trend scoring technique then compares the price to these bands over a customizable window, generating a trend score that reflects the current market direction.
When the score exceeds the uptrend or downtrend thresholds, it signals a possible shift in market direction. By adjusting the ATR settings and window length, the indicator becomes more adaptable to different market conditions, from steady trends to periods of higher volatility. This customization allows users to refine the Supertrend’s sensitivity and responsiveness based on their trading or investing style.
📈 Features and Practical Applications
Customizable ATR Settings: Adjust the ATR length and multiplier to control the sensitivity of the Supertrend bands. This allows the indicator to smooth out noise or react more quickly to price shifts, depending on market conditions.
Window Length for Dynamic Scoring: Modify the window length to adjust how many data points the scoring system considers, allowing you to tailor the indicator’s responsiveness to short-term or long-term trends.
Uptrend/Downtrend Thresholds: Set thresholds for identifying trend signals. Increase these thresholds for more reliable signals in choppy markets, or lower them for more aggressive entry points in trending markets.
Bar and Background Coloring: Visual cues such as bar coloring and background fills highlight the direction of the current trend, making it easier to spot potential reversals and trend shifts.
Trend Confirmation: The dynamic trend score system provides a clearer confirmation of trend strength, helping you identify strong, sustained movements while filtering out false signals.
⚡️ How to Use
✅ Add the Indicator: Add the Dynamic Score Supertrend to your favourites, then apply it to your chart. Adjust the ATR length, multiplier, and dynamic score settings to suit your trading or investing strategy.
👀 Monitor Trend Shifts: Track price movements relative to the Supertrend bands and use the dynamic trend score to confirm the strength of a trend. Bar and background colors make it easy to visualize key trend shifts.
🔔 Set Alerts: Configure alerts when the dynamic trend score crosses key thresholds, so you can act on significant trend changes without constantly monitoring the charts.
🌟 Summary and Usage Tips
The Dynamic Score Supertrend by QuantAlgo is a robust trend-following tool that combines the power of the Supertrend with an advanced dynamic scoring system. This approach provides more adaptable and reliable trend signals, helping traders and investors make informed decisions in trending markets. The customizable ATR settings and scoring thresholds make it versatile across various market conditions, allowing you to fine-tune the indicator for both short-term momentum and long-term trend following. To maximize its effectiveness, adjust the settings based on current market volatility and use the visual cues to confirm trend shifts. The Dynamic Score Supertrend offers a refined, probabilistic approach to trading and investing, making it a valuable addition to your toolkit.

Supertrend 3 + DashboardSupertrend 3 + Dashboard (English and Japanese Explanation Below)
日本語解説は下記
Supertrend 3 + Dashboard is an advanced indicator for traders who wish to monitor multiple time frames simultaneously, combining three Supertrend indicators to provide a customizable dashboard that displays trend direction across multiple time frames. This allows traders to easily identify trends and potential reversals across different time frames, making it a powerful tool in trend-following strategies.
Explanation:
・Supertrend Calculation: The Supertrend indicator is calculated using the Average True Range (ATR) to determine the trend direction. In this indicator, three Supertrend calculations are used, each with customizable ATR lengths and multipliers, allowing traders to adjust the settings to fit their trading strategy.
・Multiple Timeframes: You can set different timeframes for each Supertrend, with default values of the current chart's timeframe for the first Supertrend, 5 minutes for the second, and 15 minutes for the third. These timeframes can be adjusted to fit the trader's preferences, enabling multi-timeframe trend analysis.
・Color Logic: Each Supertrend changes color based on the trend direction. Green indicates an uptrend, while red indicates a downtrend. The lines and filled areas are color-coded to visually differentiate between bullish and bearish trends across different timeframes.
・Dashboard Feature: The customizable dashboard displays trend signals for multiple timeframes (e.g., 1 minute, 5 minutes, 15 minutes, 1 hour, daily, weekly) in a tabular format. Each cell shows the trend direction with an arrow (▲ for uptrend, ▼ for downtrend), and the background color is adjusted accordingly. The dashboard can be positioned at different corners of the chart (top-left, top-right, bottom-left, bottom-right) based on user preference.
Notes:
Please note that this indicator may be subject to changes or removal without notice. The developer cannot be held responsible for any losses incurred from trading with this indicator, so please operate at your own risk.
Supertrend 3 + Dashboardは、複数の時間軸を同時に監視したいトレーダー向けの高度なインジケーターです。3つのSupertrendインジケーターを組み合わせ、複数の時間軸にわたるトレンド方向を表示するカスタマイズ可能なダッシュボードを提供します。これにより、トレーダーは異なる時間軸でのトレンドや反転の可能性を簡単に把握でき、トレンドフォロー戦略において強力なツールとなります。
・Supertrend計算方法: Supertrendインジケーターは、平均真の範囲(ATR)を使用してトレンド方向を決定します。このインジケーターでは、3つのSupertrend計算が使用され、それぞれにカスタマイズ可能なATRの期間と倍率が設定されており、トレーダーは戦略に合わせて設定を調整できます。
・複数時間軸: 各Supertrendに対して異なる時間軸を設定できます。デフォルトでは、第一のSupertrendは現在のチャートの時間軸、第二は5分、第三は15分に設定されています。これらの時間軸はトレーダーの好みに応じて調整可能で、複数時間軸でのトレンド分析が可能です。
・色のロジック: 各Supertrendは、トレンドの方向に応じて色が変わります。緑は上昇トレンド、赤は下降トレンドを示します。異なる時間軸での強気と弱気のトレンドを視覚的に区別するために、線や塗りつぶしの色が適用されています。
・ダッシュボード機能: カスタマイズ可能なダッシュボードは、1分、5分、15分、1時間、日足、週足など、複数の時間軸にわたるトレンド信号を表形式で表示します。各セルにはトレンド方向が矢印(▲は上昇、▼は下降)で表示され、背景色もそれに応じて調整されます。ダッシュボードの位置は、ユーザーの好みに応じて、チャートの四隅(左上、右上、左下、右下)に配置できます。
注意事項: このインジケーターは予告なく変更または削除される場合があります。このインジケーターを使用しての取引による損失について、開発者は責任を負いかねますので、自己責任でご利用ください。

Custom Supertrend Multi-Timeframe Indicator [Pineify]Supertrend Multi-Timeframe Indicator
Introduction
The Supertrend Multi-Timeframe Indicator is an advanced trading tool designed to help traders identify trend directions and potential buy/sell signals by combining Supertrend indicators from multiple timeframes. This script is original in its approach to integrating Supertrend calculations across different timeframes, providing a more comprehensive view of market trends.
Concepts and Calculations
The indicator utilizes the Supertrend algorithm, which is based on the Average True Range (ATR). The Supertrend is a popular tool for trend-following strategies, and this script enhances its capabilities by incorporating data from a larger timeframe.
Supertrend Factor: Determines the sensitivity of the Supertrend line.
ATR Length: Defines the period for calculating the Average True Range.
Larger Supertrend Factor and ATR Length: Applied to the larger timeframe for a broader trend perspective.
Larger Timeframe: The higher timeframe from which the secondary Supertrend data is sourced.
How It Works
The script calculates the Supertrend for the current timeframe using the specified factor and ATR length.
Simultaneously, it requests Supertrend data from a larger timeframe.
Buy and sell signals are generated based on crossovers and crossunders of the Supertrend lines from both timeframes.
Visual cues (up and down arrows) are plotted on the chart to indicate buy and sell signals.
Background colors change to reflect the trend direction: green for an uptrend and red for a downtrend.
Usage
Add the indicator to your TradingView chart.
Customize the Supertrend factors, ATR lengths, and larger timeframe according to your trading strategy.
Enable or disable buy and sell alerts as needed.
Monitor the chart for visual signals and background color changes to make informed trading decisions.
Note: The indicator is best used in conjunction with other technical analysis tools and should not be relied upon as the sole basis for trading decisions.
Conclusion
The Supertrend Multi-Timeframe Indicator offers a unique and powerful way to analyze market trends by leveraging the strengths of the Supertrend algorithm across multiple timeframes. Its customizable settings and clear visual signals make it a valuable addition to any trader's toolkit.

Adaptive Fourier Transform Supertrend [QuantAlgo]Discover a brand new way to analyze trend with Adaptive Fourier Transform Supertrend by QuantAlgo , an innovative technical indicator that combines the power of Fourier analysis with dynamic Supertrend methodology. In essence, it utilizes the frequency domain mathematics and the adaptive volatility control technique to transform complex wave patterns into clear and high probability signals—ideal for both sophisticated traders seeking mathematical precision and investors who appreciate robust trend confirmation!
🟢 Core Architecture
At its core, this indicator employs an adaptive Fourier Transform framework with dynamic volatility-controlled Supertrend bands. It utilizes multiple harmonic components that let you fine-tune how market frequencies influence trend detection. By combining wave analysis with adaptive volatility bands, the indicator creates a sophisticated yet clear framework for trend identification that dynamically adjusts to changing market conditions.
🟢 Technical Foundation
The indicator builds on three innovative components:
Fourier Wave Analysis: Decomposes price action into primary and harmonic components for precise trend detection
Adaptive Volatility Control: Dynamically adjusts Supertrend bands using combined ATR and standard deviation
Harmonic Integration: Merges multiple frequency components with decreasing weights for comprehensive trend analysis
🟢 Key Features & Signals
The Adaptive Fourier Transform Supertrend transforms complex wave calculations into clear visual signals with:
Dynamic trend bands that adapt to market volatility
Sophisticated cloud-fill visualization system
Strategic L/S markers at key trend reversals
Customizable bar coloring based on trend direction
Comprehensive alert system for trend shifts
🟢 Practical Usage Tips
Here's how you can get the most out of the Adaptive Fourier Transform Supertrend :
1/ Setup:
Add the indicator to your favorites, then apply it to your chart ⭐️
Start with close price as your base source
Use standard Fourier period (14) for balanced wave detection
Begin with default harmonic weight (0.5) for balanced sensitivity
Start with standard Supertrend multiplier (2.0) for reliable band width
2/ Signal Interpretation:
Monitor trend band crossovers for potential signals
Watch for convergence of price with Fourier trend
Use L/S markers for trade entry points
Monitor bar colors for trend confirmation
Configure alerts for significant trend reversals
🟢 Pro Tips
Fine-tune Fourier parameters for optimal sensitivity:
→ Lower Base Period (8-12) for more reactive analysis
→ Higher Base Period (15-30) to filter out noise
→ Adjust Harmonic Weight (0.3-0.7) to control shorter trend influence
Customize Supertrend settings:
→ Lower multiplier (1.5-2.0) for tighter bands
→ Higher multiplier (2.0-3.0) for wider bands
→ Adjust ATR length based on market volatility
Strategy Enhancement:
→ Compare signals across multiple timeframes
→ Combine with volume analysis
→ Use with support/resistance levels
→ Integrate with other momentum indicators

[EmreKb] Dynamic Factor SupertrendThe Dynamic Factor Supertrend is an innovative variation of the classic Supertrend indicator, designed to provide traders with more accurate trend signals while reducing the impact of false breakouts. Unlike the traditional Supertrend, which relies on a fixed multiplier (Factor) applied to the Average True Range (ATR), this enhanced version introduces a dynamic adjustment mechanism based on price movements relative to the Supertrend line.
This indicator works by assessing the distance between the price and the Supertrend line. When the price moves significantly beyond the typical ATR × Factor distance, the remaining gap is recalculated using a Dynamic Factor. This additional scaling adjusts the base factor, effectively modifying the Supertrend line to better reflect current market conditions. This process ensures that the trend line adapts dynamically to changes in price behavior, reducing noise and improving signal reliability in volatile markets.
One of the key advantages of the Dynamic Factor Supertrend is its ability to minimize false trend reversals. By incorporating the Dynamic Factor adjustment, the indicator becomes more resilient to minor price fluctuations that could otherwise trigger incorrect signals. This makes it particularly effective in markets where volatility is high, or during periods of choppy price action, where traditional Supertrend indicators often struggle to maintain accuracy.
Traders can use the Dynamic Factor Supertrend to identify clear trend directions, with uptrends signaled when the price is above the trend line and downtrends when it is below. The Dynamic Factor parameter can be fine-tuned to match individual trading styles, offering greater flexibility. A lower value makes the trend line more responsive to price changes, while a higher value provides more stability by reducing the frequency of adjustments.
In summary, the Dynamic Factor Supertrend is an advanced trend-following tool that combines the foundational concepts of the Supertrend with a novel dynamic adjustment mechanism. It offers traders a more reliable way to navigate complex market conditions, making it a valuable addition to any trading strategy. This indicator is particularly well-suited for those seeking to reduce false signals and enhance the accuracy of their trend analysis in all market environments.

Supertrend EMA & KNNSupertrend EMA & KNN
The Supertrend EMA indicator cuts through the noise to deliver clear trend signals.
This tool is built using the good old Exponential Moving Averages (EMAs) with a novel of machine learning; KNN (K Nearest Neighbors) breakout detection method.
Key Features:
Effortless Trend Identification: Supertrend EMA simplifies trend analysis by automatically displaying a color-coded EMA. Green indicates an uptrend, red signifies a downtrend, and the absence of color suggests a potential range.
Dynamic Breakout Detection: Unlike traditional EMAs, Supertrend EMA incorporates a KNN-based approach to identify breakouts. This allows for faster color changes compared to standard EMAs, offering a more dynamic picture of the trend.
Customizable Parameters: Fine-tune the indicator to your trading style. Adjust the EMA length for trend smoothing, KNN lookback window for breakout sensitivity, and breakout threshold for filtering noise.
A Glimpse Under the Hood:
Dual EMA Power: The indicator utilizes two EMAs. A longer EMA (controlled by the "EMA Length" parameter) provides a smooth trend direction, while a shorter EMA (controlled by the "Short EMA Length" parameter) triggers color changes, aiming for faster response to breakouts.
KNN Breakout Detection: This innovative feature analyzes price action over a user-defined lookback period (controlled by the "KNN Lookback Length" parameter) to identify potential breakouts. If the price surpasses a user-defined threshold (controlled by the "Breakout Threshold" parameter) above the recent highs, a green color is triggered, signaling a potential uptrend. Conversely, a breakdown below the recent lows triggers a red color, indicating a potential downtrend.
Trading with Supertrend EMA:
Ride the Trend: When the indicator displays green, look for long (buy) opportunities, especially when confirmed by bullish price action patterns on lower timeframes. Conversely, red suggests potential shorting (sell) opportunities, again confirmed by bearish price action on lower timeframes.
Embrace Clarity: The color-coded EMA provides a clear visual representation of the trend, allowing you to focus on price action and refine your entry and exit strategies.
A Word of Caution:
While Supertrend EMA offers faster color changes than traditional EMAs, it's important to acknowledge a slight inherent lag. Breakout detection relies on historical data, and there may be a brief delay before the color reflects a new trend.
To achieve optimal results, consider:
Complementary Tools: Combine Supertrend EMA with other indicators or price action analysis for additional confirmation before entering trades.
Solid Risk Management: Always practice sound risk management strategies such as using stop-loss orders to limit potential losses.
Supertrend EMA is a powerful tool designed to simplify trend identification and enhance your trading experience. However, remember, no single indicator guarantees success. Use it with a comprehensive trading strategy and disciplined risk management for optimal results.
Disclaimer:
While the Supertrend EMA indicator can be a valuable tool for identifying potential trend changes, it's important to note that it's not infallible. Market conditions can be highly dynamic, and indicators may sometimes provide false signals. Therefore, it's crucial to use this indicator in conjunction with other technical analysis tools and sound risk management practices. Always conduct thorough research and consider consulting with a financial advisor before making any investment decisions.
Volatility-Adjusted DEMA Supertrend [QuantAlgo]Introducing the Volatility-Adjusted DEMA Supertrend by QuantAlgo 📈💫
Take your trading and investing strategies to the next level with the Volatility-Adjusted DEMA Supertrend , a dynamic tool designed to adapt to market volatility and provide clear, actionable trend signals. This innovative indicator is ideal for both traders and investors looking for a more responsive approach to market trends, helping you capture potential shifts with greater precision.
🌟 Key Features:
🛠 Customizable Trend Settings: Adjust the period for trend calculation and fine-tune the sensitivity to price movements. This flexibility allows you to tailor the Supertrend to your unique trading or investing strategy, whether you're focusing on shorter or longer timeframes.
📊 Volatility-Responsive Multiplier: The Supertrend dynamically adjusts its sensitivity based on real-time market volatility. This could help filter out noise in calmer markets and provide more accurate signals during periods of heightened volatility.
✨ Trend-Based Color-Coding: Visualize bullish and bearish trends with ease. The indicator paints candles and plots trend lines with distinct colors based on the current market direction, offering quick, clear insights into potential opportunities.
🔔 Custom Alerts: Set up alerts for key trend shifts to ensure you're notified of significant market changes. These alerts would allow you to act swiftly, potentially capturing opportunities without needing to constantly monitor the charts.
📈 How to Use:
✅ Add the Indicator: Add the Volatility-Adjusted DEMA Supertrend to your chart. Customize the trend period, volatility settings, and price source to match your trading or investing style. This ensures the indicator aligns with your market strategy.
👀 Monitor Trend Shifts: Watch the color-coded trend lines and candles as they dynamically shift based on real-time market conditions. These visual cues help you spot potential trend reversals and confirm your entries and exits with greater confidence.
🔔 Set Alerts: Configure alerts for key trend shifts, allowing you to stay informed of potential market reversals or continuation patterns, even when you're not actively watching the market.
⚙️ How It Works:
The Volatility-Adjusted DEMA Supertrend is designed to adapt to changes in market conditions, making it highly responsive to price volatility. The indicator calculates a trend line based on price and volatility, dynamically adjusting it to reflect recent market behavior. When the market experiences higher volatility, the trend line becomes more flexible, potentially allowing for greater sensitivity to rapid price movements. Conversely, during periods of low volatility, the indicator tightens its range, helping to reduce noise and avoid false signals.
The indicator includes a volatility-responsive multiplier, which further enhances its adaptability to market conditions. This means the trend direction would always be based on the latest market data, potentially helping you stay ahead of shifts or continuation trends. The Supertrend's visual color-coding simplifies the process of identifying bullish or bearish trends, while customizable alerts ensure you can stay on top of significant changes in market direction.
This tool is versatile and could be applied across various markets and timeframes, making it a valuable addition for both traders and investors. Whether you’re trading in fast-moving markets or focusing on longer-term investments, the Volatility-Adjusted DEMA Supertrend could help you remain aligned with the current market environment.
Disclaimer:
This indicator is designed to enhance your analysis by providing trend information, but it should not be used as the sole basis for making trading or investing decisions. Always combine it with other forms of analysis and risk management practices. No statements or claims aim to be financial advice, and no signals from us or our indicators should be interpreted as such. Past performance is not indicative of future results.

Machine Learning Adaptive SuperTrend [AlgoAlpha]📈🤖 Machine Learning Adaptive SuperTrend - Take Your Trading to the Next Level! 🚀✨
Introducing the Machine Learning Adaptive SuperTrend , an advanced trading indicator designed to adapt to market volatility dynamically using machine learning techniques. This indicator employs k-means clustering to categorize market volatility into high, medium, and low levels, enhancing the traditional SuperTrend strategy. Perfect for traders who want an edge in identifying trend shifts and market conditions.
What is K-Means Clustering and How It Works
K-means clustering is a machine learning algorithm that partitions data into distinct groups based on similarity. In this indicator, the algorithm analyzes ATR (Average True Range) values to classify volatility into three clusters: high, medium, and low. The algorithm iterates to optimize the centroids of these clusters, ensuring accurate volatility classification.
Key Features
🎨 Customizable Appearance: Adjust colors for bullish and bearish trends.
🔧 Flexible Settings: Configure ATR length, SuperTrend factor, and initial volatility guesses.
📊 Volatility Classification: Uses k-means clustering to adapt to market conditions.
📈 Dynamic SuperTrend Calculation: Applies the classified volatility level to the SuperTrend calculation.
🔔 Alerts: Set alerts for trend shifts and volatility changes.
📋 Data Table Display: View cluster details and current volatility on the chart.
Quick Guide to Using the Machine Learning Adaptive SuperTrend Indicator
🛠 Add the Indicator: Add the indicator to favorites by pressing the star icon. Customize settings like ATR length, SuperTrend factor, and volatility percentiles to fit your trading style.
📊 Market Analysis: Observe the color changes and SuperTrend line for trend reversals. Use the data table to monitor volatility clusters.
🔔 Alerts: Enable notifications for trend shifts and volatility changes to seize trading opportunities without constant chart monitoring.
How It Works
The indicator begins by calculating the ATR values over a specified training period to assess market volatility. Initial guesses for high, medium, and low volatility percentiles are inputted. The k-means clustering algorithm then iterates to classify the ATR values into three clusters. This classification helps in determining the appropriate volatility level to apply to the SuperTrend calculation. As the market evolves, the indicator dynamically adjusts, providing real-time trend and volatility insights. The indicator also incorporates a data table displaying cluster centroids, sizes, and the current volatility level, aiding traders in making informed decisions.
Add the Machine Learning Adaptive SuperTrend to your TradingView charts today and experience a smarter way to trade! 🌟📊

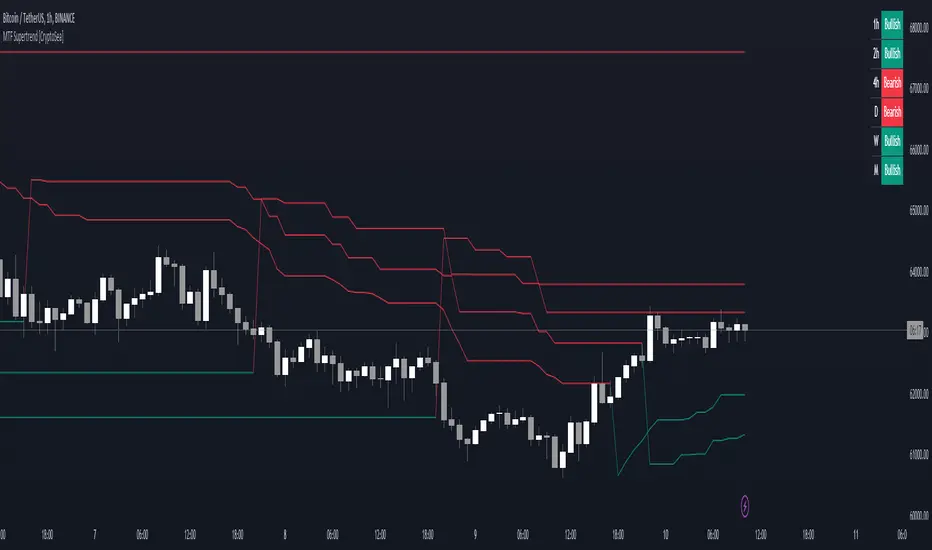
MTF Supertrend [CryptoSea]The MTF Supertrend Indicator is a versatile tool crafted to enhance trend analysis across multiple timeframes. Leveraging the reliable Supertrend formula, it provides traders with a comprehensive view of market trends and potential reversal points.
Key Features
Multi Timeframe Analysis: Tracks Supertrend signals over a variety of timeframes, offering a broad perspective on market direction.
Percentage Threshold Display: Filters out Supertrend data that is not within a specified percentage of the current price, keeping the display focused on relevant trends.
Adaptive Visual Display: Features a dynamic table that shows the current Supertrend status, which is fully customizable to the user's display preferences.
Customizable Sensitivity: Users can fine-tune the factor and ATR period settings, allowing for personalized trend sensitivity.
How it Works
Supertrend Calculation: Computes the Supertrend using the Average True Range (ATR) multiplied by a customizable factor, detecting changes in volatility and trend.
Higher Timeframe Filtering: Prioritizes higher timeframe trends over the current chart's timeframe to avoid chart clutter and focus on the most significant trends.
Colour-Coded Trends: Utilizes colour coding to clearly indicate bullish and bearish trends, aiding quick visual analysis.
Responsive Display Options: Includes a switchable table view to overlay trend information on the chart, with options for dark and light themes.
Benefits for Different Trading Styles
Day Traders: Use real-time updates to catch short-term trend reversals and ride the momentum for quick profits.
Swing Traders: Benefit from viewing medium to long-term trends to formulate strategies that span several days or weeks.
Position Traders: Utilize the monthly supertrend data to make long-term investment decisions based on prevailing market directions.
Application
Strategic Decision-Making: Assists traders in making informed decisions by providing a layered view of trend directions across timeframes.
Trend Confirmation: Reinforces trading strategies by confirming trends with higher timeframe Supertrend alignment.
Customized Analysis: Adapts to various trading styles with input settings that control the display and sensitivity of trend data.
The MTF Supertrend Indicator by is a powerful addition to the trader's toolkit, enhancing multi-timeframe trend analysis and contributing to a strategic trading approach in volatile markets.
Hash SupertrendHash Supertrend is a visually enhanced Supertrend-based indicator designed by Hash Capital Research, tuned specifically for crypto trend trading on Solana (SOL) and Bitcoin (BTC). It combines institutional-style color coding, an optional session time filter, and production-ready alerts for systematic and discretionary traders alike.
What This Indicator Is
Hash Supertrend is a trend-following volatility band indicator built on TradingView’s native ta.supertrend() function.
It’s optimized and visually styled for:
High-volatility crypto pairs (especially SOL/USDT, SOL/USD, BTC/USDT, BTC/USD)
Timeframes typically used by crypto traders (from 5m scalping to 4H swing and 1D trend following)
The script is an indicator, not a strategy:
It does not place trades or show backtest results.
It provides clear trend states, flips, and alerts that you can plug into your own execution stack or manual trading.
Key Features
✅ Tuned for Crypto (Solana & Bitcoin)
Parameters are chosen to respond well to the volatility profile of SOL and BTC, reducing noise while still catching strong moves.
✅ Non-repainting Supertrend Core
Uses TradingView’s built-in ta.supertrend — values may move intrabar as the bar forms, but once a bar closes, the historical line and signals do not repaint.
✅ Fluorescent Trend Visualization
Bright green for bullish phases
Bright red for bearish phases
Adaptive color intensity based on user setting
✅ Glow Layer & Trend Zones
Glow effect around the Supertrend line for instant visual recognition
Optional filled zones between price and line for “trend cloud” style visualization
✅ Time Filter (Session Control)
Option to only mark signals during specific hours for those wanting to integrate with webhooks
Designed for traders who avoid certain sessions (e.g., low-liquidity hours)
✅ Signal Dots & Alerts
Tiny green dots for bullish flips
Tiny red dots for bearish flips
Professional, preconfigured alerts for:
Long Entry
Short Entry
Any Trend Change
Filtered signals outside trading hours (for monitoring only)
The core logic is built on:
ATR Length (ATR Length) Default: 16
Lower values (7–10): more sensitive, more signals, more noise
Higher values (12–20): smoother, fewer but stronger trend signals
Factor (Factor) Default: 3.11
Lower values (1.5–2.5): tighter bands, earlier entries, higher whipsaws
Higher values (3.0–4.0+): wider bands, later entries, stronger trend confirmation
The indicator reads direction from ta.supertrend and classifies:
Bullish Trend: direction < 0
Bearish Trend: direction > 0
A trend flip happens when direction changes sign:
longSignal: Supertrend flips from above price to below price (bearish → bullish)
shortSignal: Supertrend flips from below price to above price (bullish → bearish)

Adaptive ATR% Grid + SuperTrend + OrderFlipDescription:
This indicator combines multiple technical analysis tools to identify key price levels and trading signals:
ATR% Grid – automatic plotting of support and resistance levels based on current price and volatility (ATR). Useful for identifying potential targets and entry/exit zones.
SuperTrend – a classic trend indicator with an adaptive ATR multiplier that adjusts based on average volatility.
OrderFlip – identifies price reversal points relative to a moving average with ATR-based sensitivity, optionally filtered by OBV and DMI.
MTF Confirmation – multi-timeframe trend verification using EMA to reduce false signals.
Signal Labels – "LONG" and "SHORT" labels appear on the chart with an offset from the price for better visibility.
JSON Alerts – ready-to-use format for automated alerts, including price, SuperTrend direction, Fair Zone, and ATR%.
Features:
Fully compatible with Pine Script v6
Lines and signals are fixed on the chart, do not shift with new bars
Configurable grid, ATR, SuperTrend, and filter parameters
Works with MTF analysis and classic indicators (OBV/DMI)
Usage:
Best used with additional indicators and risk management strategies. ATR% Grid is ideal for both positional trading and intraday setups.
перевод на русский
Описание:
Этот индикатор объединяет несколько методов технического анализа для выявления ключевых уровней цены и сигналов на покупку/продажу:
Сетка ATR% (ATR% Grid) – автоматическое построение уровней поддержки и сопротивления на основе текущей цены и волатильности (ATR). Позволяет видеть потенциальные цели и зоны входа/выхода.
SuperTrend – классический трендовый индикатор с адаптивным множителем ATR, который корректируется на основе средней волатильности.
OrderFlip – определение моментов разворота цены относительно скользящей средней с учетом ATR, с возможностью фильтрации по OBV и DMI.
MTF-подтверждение – проверка направления тренда на нескольких таймфреймах с помощью EMA, чтобы снизить ложные сигналы.
Сигнальные метки – на графике появляются "LONG" и "SHORT" с отступом от цены для наглядности.
JSON Alerts – готовый формат для автоматических уведомлений, включающий цену, направление SuperTrend, Fair Zone и ATR%.
Особенности:
Поддержка Pine Script v6
Линии и сигналы закреплены на графике, не двигаются при обновлении свечей
Настраиваемые параметры сетки, ATR, SuperTrend и фильтров
Совместимость с MTF-анализом и классическими индикаторами OBV/DMI
Рекомендации:
Используйте в сочетании с другими индикаторами и стратегиями управления риском. Сетка ATR% отлично подходит для позиционной торговли и интрадей.
ATR% Grid – automatic plotting of support and resistance levels based on current price and volatility (ATR). Useful for identifying potential targets and entry/exit zones.
SuperTrend – a classic trend indicator with an adaptive ATR multiplier that adjusts based on average volatility.

Supertrend - Support & ResistanceSupertrend – Multi-Timeframe Support & Resistance
This script overlays multiple Supertrend bands from higher timeframes on a single chart and treats them as dynamic support and resistance. The goal is simple: see the bigger picture without leaving your current timeframe.
What it does
• Calculates Supertrend using the same ATR Length and Factor across 5m, 15m, 30m, 1h, 4h, 8h, 12h, and 1D.
• Pulls each timeframe via request.security(..., lookahead_off) so values only update on candle close. No look-ahead, no “teleporting” lines.
• Plots each timeframe’s Supertrend as an on-chart band with increasing transparency the higher you go, so you can visually separate short-term vs higher-timeframe structure.
• Colors indicate direction:
• Green = bearish band above price (acting as resistance)
• Red = bullish band below price (acting as support)
• Drops compact labels (5m, 15m, 30m, etc.) every 20 bars right on the corresponding Supertrend level, so you can quickly identify which line belongs to which timeframe.
Why this helps
Supertrend is great for trend definition and trailing stops. But one timeframe alone can whipsaw you. By stacking multiple timeframes:
• Confluence stands out. When several higher-TF bands cluster, price often reacts.
• You see where intraday pullbacks are likely to pause (lower TF bands) and where trend reversals are more meaningful (higher TF bands).
• It’s easier to align entries with the dominant trend while still timing them on your working timeframe.
How it works (quick refresher)
Supertrend uses ATR to offset a median price with a multiplier (Factor). When price crosses the band, direction flips and the trailing line switches sides. This script exposes:
• ATR Length (default 10): sensitivity of the ATR. Smaller = tighter band, more flips. Larger = smoother, fewer flips.
• Factor (default 3.0): multiplier applied to ATR. Larger = wider band, more conservative.
The same settings are used for all timeframes for clean, apples-to-apples comparisons.
How to use it
• Trend alignment: Prefer longs when most higher-TF lines are below price (red support). Prefer shorts when most are above price (green resistance).
• Pullback entries: In an uptrend, look for pullbacks into a lower-TF red band that lines up near a higher-TF red band. That overlap is your “zone.”
• Breakout confirmation: A strong break and close beyond a higher-TF band carries more weight than a lower-TF poke.
• Stops and targets: Use the nearest opposing band as a logic point. For example, in a long, if price loses the lower-TF red band and the next higher-TF band is close overhead, trim or tighten.
Signals you can read at a glance
• Stacking: Multiple red bands beneath price = strong bullish structure. Multiple green bands above price = strong bearish structure.
• Compression: Bands from different TFs squeezing together often precede expansion.
• Flip zones: When a higher-TF band flips side, treat that level as newly minted support/resistance.
Design choices in the code
• lookahead_off on all request.security calls avoids repainting from future data.
• Increasing transparency as the timeframe rises makes lower-TF context visible without drowning the chart.
• Labels every 20 bars keep the chart readable while still giving you frequent anchors.
Good to know (limits and tips)
• This is an overlay of closed-bar Supertrend values from higher TFs. Intrabar moves can still exceed a band before close; final signal prints at candle close of that timeframe.
• Using the same ATR/factor across TFs makes confluence easier to judge. If you need independent tuning per TF, you can clone the security calls and add separate inputs.
• On very low timeframes with many symbols, multiple request.security calls can be heavy. If performance drops, hide one or two higher TFs or increase the label spacing.
Risk note
This is a context tool, not an auto-trader. Combine it with structure (HH/HL vs LH/LL), volume, and your execution rules. Always test on your market and timeframe before committing real capital.
Machine Learning SupertrendThe Machine Learning Supertrend is an advanced trend-following indicator that enhances the traditional Supertrend with Gaussian Process Regression (GPR) and kernel-based learning. Unlike conventional methods that rely purely on historical ATR values, this indicator integrates machine learning techniques to dynamically estimate volatility and forecast future price movements, resulting in a more adaptive and robust trend detection system.
At the core of this indicator lies Gaussian Process Regression (GPR), which utilizes a Radial Basis Function (RBF) kernel to model price distributions and anticipate future trends. Instead of simply looking at past price action, it constructs a kernel matrix, enabling a probabilistic approach to price forecasting. This allows the indicator to not only detect current trends but also project potential trend reversals with greater accuracy.
By applying machine learning to ATR estimation, the ML Supertrend dynamically adjusts its thresholds based on predicted values rather than a fixed multiplier. This makes the trend signals more responsive to market conditions, reducing false signals and minimizing whipsaws often seen with traditional Supertrend indicators. The upper and lower bands are no longer static but evolve based on the underlying price structure, improving the reliability of trend shifts.
When the price crosses these adaptive levels, the indicator detects a trend change and plots it accordingly. Green signifies a bullish trend, while red indicates a bearish one. Alerts can also be triggered when the trend shifts, allowing traders to react quickly to potential reversals.
What makes this approach powerful is its ability to adapt to different market conditions. Traditional ATR-based methods use fixed parameters that might not always be optimal, whereas this ML-driven Supertrend continuously refines its estimations based on real-time data. The result is a more intelligent, less lagging, and highly adaptive trend-following tool.
This indicator is particularly useful for traders looking to enhance trend-following strategies with AI-driven insights. It reduces noise, improves signal reliability, and even offers a degree of trend forecasting, making it ideal for those who want a more advanced and dynamic alternative to standard Supertrend indicators.
This indicator is provided for educational and informational purposes only. It does not constitute financial advice, and past performance is not indicative of future results. Trading involves risk, and users should conduct their own research and use proper risk management before making investment decisions.
[EmreKb] Supertrend FakeoutSupertrend Fakeout
This script is an enhanced version of the classic Supertrend indicator. It incorporates an additional feature that ensures trend reversals are more reliable by introducing a Fakeout Index Limit and a Fakeout ATR Mult. This helps avoid false trend changes that could occur due to short-term price fluctuations or market noise.
How It Works:
The Supertrend indicator uses Average True Range (ATR) and a multiplier to determine the direction of the trend. When the price is above the Supertrend line, it indicates an uptrend; when the price is below the Supertrend line, it signals a downtrend.
This version goes a step further by adding the following checks before confirming a trend reversal:
The script will monitor if the price moves "Fakeout ATR Mult" ATR away from the Supertrend line after a potential breach. This distance helps ensure that the trend change is significant and not just a minor fluctuation.
In addition, the script checks the price action for a specific number of bars, which is controlled by the Fakeout Index Limit. This limit determines how many bars the price must remain below (for a downtrend) or above (for an uptrend) the Supertrend line before the trend is officially reversed.

Entropy-Based Adaptive SuperTrendOverview:
Introducing the Entropy-Based Adaptive SuperTrend – a groundbreaking trading indicator designed to adapt dynamically to market conditions using market entropy. This enhanced SuperTrend indicator adjusts its sensitivity according to the level of chaos (or order) in price movements, providing more stable signals during volatile periods and more responsive signals when the market becomes orderly.
Key Features:
Entropy-Adaptive Mechanism: By incorporating an entropy measure, this indicator estimates the degree of unpredictability in the market. During high entropy periods (more chaotic), signals are made less sensitive, while during low entropy periods, the indicator reacts more quickly to price changes.
Adaptive ATR Multiplier: Unlike traditional SuperTrend indicators that use a fixed ATR multiplier, this version calculates a dynamic ATR multiplier based on the entropy score, ensuring more flexibility and adaptability in setting stop levels.
Visual Clarity: The indicator is overlayed on the price chart with customizable visual elements. The bullish and bearish trends are color-coded for ease of use, and optional entry signals ("L" for long and "S" for short) are plotted to clearly mark potential entry opportunities.
Alerts for Key Opportunities : Never miss an opportunity with built-in alerts for buy and sell signals. Traders can easily configure these alerts to be notified instantly when market conditions trigger a new trend.
How It Works:
Entropy Calculation: The entropy of the price data is calculated over a user-defined period, giving an indication of the degree of randomness in the price movements. The result is then smoothed to reduce noise and create a meaningful trend indication.
Dynamic ATR Adjustment: The ATR (Average True Range) multiplier, which controls the distance of the trailing stop, is adjusted based on the entropy score. This allows the SuperTrend line to widen in chaotic times, reducing false signals, while tightening in orderly times, allowing quicker trend captures.
Parameters Explained:
Entropy Settings: Control the sensitivity of entropy calculations, including the look-back period, number of bins for price distribution, and smoothing length.
Adaptive Settings: Adjust how the indicator adapts to different levels of entropy, including the adaptation period and the filtering weight.
SuperTrend Settings : Customize the ATR period and the dynamic multiplier range to fine-tune the trailing stops for your trading style.
Visual Settings: Choose your preferred colors for bullish and bearish trends, and decide if you want the entry labels displayed directly on the chart.
Use Cases:
Swing Traders can utilize the indicator to capture trend reversals while filtering out the noise during high entropy periods.
Intraday Traders can adapt the settings for shorter time frames to benefit from dynamic adjustments that reduce overtrading and false signals.
Risk Management: The entropy-based adaptive feature provides an edge in risk management by reducing sensitivity during times of increased chaos, thus helping to limit unnecessary trades.
How to Use It:
Look for entry labels ("L" for long, "S" for short) to identify potential opportunities.
Use the color-coded trendlines to determine market bias: greenish hue for bullish trends, reddish hue for bearish trends.
Customize the input settings to align with your preferred market timeframe and risk profile.
Alerts & Notifications:
Built-in alerts notify you of significant trend changes. Simply enable these alerts to receive updates when a new long or short opportunity is detected, helping you stay ahead without needing to watch the screen constantly.
Customization Tips:
Longer Timeframes : Increase the Entropy Period to better capture macro trends in high timeframe charts.
Higher Volatility Markets: Increase the ATR Max Multiplier to ensure stops are set farther away during high entropy.
Lower Volatility Markets: Use a lower ATR Base Multiplier and tighter entropy thresholds to capture rapid price movements.
Final Thoughts:
The Entropy-Based Adaptive SuperTrend indicator merges traditional trend-following logic with an adaptive mechanism driven by market entropy, aiming to address the challenges of whipsaws and false signals common in conventional SuperTrend setups. This indicator offers an intelligent and flexible way to track market trends, suitable for both beginners and experienced trade

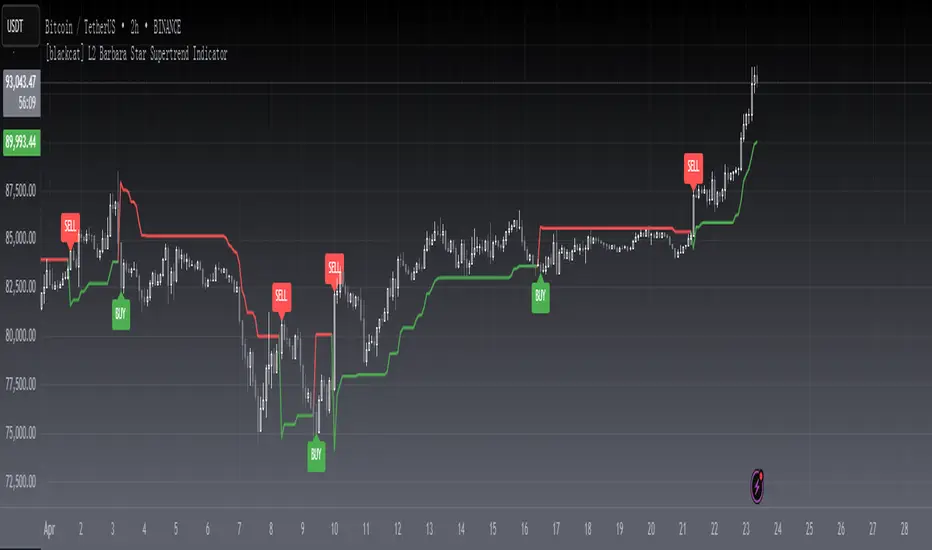
[blackcat] L2 Barbara Star Supertrend IndicatorLevel 2
Background
Barbara Star’s article on July 2023, “Stay On Track With The Supertrend Indicator”, I rewrote it as pine script for your information.
Function
A supertrend indicator is displayed either above or below the closing price to signal a buy or sell. The indicator changes color depending on whether you should buy or not. When the Supertrend indicator falls below the closing price, the indicator turns green, signaling one or more entry points to buy.
Author Barbara Star describes the Supertrend indicator and how it can be used as a means for traders to stay in sync with the larger trend. She explains how J. Welles Wilder's Average True Range (ATR) forms a basis for supertrend calculations. ATR does not measure price direction, but rather provides a measure of volatility over a period of time. The Supertrend indicator, on the other hand, provides a more comprehensive view of trend direction. In addition, the indicator provides price levels at which a trend reversal would occur.
Green color stands for up trend;
Red color stands for down trend.
Remarks
Feedbacks are appreciated.
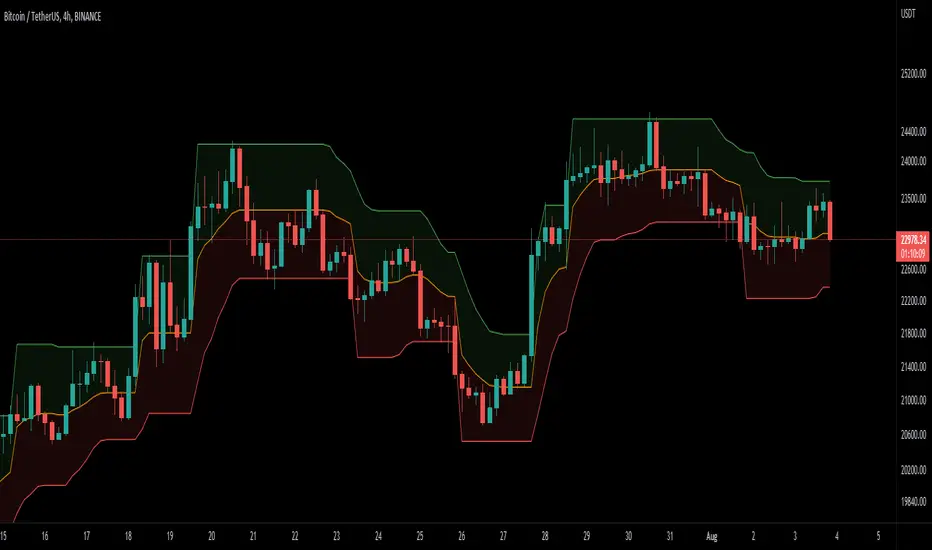
DEMA Supertrend Bands [Misu]█ Indicator based on DEMA (Double Exponential Moving Average) & Supertrend to show Bands .
DEMA attempts to remove the inherent lag associated with Moving Averages by placing more weight on recent values.
Supertrend aims to detect price trends, it's also used to set protective stops.
█ Usages:
Combining Dema to calculate Supertrend results in nice lower and upper bands.
This can be used to identify potential supports and resistances and set protective stops.
█ Parameters:
Length DEMA: Double Ema lenght used to calculate DEMA. Dema is used by Supertrend indicator.
Length Atr: Atr lenght used to calculate Atr. Atr is used by Supertrend indicator.
Band Mult: Used to calculate Supertrend Bands width.
█ Other Applications:
The mid band can be used to filter bad signals in the manner of a more classical Moving Average.
MA Candles - SupertrendConverting strategy to indicator for those who want to use it as indicator.
Concepts are simple :
Calculate moving average of High, Low, Open and Close and make candles of them
Calculate ATR and derive supertrend on the moving average candles.
Alerts :
Bullish Crossover - When supertrend turns green
Bearish Crossover - When supertrend turns red
Bullish Pullback - Supertrend is green but close crossed below Moving average high
Bearish Pullback - Supertrend is red but close crossed above Moving average low
Original strategy is present here:
