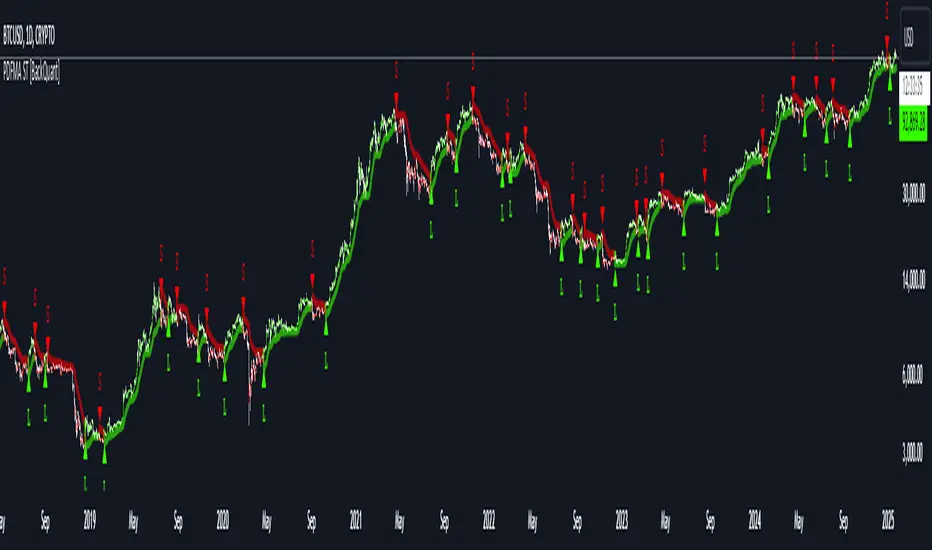
PDF-MA Supertrend [BackQuant]PDF-MA Supertrend
The PDF-MA Supertrend combines the innovative Probability Density Function (PDF) smoothing with the widely popular Supertrend methodology, creating a robust tool for identifying trends and generating actionable trading signals. This indicator is designed to provide precise entries and exits by dynamically adapting to market volatility while visualizing long and short opportunities directly on the chart.
Core Feature: PDF Smoothing
At the foundation of this indicator is the PDF smoothing technique, which applies a Probability Density Function to calculate a smoothed moving average. This method allows the indicator to assign adaptive weights to data points, making it responsive to market changes without overreacting to short-term volatility.
Key parameters include:
Variance: Controls the spread of the PDF weighting. A smaller variance results in sharper responses, while a larger variance smooths out the curve.
Mean: Shifts the PDF’s center, allowing traders to tweak how weights are distributed around the data points.
Smoothing Method: Offers the choice between EMA (Exponential Moving Average) and SMA (Simple Moving Average) for blending the PDF-smoothed data with traditional moving average methods.
By combining these parameters, the PDF smoothing creates a moving average that effectively captures underlying trends.
Supertrend: Adaptive Trend and Volatility Tracking
The Supertrend is a well-known volatility-based indicator that dynamically adjusts to market conditions using the ATR (Average True Range). In this script, the PDF-smoothed moving average acts as the price input, making the Supertrend calculation more adaptive and precise.
Key Supertrend Features:
ATR Period: Determines the lookback period for calculating market volatility.
Factor: Multiplies the ATR to set the distance between the Supertrend and the price. A higher factor creates wider bands, filtering out smaller price movements, while a lower factor captures tighter trends.
Dynamic Direction: The Supertrend flips its direction based on price interactions with the calculated upper and lower bands:
Uptrend : When the price is above the Supertrend, the direction turns bullish.
Downtrend : When the price is below the Supertrend, the direction turns bearish.
This combination of PDF smoothing and Supertrend calculation ensures that trends are detected with greater accuracy, while volatility filters out market noise.
Long and Short Signal Generation
The PDF-MA Supertrend generates actionable trading signals by detecting transitions in the trend direction:
Long Signal (𝕃): Triggered when the trend transitions from bearish to bullish. This is visually represented with a green triangle below the price bars.
Short Signal (𝕊): Triggered when the trend transitions from bullish to bearish. This is marked with a red triangle above the price bars.
These signals provide traders with clear entry and exit points, ensuring they can capitalize on emerging trends while avoiding false signals.
Customizable Visualization Options
The indicator offers a range of visualization settings to help traders interpret the data with ease:
Show Supertrend: Option to toggle the visibility of the Supertrend line.
Candle Coloring: Automatically colors candlesticks based on the trend direction:
Green for long trends.
Red for short trends.
Long and Short Signals (𝕃 + 𝕊): Displays long (𝕃) and short (𝕊) signals directly on the chart for quick identification of trade opportunities.
Line Color Customization: Allows users to customize the colors for long and short trends.
Alert Conditions
To ensure traders never miss an opportunity, the PDF-MA Supertrend includes built-in alerts for trend changes:
Long Signal Alert: Notifies when a bullish trend is identified.
Short Signal Alert: Notifies when a bearish trend is identified.
These alerts can be configured for real-time notifications via SMS, email, or push notifications, making it easier to stay updated on market movements.
Suggested Parameter Adjustments
The indicator’s effectiveness can be fine-tuned using the following guidelines:
Variance:
For low-volatility assets (e.g., indices): Use a smaller variance (1.0–1.5) for smoother trends.
For high-volatility assets (e.g., cryptocurrencies): Use a larger variance (1.5–2.0) to better capture rapid price changes.
ATR Factor:
A higher factor (e.g., 2.0) is better suited for long-term trend-following strategies.
A lower factor (e.g., 1.5) captures shorter-term trends.
Smoothing Period:
Shorter periods provide more reactive signals but may increase noise.
Longer periods offer stability and better alignment with significant trends.
Experimentation is encouraged to find the optimal settings for specific assets and trading strategies.
Trading Applications
The PDF-MA Supertrend is a versatile indicator suited to a variety of trading approaches:
Trend Following : Use the Supertrend line and signals to follow market trends and ride sustained price movements.
Reversal Trading : Spot potential trend reversals as the Supertrend flips direction.
Volatility Analysis : Adjust the ATR factor to filter out minor price fluctuations or capture sharp movements.
Final Thoughts
The PDF-MA Supertrend combines the precision of Probability Density Function smoothing with the adaptability of the Supertrend methodology, offering traders a powerful tool for identifying trends and volatility. With its customizable parameters, actionable signals, and built-in alerts, this indicator is an excellent choice for traders seeking a robust and reliable system for trend detection and entry/exit timing.
As always, backtesting and incorporating this indicator into a broader strategy are recommended for optimal results.
Recherche dans les scripts pour "supertrend"
Curved Radius Supertrend [BOSWaves]Curved Radius Supertrend — Adaptive Parabolic Trend Framework with Dynamic Acceleration Geometry
Overview
The Curved Radius Supertrend introduces an evolution of the classic Supertrend indicator - engineered with a dynamic curvature engine that replaces rigid ATR bands with parabolic, radius-based motion. Traditional Supertrend systems rely on static band displacement, reacting linearly to volatility and often lagging behind emerging price acceleration. The Curved Radius Supertend model redefines this by integrating controlled acceleration and curvature geometry, allowing the trend bands to adapt fluidly to both velocity and duration of price movement.
The result is a smoother, more organic trend flow that visually captures the momentum curve of price action - not just its direction. Instead of sharp pivots or whipsaws, traders experience a structurally curved trajectory that mirrors real market inertia. This makes it particularly effective for identifying sustained directional phases, detecting early trend rotations, and filtering out noise that plagues standard Supertrend methodologies.
Unlike conventional band-following systems, the Curved Radius framework is time-reactive and velocity-aware, providing a nuanced signal structure that blends geometric precision with volatility sensitivity.
Theoretical Foundation
The Curved Radius Supertrend draws from the intersection of mathematical curvature dynamics and adaptive volatility processing. Standard Supertrend algorithms extend from Average True Range (ATR) envelopes - a linear measure of volatility that moves proportionally with price deviation. However, markets do not expand or contract linearly. Trend velocity typically accelerates and decelerates in nonlinear arcs, forming natural parabolas across price phases.
By embedding a radius-based acceleration function, the indicator models this natural behavior. The core variable, radiusStrength, controls how aggressively curvature accelerates over time. Instead of simply following price distance, the band now evolves according to temporal acceleration - each bar contributes incremental velocity, bending the trend line into a radius-like curve.
This structural design allows the indicator to anticipate rather than just respond to price action, capturing momentum transitions as curved accelerations rather than binary flips. In practice, this eliminates the stutter effect typical of standard Supertrends and replaces it with fluid directional motion that better reflects actual trend geometry.
How It Works
The Curved Radius Supertrend is constructed through a multi-stage process designed to balance price responsiveness with geometric stability:
1. Baseline Supertrend Core
The framework begins with a standard ATR-derived upper and lower band calculation. These define the volatility envelope that constrains potential price zones. Directional bias is determined through crossover logic - prices above the lower band confirm an uptrend, while prices below the upper band confirm a downtrend.
2. Curvature Acceleration Engine
Once a trend direction is established, a curvature engine is activated. This system uses radiusStrength as a coefficient to simulate acceleration per bar, incrementally increasing velocity over time. The result is a parabolic displacement from the anchor price (the price level at trend change), creating a curved motion path that dynamically widens or tightens as the trend matures.
Mathematically, this acceleration behaves quadratically - each new bar compounds the previous velocity, forming an exponential rate of displacement that resembles curved inertia.
3. Adaptive Smoothing Layer
After the radius curve is applied, a smoothing stage (defined by the smoothness parameter) uses a simple moving average to regulate curve noise. This ensures visual coherence without sacrificing responsiveness, producing flowing arcs rather than jagged band steps.
4. Directional Visualization and Outer Envelope
Directional state (bullish or bearish) dictates both the color gradient and band displacement. An outer envelope is plotted one ATR beyond the curved band, creating a layered trend visualization that shows the extent of volatility expansion.
5. Signal Events and Alerts
Each directional transition triggers a 'BUY' or 'SELL' signal, clearly labeling phase shifts in market structure. Alerts are built in for automation and backtesting.
Interpretation
The Curved Radius Supertrend reframes how traders visualize and confirm trends. Instead of simply plotting a trailing stop, it maps the dynamic curvature of trend development.
Uptrend Phases : The band curves upward with increasing acceleration, reflecting the market’s growing directional velocity. As curvature steepens, conviction strengthens.
Downtrend Phases : The band bends downward in a mirrored acceleration pattern, indicating sustained bearish momentum.
Trend Change Points : When the direction flips and a new anchor point forms, the curve resets - providing a clean, early visual confirmation of structural reversal.
Smoothing and Radius Interplay : A lower radius strength produces a tighter, more reactive curve ideal for scalping or short timeframes. Higher values generate broad, sweeping arcs optimized for swing or positional analysis.
Visually, this curvature system translates market inertia into shape - revealing how trends bend, accelerate, and ultimately exhaust.
Strategy Integration
The Curved Radius Supertrend is versatile enough to integrate seamlessly into multiple trading frameworks:
Trend Following : Use BUY/SELL flips to identify emerging directional bias. Strong curvature continuation confirms sustained momentum.
Momentum Entry Filtering : Combine with oscillators or volume tools to filter entries only when the curve slope accelerates (high momentum conditions).
Pullback and Re-entry Timing : The smooth curvature of the radius band allows traders to identify shallow retracements without premature exits. The band acts as a dynamic, self-adjusting support/resistance arc.
Volatility Compression and Expansion : Flattening curvature indicates volatility compression - a potential pre-breakout zone. Rapid re-steepening signals expansion and directional conviction.
Stop Placement Framework : The curved band can serve as a volatility-adjusted trailing stop. Because the curve reflects acceleration, it adapts naturally to market rhythm - widening during momentum surges and tightening during stagnation.
Technical Implementation Details
Curved Radius Engine : Parabolic acceleration algorithm that applies quadratic velocity based on bar count and radiusStrength.
Anchor Logic : Resets curvature at each trend change, establishing a new reference base for directional acceleration.
Smoothing Layer : SMA-based curve smoothing for noise reduction.
Outer Envelope : ATR-derived band offset visualizing volatility extension.
Directional Coloring : Candle and band coloration tied to current trend state.
Signal Engine : Built-in BUY/SELL markers and alert conditions for automation or script integration.
Optimal Application Parameters
Timeframe Guidance :
1-5 min (Scalping) : 0.08–0.12 radius strength, minimal smoothing for rapid responsiveness.
15 min : 0.12–0.15 radius strength for intraday trends.
1H : 0.15–0.18 radius strength for structured short-term swing setups.
4H : 0.18–0.22 radius strength for macro-trend shaping.
Daily : 0.20–0.25 radius strength for broad directional curves.
Weekly : 0.25–0.30 radius strength for smooth macro-level cycles.
The suggested radius strength ranges provide general structural guidance. Optimal values may vary across assets and volatility regimes, and should be refined through empirical testing to account for instrument-specific behavior and prevailing market conditions.
Asset Guidance :
Cryptocurrency : Higher radius and multiplier values to stabilize high-volatility environments.
Forex : Midrange settings (0.12-0.18) for clean curvature transitions.
Equities : Balanced curvature for trending sectors or momentum rotation setups.
Indices/Futures : Moderate radius values (0.15-0.22) to capture cyclical macro swings.
Performance Characteristics
High Effectiveness :
Trending environments with directional expansion.
Markets exhibiting clean momentum arcs and low structural noise.
Reduced Effectiveness :
Range-bound or low-volatility conditions with repeated false flips.
Ultra-short-term timeframes (<1m) where curvature acceleration overshoots.
Integration Guidelines
Confluence Framework : Combine with structure tools (order blocks, BOS, liquidity zones) for entry validation.
Risk Management : Trail stops along the curved band rather than fixed points to align with adaptive market geometry.
Multi-Timeframe Confirmation : Use higher timeframe curvature as a trend filter and lower timeframe curvature for execution timing.
Curve Compression Awareness : Treat flattening arcs as potential exhaustion zones - ideal for scaling out or reducing exposure.
Disclaimer
The Curved Radius Supertrend is a geometric trend model designed for professional traders and analysts. It is not a predictive system or a guaranteed profit method. Its performance depends on correct parameter calibration and sound risk management. BOSWaves recommends using it as part of a comprehensive analytical framework, incorporating volume, liquidity, and structural context to validate directional signals.

Volatility Layered Supertrend [NLR]We’ve all used Supertrend, but do you know where to actually enter a trade? Volatility Layered Supertrend (VLS) is here to solve that! This advanced trend-following indicator builds on the classic Supertrend by not only identifying trends and their strength but also guiding you to the best trade entry points. VLS divides the main long-term trend into “Strong” and “Weak” Zones, with a clear “Trade Entry Zone” to help you time your trades with precision. With layered trends, dynamic profit targets, and volatility-adaptive bands, VLS delivers actionable signals for any market.
Why I Created VLS Over a Plain Supertrend
I built VLS to address the gaps in traditional Supertrend usage and make trade entries clearer:
Single-Line Supertrend Issues: The default Supertrend sets stop-loss levels that are too wide, making it impractical for most traders to use effectively.
Unclear Entry Points: Standard Supertrend doesn’t tell you where to enter a trade, often leaving you guessing or entering too early or late.
Multi-Line Supertrend Enhancement: Many traders use short, medium, and long Supertrends, which is helpful but can lack focus. In VLS, I include Short, Medium, and Long trends (using multipliers 1 to 3), and add multipliers 4 and 5 to track extra long-term trends—helping to avoid fakeouts that sometimes occur with multiplier 3.
My Solution: I focused on the main long-term Supertrend and split it into “Weak Zone” and “Strength Zone” to show the trend’s reliability. I also defined a “Trade Entry Zone” (starting from the Mid Point, with the first layer’s background hidden for clarity) to guide you on where to enter trades. The zones include Short, Medium, and Long Trend layers for precise entries, exits, and stop-losses.
Practical Trading: This approach provides realistic stop-loss levels, clear entry points, and a “Profit Target” line that aligns with your risk tolerance, while filtering out false signals with longer-term trends.
Key Features
Layered Trend Zones: Short, Medium, Long, and Extra Long Trend layers (up to multipliers 4 and 5) for timing entries and exits.
Strong & Weak Zones: See when the trend is reliable (Strength Zone) or needs caution (Weak Zone).
Trade Entry Zone: A dedicated zone starting from the Mid Point (first layer’s background hidden) to show the best entry points.
Dynamic Profit Targets: A “Profit Target” line that adjusts with the trend for clear goals.
Volatility-Adaptive: Uses ATR to adapt to market conditions, ensuring reliable signals.
Color-Coded: Green for uptrends, red for downtrends—simple and clear.
How It Works
VLS enhances the main long-term Supertrend by dividing it into two zones:
Weak Zone: Indicates a less reliable trend—use tighter stop-losses or wait for the price to reach the Trade Entry Zone.
Strength Zone: Signals a strong trend—ideal for entries with wider stop-losses for bigger moves.
The “Trade Entry Zone” starts at the Mid Point (last layer’s background hidden for clarity), showing you the best area to enter trades. Each zone includes Short, Medium, Long, and Extra Long Trend sublevels (up to multipliers 4 and 5) for precise trade timing and to filter out fakeouts. The “Profit Target” updates dynamically based on trend direction and volatility, giving you a clear goal.
How to Use
Spot the Trend: Green bands = buy, red bands = sell.
Check Strength: Price in Strength Zone? Trend’s reliable—trade confidently. In Weak Zone? Use tighter stops or wait.
Enter Trades: Use the “Trade Entry Zone” (from the Mid Point upward) for the best entry points.
Use Sublevels: Short, Medium, Long, and Extra Long layers in each zone help fine-tune entries and exits.
Set Targets: Follow the Profit Target line for goals—it updates automatically.
Combine Tools: Pair with RSI, MACD, or support/resistance for added confirmation.
Settings
ATR Length: Adjust the ATR period (default 10) to change sensitivity.
Up/Down Colors: Customize colors—green for up, red for down, by default.

Experimental Supertrend [CHE]Experimental Supertrend — Combines EMA crossovers for trend regime detection with an adaptive ATR-based hull that selects the narrowest band to contain recent highs and lows, minimizing false breaks in varying volatility.
Summary
This indicator overlays a dynamic supertrend boundary around a midline derived from dual EMAs, using EMA crossovers to switch between bullish and bearish regimes. The hull adapts by evaluating multiple ATR periods and selecting the tightest one that fully encloses price action over a specified window, which helps in creating more stable trend lines that hug price without excessive gaps or breaches. Fills between the midline and hull provide visual cues for trend strength, darkening temporarily after regime changes to highlight transitions. Alerts trigger on crossovers, and markers label entry points, making it suitable for trend-following setups where standard supertrends might whipsaw. Overall, it offers robustness through auto-adjustment, reducing sensitivity to noise while maintaining responsiveness to genuine shifts.
Motivation: Why this design?
Standard supertrend indicators often flip prematurely in choppy markets due to fixed multipliers that do not account for localized volatility patterns, leading to frequent false signals and eroded confidence in trends. This design addresses that by incorporating an EMA-based regime filter for directional bias and an auto-adaptive hull that dynamically tunes the band width based on recent price containment needs. By prioritizing the narrowest effective enclosure, it avoids over-wide bands in calm periods that cause lag or under-wide ones in volatility spikes that invite breaks, providing a more consistent trailing reference without manual tweaking.
What’s different vs. standard approaches?
- Reference baseline: Diverges from the classic ATR-multiplier supertrend, which uses a single fixed period and constant factor applied to close or high/low deviations.
- Architecture differences:
- Auto-selection from candidate ATR lengths to find the optimal period for current conditions.
- Dynamic multiplier clamped between floor and cap values, adjusted by padding to ensure reliable containment.
- Regime-gated rendering, where hull position flips based on EMA relative positioning.
- Post-transition visual fading to emphasize change points without altering core logic.
- Practical effect: Charts show tighter, more reactive bands that rarely breach during trends, reducing visual clutter from flips; the adaptive nature means less intervention across assets, as the hull self-adjusts to volatility clusters rather than applying a one-size-fits-all scale.
How it works (technical)
The indicator first computes two EMAs from close prices using lengths derived from a preset pair or manual inputs, establishing a midline as their average. This midline serves as the central reference for the hull. True range values are then smoothed into multiple ATR candidates using exponential weighting over the specified lengths. For each candidate, deviations of recent highs and lows from the midline are ratioed against the ATR to determine a required multiplier that would enclose all extremes in the containment window—the highest ratio plus padding sets the base, clamped to user-defined bounds. Among valid candidates (those with sufficient history), the one yielding the narrowest overall band width is selected. The hull boundaries are then offset from the midline by this multiplier times the chosen ATR, and further smoothed with a fixed EMA to reduce jitter. Regime direction from EMA comparison gates which boundary acts as support or resistance, with initialization seeding arrays on the first bar to handle state persistence. No higher timeframe data is used, so all logic runs on the chart's native bars without lookahead.
Parameter Guide
EMA Pair — Selects preset lengths for fast and slow EMAs, influencing regime sensitivity and midline stability. Default: "21/55". Trade-offs/Tips: Faster pairs like "9/21" increase cross frequency for scalping but raise false signals; slower like "50/200" smooths for swings, potentially missing early turns. Use Manual for fine control.
Manual Fast — Sets fast EMA length when Manual mode is active; shorter values make regime switches quicker. Default: 21. Trade-offs/Tips: Lower than 10 risks over-reactivity; pair with slow at least double for clear separation.
Manual Slow — Sets slow EMA length when Manual mode is active; longer values anchor the midline more firmly. Default: 55. Trade-offs/Tips: Above 100 adds lag in trends; balance with fast to avoid perpetual neutrality.
ATR Lengths (comma-separated) — Defines candidate periods for ATR smoothing; more options allow finer auto-selection. Default: "7,10,14,21,28,35". Trade-offs/Tips: Fewer candidates speed computation but may miss optimal fits; keep under 10 for efficiency.
Containment Window — Number of recent bars the hull must fully enclose highs/lows of; larger windows favor stability. Default: 50. Trade-offs/Tips: Shorter (under 20) adapts faster to breaks but increases breach risk; longer smooths but delays response.
Min Multiplier Floor — Lowest allowed multiplier for hull width; prevents overly tight bands in low volatility. Default: 0.5. Trade-offs/Tips: Raise to 0.75 for conservative enclosures; too low allows pinches that flip easily.
Max Multiplier Cap — Highest allowed multiplier; caps expansion in spikes to avoid wide, lagging bands. Default: 1.0. Trade-offs/Tips: Lower to 0.75 tightens overall; higher permits more room but risks detachment from price.
Padding (+) — Adds buffer to the auto-multiplier for safer containment without exact touches. Default: 0.05. Trade-offs/Tips: Increase to 0.10 in gappy markets; minimal values hug closer but may still breach on outliers.
Fill Between (Mid ↔ Supertrend) — Toggles shaded area between midline and active hull for trend visualization. Default: true. Trade-offs/Tips: Disable for cleaner charts; pairs well with transparency tweaks.
Base Fill Transparency (0..100) — Sets default opacity of fills; higher values make them subtler. Default: 80. Trade-offs/Tips: Under 50 overwhelms price action; adjust with darken boost for emphasis.
Darken on Trend Change — Enables temporary opacity increase after regime shifts to spotlight transitions. Default: true. Trade-offs/Tips: Off for steady visuals; on aids spotting reversals in real-time.
Darken Fade Bars — Duration in bars for the darken effect to ramp back to base; longer prolongs highlight. Default: 8. Trade-offs/Tips: Shorter (4-6) for fast-paced charts; longer holds attention on changes.
Darken Boost at Change (Δ transp) — Intensity of opacity reduction at crossover; higher values make shifts more prominent. Default: 50. Trade-offs/Tips: Cap at 70 to avoid blackout; tune down if fades obscure details.
Show Supertrend Line — Displays the active hull boundary as a line. Default: true. Trade-offs/Tips: Hide for fill-only views; linewidth fixed at 3 for visibility.
Show EMA Cross Markers — Places circles and labels at crossover points for entry cues. Default: true. Trade-offs/Tips: Disable in clutter; labels show "Buy"/"Sell" at absolute positions.
Alert: EMA Cross Up (Long) — Triggers notification on bullish crossover. Default: true. Trade-offs/Tips: Pair with filters; once-per-bar frequency.
Alert: EMA Cross Down (Short) — Triggers notification on bearish crossover. Default: true. Trade-offs/Tips: Use for exits; ensure broker integration.
Show Debug — Reveals internal diagnostics like selected ATR details (if implemented). Default: false. Trade-offs/Tips: Enable for troubleshooting selections; minimal overhead.
Reading & Interpretation
Bullish regime shows a green line below price as support, with upward fill from midline; bearish uses red line above as resistance, downward fill. Crossovers flip the active boundary, marked by tiny green/red circles and "Buy"/"Sell" labels at the hull level. Fills start at base transparency but darken sharply at changes, fading over the specified bars to signal fresh momentum. If the hull rarely breaches during trends, containment is effective; frequent touches without flips indicate tight adaptation. Debug mode (when enabled) overlays text or plots for selected length and multiplier, helping verify auto-choices.
Practical Workflows & Combinations
- Trend following: Enter long on green "Buy" label above prior low structure; confirm with higher high. Trail stops along the green hull line, tightening as fills stabilize post-fade.
- Exits/Stops: Conservative exit on opposite crossover or hull breach; aggressive hold until fade completes if volume supports. Use darken boost as a volatility cue—high delta suggests waiting for confirmation.
- Multi-asset/Multi-TF: Defaults suit forex/stocks on 15m-4h; for crypto, widen containment to 75 for gaps. Layer on volume oscillator for cross filters; avoid on low-liquidity assets where ATR candidates skew.
Behavior, Constraints & Performance
Closed-bar logic ensures signals confirm at bar end, with live bars updating hull adaptively but no repaints since no future data or security calls are used. Arrays persist ATR states across bars, initialized once with candidates parsed from string. Small fixed loops (over 6 lengths max, inner up to 50) run per bar, capped by max_bars_back=500 for history needs. Resources stay low with 500 labels/lines limits, but dense charts may hit on markers. Known limits include initial lag until containment history builds (50+ bars), potential wide bands on gaps, and suboptimal selections if candidates omit ideal lengths.
Sensible Defaults & Quick Tuning
Start with "21/55" pair, 50-window, 0.5-1.0 multipliers, and 80% transparency for balanced responsiveness on daily charts. For too many flips, raise min floor to 0.75 or add lengths like "42"; for sluggishness, shorten window to 30 or pick faster pair. In high-vol environments, boost padding to 0.10; for smoother visuals, extend fade bars to 12.
What this indicator is—and isn’t
This is a visualization and signal layer for trend regime and adaptive boundaries, aiding entry/exit timing in directional markets. It is not a standalone system—pair with price structure, risk sizing, and broader context. Not predictive of turns, just reactive to containment and crosses.
Disclaimer
The content provided, including all code and materials, is strictly for educational and informational purposes only. It is not intended as, and should not be interpreted as, financial advice, a recommendation to buy or sell any financial instrument, or an offer of any financial product or service. All strategies, tools, and examples discussed are provided for illustrative purposes to demonstrate coding techniques and the functionality of Pine Script within a trading context.
Any results from strategies or tools provided are hypothetical, and past performance is not indicative of future results. Trading and investing involve high risk, including the potential loss of principal, and may not be suitable for all individuals. Before making any trading decisions, please consult with a qualified financial professional to understand the risks involved.
By using this script, you acknowledge and agree that any trading decisions are made solely at your discretion and risk.
Do not use this indicator on Heikin-Ashi, Renko, Kagi, Point-and-Figure, or Range charts, as these chart types can produce unrealistic results for signal markers and alerts.
Happy trading
Chervolino

Alma SD SuperTrend | OquantAlma SD SuperTrend | Oquant
The "Alma SD SuperTrend | Oquant" is a trend-following indicator that integrates the Arnaud Legoux Moving Average (ALMA) with a SuperTrend calculation based on standard deviation (SD). Designed to quickly identify and follow market trends while reducing noise, this script provides buy and sell signals for traders across various assets and timeframes.
This script offers a unique approach by combining ALMA with a SuperTrend framework that uses standard deviation instead of the traditional Average True Range (ATR). This implementation focuses on fast trend detection with minimized noise, making it suitable for trend-following or swing trading strategies. The script’s customizable parameters allow traders to adapt it to their preferred trading style.
How It Works
Arnaud Legoux Moving Average (ALMA): ALMA is an advanced moving average that applies a Gaussian filter to smooth price data, reducing market noise while preserving responsiveness to price changes. It uses three parameters:
Length: Sets the lookback period for smoothing. Longer periods produce smoother results.
Offset: Shifts the moving average toward recent prices. Higher offsets emphasize newer data for faster trend detection.
Sigma controls the smoothness and lag of the Alma by adjusting the spread of the Gaussian distribution used in the calculation.
Standard Deviation (SD) Calculation: The script calculates the standard deviation of the price over a specified period to measure volatility. SD measures how much the prices deviate from its mean, offering a statistical perspective on market volatility. This is used to create dynamic upper and lower bands around the ALMA line, adjusted by a user-defined factor. The bands expand in volatile markets and contract in stable conditions, helping in trend detection.
SuperTrend Logic: The script generates a SuperTrend line that dynamically tracks market trends by switching between upper and lower volatility bands based on price movement. Here's how it works:
The SuperTrend line is calculated using the ALMA (Arnaud Legoux Moving Average) as a baseline, with upper and lower bands created by adding and subtracting a multiple(Factor) of the standard deviation (SD) from the ALMA.
When the price moves above the upper band, the SuperTrend line shifts to the lower band, indicating a bullish trend (potential buy signal).
When the price falls below the lower band, the SuperTrend line switches to the upper band, signaling a bearish trend (potential sell signal).
To avoid quick, unreliable changes, this script intelligently adjusts the SuperTrend bands for stability. While the SuperTrend line dynamically follows market movements, it's designed to hold at its previous level if the price doesn't cross a band or confirm a new trend direction. This approach ensures the SuperTrend quickly identifies and follows genuine market trends, providing clear signals while effectively reducing false alerts from short-term price swings.
Differences from Traditional SuperTrend:
Baseline: The traditional SuperTrend typically uses a hl2((high + low)/2)as its baseline, while this script employs ALMA for a smoother, noise-filtered trend foundation.
Volatility Measure: Instead of ATR, this script uses standard deviation to calculate the bands. Standard deviation measures how much the prices vary or spread out from its mean.
Visualization: The script plots the SuperTrend line, colors candles to match the trend, and fills the area between the price and the SuperTrend line for visual clarity, helping traders quickly identify trend direction and strength (green for bullish, purple for bearish).
How to Use It
Add to Chart: Apply the indicator to any market and timeframe.
Interpret Signals:
Green Line and Candles: Bullish trend (price above the SuperTrend line). Consider long entries.
Purple Line and Candles: Bearish trend (price below the SuperTrend line). Consider short entries.
Filled Area: The shaded area between price and the SuperTrend line highlights trend direction(green for bullish, purple for bearish).
Adjust Inputs:
Source: Select the price data to use (e.g., close, open, high, low).
Factor: Adjusts band width. Higher values widen bands, reducing sensitivity.
SD Length: Period for calculating standard deviation. Longer periods smooth volatility.
ALMA Length: Period for ALMA. Longer periods increase smoothness.
Alma Offset: Shift the moving average toward recent or older prices. Higher offsets emphasize newer data for faster trend detection.
ALMA Sigma control the smoothness and lag of the Alma by adjusting the spread of the Gaussian distribution used in the calculation.
Alerts
This indicator includes optional built-in alert conditions that notify you when the signal crosses above 0 (long signal, price above upper band) or below 0 (short signal, price below lower band). Enable these alerts to get timely updates on potential trend shifts without constantly monitoring the chart.
⚠️ Disclaimer: This indicator is intended for educational and informational purposes only. Trading/investing involves risk, and past performance does not guarantee future results. Always test and evaluate indicators/strategies before applying them in live markets. Use at your own risk.

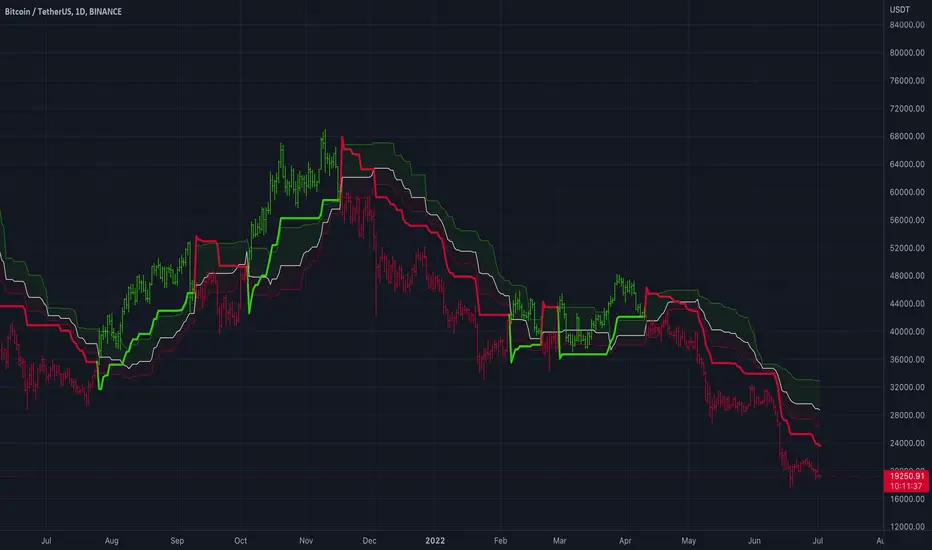
Supertrend (Buy/Sell) With TP & SLSupertrend (Buy/Sell) with TP & SL: An Enhanced Trading Tool
This Pine Script indicator combines the popular Supertrend indicator with multiple take-profit (TP) and stop-loss (SL) levels, providing traders with a comprehensive visual aid for potential entries, exits, and risk management.
Originality
Buffer Zones for Precision: Instead of relying solely on the Supertrend line, this script incorporates buffer zones around it. This helps filter out false signals, especially in volatile markets, leading to more accurate buy/sell signals.
Flexible Stop-Loss: Offers the choice between a fixed or trailing stop-loss, allowing traders to tailor their risk management approach based on their preferences and market conditions.
Multiple Take-Profit Levels: Provides three potential take-profit levels, giving traders the flexibility to secure profits at different stages of a trend.
Heikin Ashi Candles & VWAP: Incorporates Heikin Ashi candles for smoother trend visualization and adds a VWAP line for potential support/resistance levels.
Clear Table Display: Presents key information like Stop Loss and Take Profit levels in a user-friendly table, making it easier to track trade targets.
How It Works
Supertrend Calculation: The Supertrend is calculated using ATR (Average True Range) to gauge market volatility. The script then creates buffer zones around the Supertrend line for refined signal generation.
Buy/Sell Signals:
Buy: When the close price crosses above the upper buffer zone, indicating a potential uptrend.
Sell: When the close price crosses below the lower buffer zone, suggesting a potential downtrend.
Take Profit & Stop Loss:
Take Profits: Three TP levels are calculated based on ATR and a customizable profit factor.
Stop Loss: The stop-loss can be set as either a fixed value based on ATR or as a trailing stop-loss that dynamically adjusts to lock in profits.
How To Use
Add the Indicator: Search for "Supertrend (Buy/Sell) With TP & SL" in the TradingView indicators list and add it to your chart.
Customize Inputs: Adjust parameters like ATR Period, Factor, Take Profit Factor, Stop Loss Factor, Stop Loss Type, etc., based on your trading style and preferences.
Interpret Signals: Look for buy signals when the price crosses above the upper buffer and sell signals when it crosses below the lower buffer.
Manage Risk: Use the plotted Take Profit and Stop Loss levels to manage your risk and potential rewards.
Concepts
Supertrend: A trend-following indicator that helps identify the direction of the prevailing trend.
ATR (Average True Range): A measure of market volatility.
Buffer Zones: Used to filter out false signals by creating a zone around the Supertrend line.
Trailing Stop Loss: A dynamic stop-loss that moves with the price to protect profits.
Heikin Ashi: A type of candlestick chart designed to filter out market noise and make trends easier to identify.
VWAP (Volume Weighted Average Price): An indicator that shows the average price at which a security has traded throughout the day, based on both volume and price.
Important Note: This script is for educational and informational purposes only. Backtest thoroughly and use with caution in live trading. Always manage your risk appropriately.

Mtf Supertrend Table
english
It is a study of how the supertrend indicator looks on multiple timeframes. You can see the Supertrend direction in Multiple Timeframes by looking at the chart
Türkçe
supertrend indikatörünün çoklu zaman dilimdlerinde nasıl göründüğü yönünde bir çalışmadır. Tabloya bakarak Çoklu Zaman dilimlerinde Supertrend yönünü görebilirsiniz

SIDD EMA RSI Supertrend Signal Table🔥 SIDD EMA RSI SuperTrend Multi-Timeframe Signal Table
**SIDD EMA RSI SuperTrend Signal Table** is a **clean, powerful multi-timeframe trend confirmation dashboard** designed for traders who want **clarity, confluence, and speed** — all in one glance.
This indicator **does NOT repaint** and uses **industry-standard trend logic** combining **EMA structure, RSI momentum, and SuperTrend direction** across **6 different timeframes**.
---
## 🧠 Core Logic Behind the Indicator
This script works on **three independent trend engines**, displayed together in a compact table:
### ✅ 1️⃣ EMA Trend (Structure Based)
* Uses **EMA 50 vs EMA 200**
* **Bullish** → EMA 50 above EMA 200
* **Bearish** → EMA 50 below EMA 200
* Captures **primary market structure**
### ✅ 2️⃣ RSI Trend (Momentum Based)
* RSI Length: **14**
* **Bullish** → RSI > **55**
* **Bearish** → RSI ≤ **55**
* Helps confirm **trend strength & momentum**
### ✅ 3️⃣ SuperTrend (Price Action Based)
* ATR Length: **10**
* Factor: **3.0**
* Clearly defines **trend direction & trailing bias**
* Excellent for **entry & exit alignment**
---
## ⏱️ Multi-Timeframe Coverage
The table analyzes trends across **6 configurable timeframes**:
* Intraday → **5m, 15m, 1H**
* Swing → **4H, Daily**
* Positional → **Weekly**
Each timeframe shows:
* 📈 EMA Trend
* 📊 RSI Trend
* 🔁 SuperTrend Direction
Color-coded for instant readability:
* 🟢 Bullish
* 🔴 Bearish
* ⚪ Neutral
---
## 🎯 How to Use This Indicator
✔ **Trend Trading**
Trade only when **EMA + RSI + SuperTrend align** across higher & lower timeframes.
✔ **Intraday Confirmation**
Use higher TF (1H / 4H) bias and take entries on lower TF.
✔ **Avoid Chop & False Signals**
If signals are mixed → market is likely **sideways or risky**.
✔ **Swing & Positional Trades**
Daily + Weekly alignment gives **high-probability setups**.
---
## ⚙️ Customization Options
* Adjustable **timeframes**
* Table **position** (Top/Bottom – Left/Right)
* Table **size** (Extra Small / Small / Normal)
* Custom **colors, borders & text**
* Optimized for **minimal chart clutter**
---
## ⚠️ Disclaimer
This indicator is a **trend confirmation & decision-support tool**.
Always combine with **price action, support/resistance, and proper risk management**.

3 EMA + SupertrendThree EMAs: Helps you identify the general trend direction and potential crossovers.
When the Fast EMA crosses above the Medium or Slow EMAs, it may indicate a bullish trend, and vice versa for bearish trends.
Supertrend: Works as a trend filter. You can use it to identify overall market conditions:
When the Supertrend is green, it indicates an uptrend.
When the Supertrend is red, it indicates a downtrend.
Combination: The EMAs help you confirm the trend, and the Supertrend can act as a filter or confirmation tool for your entries and exits.
Potential Strategy Idea:
Long Entry: When the Fast EMA crosses above the Medium EMA, and the Supertrend is green.
Short Entry: When the Fast EMA crosses below the Medium EMA, and the Supertrend is red.
Exit: You can use either the Supertrend turning from green to red (for long exits) or vice versa.
ADX Supertrend | [DeV]The "ADX Supertrend" indicator is a user-friendly tool that blends two popular trading indicators—the Supertrend and the Average Directional Index (ADX)—to help traders spot trends and make smarter trading decisions. By combining these two, it offers a clearer picture of when a market is trending strongly and in which direction, while cutting down on misleading signals. Here’s a straightforward explanation of how each part works, how they team up, the benefits of using them together, and why the ADX makes the Supertrend even better.
Supertrend:
It's like a guide that follows the market’s price movements to tell you whether prices are trending up or down. It creates two lines, one above and one below the price, based on how much the market is bouncing around (its volatility). When the price moves above the upper line, it signals an uptrend (a good time to buy), and the indicator draws a line below the price to show support. When the price drops below the lower line, it signals a downtrend (a potential time to sell), and the line appears above the price as resistance. The Supertrend is great because it adjusts to market conditions, widening the gap between lines in wild markets and tightening it in calm ones.
Average Directional Index:
The ADX is all about measuring how strong a trend is, without caring whether it’s going up or down. Think of it as a meter that tells you if the market is charging forward with purpose or just drifting aimlessly. It uses a scale from 0 to 100, where higher numbers mean a stronger trend. For example, an ADX above 25 often suggests a solid trend worth paying attention to, while a low ADX signals a sleepy, sideways market. The ADX also looks at whether buyers or sellers are in control to confirm the trend’s direction.
Confluence:
The Supertrend is great at spotting trends, but it can be a bit trigger-happy, giving signals in markets that aren’t really trending. That’s where the ADX shines. It acts like a quality control check, making sure the Supertrend’s signals only count when the market is moving with conviction. By filtering out weak or messy trends, the ADX helps you avoid wasting time on trades that fizzle out. It also double-checks the trend’s direction, so you’re not just guessing whether buyers or sellers are in charge. This teamwork means you get signals that are more reliable and less likely to lead you astray, especially in tricky markets where prices bounce around without a clear path.
Kalman Hull Supertrend [BackQuant]Kalman Hull Supertrend
At its core, this indicator uses a Kalman filter of price, put inside of a hull moving average function (replacing the weighted moving averages) and then using that as a price source for the supertrend instead of the normal hl2 (high+low/2).
Therefore, making it more adaptive to price and also sensitive to recent price action.
PLEASE Read the following, knowing what an indicator does at its core before adding it into a system is pivotal. The core concepts can allow you to include it in a logical and sound manner.
1. What is a Kalman Filter
The Kalman Filter is an algorithm renowned for its efficiency in estimating the states of a linear dynamic system amidst noisy data. It excels in real-time data processing, making it indispensable in fields requiring precise and adaptive filtering, such as aerospace, robotics, and financial market analysis. By leveraging its predictive capabilities, traders can significantly enhance their market analysis, particularly in estimating price movements more accurately.
If you would like this on its own, with a more in-depth description please see our Kalman Price Filter.
2. Hull Moving Average (HMA) and Its Core Calculation
The Hull Moving Average (HMA) improves on traditional moving averages by combining the Weighted Moving Average's (WMA) smoothness and reduced lag. Its core calculation involves taking the WMA of the data set and doubling it, then subtracting the WMA of the full period, followed by applying another WMA on the result over the square root of the period's length. This methodology yields a smoother and more responsive moving average, particularly useful for identifying market trends more rapidly.
3. Combining Kalman Filter with HMA
The innovative combination of the Kalman Filter with the Hull Moving Average (KHMA) offers a unique approach to smoothing price data. By applying the Kalman Filter to the price source before its incorporation into the HMA formula, we enhance the adaptiveness and responsiveness of the moving average. This adaptive smoothing method reduces noise more effectively and adjusts more swiftly to price changes, providing traders with clearer signals for market entries or exits.
The calculation is like so:
KHMA(_src, _length) =>
f_kalman(2 * f_kalman(_src, _length / 2) - f_kalman(_src, _length), math.round(math.sqrt(_length)))
4. Integration with Supertrend
Incorporating this adaptive price smoothing technique into the Supertrend indicator further enhances its efficiency. The Supertrend, known for its proficiency in identifying the prevailing market trend and providing clear buy or sell signals, becomes even more powerful with an adaptive price source. This integration allows the Supertrend to adjust more dynamically to market changes, offering traders more accurate and timely trading signals.
5. Application in a Trading System
In a trading system, the Kalman Hull Supertrend indicator can serve as a critical component for identifying market trends and generating signals for potential entry and exit points. Its adaptiveness and sensitivity to price changes make it particularly useful for traders looking to minimize lag in signal generation and improve the accuracy of their market trend analysis. Whether used as a standalone tool or in conjunction with other indicators, its dynamic nature can significantly enhance trading strategies.
6. Core Calculations and Benefits
The core of this indicator lies in its sophisticated filtering and averaging techniques, starting with the Kalman Filter's predictive adjustments, followed by the adaptive smoothing of the Hull Moving Average, and culminating in the trend-detecting capabilities of the Supertrend. This multi-layered approach not only reduces market noise but also adapts to market volatility more effectively. Benefits include improved signal accuracy, reduced lag, and the ability to discern trend changes more promptly, offering traders a competitive edge.
Thus following all of the key points here are some sample backtests on the 1D Chart
Disclaimer: Backtests are based off past results, and are not indicative of the future.
INDEX:BTCUSD
INDEX:ETHUSD
BINANCE:SOLUSD

Adaptive Supertrend w/ Floating Levels [Loxx]Adaptive Supertrend w/ Floating Levels is a Supertrend indicator made adaptive by comparing the coefficient of determination / average of the least squares. The basic concept is this: use correlation with an r-squared line to adapt the period of the indicator, thereby resulting in a more versatile Supertrend. This adaptive formula makes the Supertrend more reactive to small fluctuation in the market while still doing what it's supposed to do: track trend. In addition, floating levels are drawn above or below the Supertrend which are calculated with percentage of the highest and lowest values of the Supertrend within the last “lookback” period. These floating levels act as filter to detect / prevent false trend reversals. T
What is the Supertrend?
Supertrend indicator was created by Olivier Seban to work on different time frames. It works for futures, forex, and equities. It is used in 15 minutes, hourly, weekly, and daily charts. Based on the parameters of multiplier and period, the indicator normally uses 3 for multiplier and 7 for the ATR period as default values. Average True Range is represented by the number of days while the multiplier is the value by which the range is multiplied.
Included
-Toggle on/off bar coloring
-Toggle on/off adaptivity
-Toggle on/off fill coloring
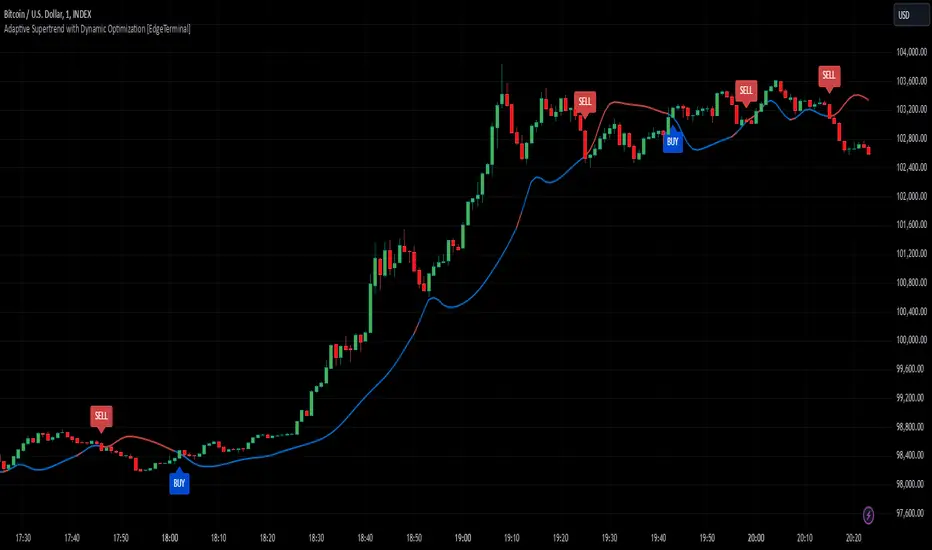
Adaptive Supertrend with Dynamic Optimization [EdgeTerminal]The Enhanced Adaptive Supertrend represents a significant evolution of the traditional Supertrend indicator, incorporating advanced mathematical optimization, dynamic volatility adjustment, intelligent signal filtering, reduced noise and false positives.
Key Features
Dynamic volatility-adjusted bands
Self-optimizing multiplier
Intelligent signal filtering system
Cooldown period to prevent signal clustering
Clear buy/sell signals with optimal positioning
Smooth trend visualization
RSI and MACD integration for confirmation
Performance-based optimization
Dynamic Band Calculation
Dynamic Band Calculation automatically adapts to market volatility, generates wider bands in volatile periods, reducing false signals. It also generates tighter bands in stable periods, capturing smaller moves and smooth transitions between different volatility regimes.
RSI Integration
The RSI and MACD play multiple crucial roles in the Adaptive Supertrend.
It first helps with momentum factor calculation. This dynamically adjusts band width based on momentum conditions. When the RSI is oversold, bands widen by 20% to prevent false signals during strong downtrends and provide more room for price movements in extreme conditions.
When the RSI is overbought, brands tighten by 20% and they become more sensitive to potential reversals to help catch trend changes earlier.
This reduces false signals in strong trends, helps detect potential reversals earlier than the usual, create adaptive band width based on market conditions and finally, better protection against whipsaws.
MACD Integration
The MACD in this supertrend indicator serves as a trend confirmation tool. The idea is to use MACD crossovers to confirm trend changes to reduce false trend change signals and enhance the signal quality.
For this to become a signal, MACD crossovers must align with price movement to help filter out weak or false signals, which acts as an additional layer of trend confirmation.
Additionally, MACD line position relative to signal line indicates trend strength, helps maintain positions in strong trends and assists in early detection of trend weakening.
Momentum Integration
Momentum Integration prevents false signals in extreme conditions, It adjusts dynamic bands based on market momentum, improves trend confirmation in strong moves and reduces whipsaws during consolidations.
Improved signals
There are a few systems to generate better signals, allowing for generally faster signals compared to original supertrend, such as:
Enforced cooldown period between signals
Prevents signal clustering
Clearer entry/exit points
Reduced false signals during choppy markets
Performance Optimization
This script implements a Sharpe ratio-inspired optimization algorithm to balance returns against risk, penalize large drawdowns, adapt parameters in real-time and improve risk-adjusted performance
Parameter Settings
ATR Period: 10 (default) - adjust based on timeframe
Initial Multiplier: 3.0 (default) - will self-optimize
Optimization Period: 50 (default) - longer periods for more stability
Smoothing Period: 3 (default) - adjust for signal smoothness
Best Practices
Use on multiple timeframes for confirmation
Allow the optimization process to run for at least 50 bars
Monitor the adaptive multiplier for trend strength indication
Consider RSI and MACD alignment for stronger signals
Adoptive Supertrend - BandsAnother adoption of supertrend. This time based on different channels - Bollinger Band, Keltner Channel, Donchian Channel and Pivot point based Donchian channel.
When price hits top of bands, it is considered as start or continuation of uptrend. When price hits bottom of the band it is considered as start or continuation of downtrend. Hence, supertrend is drawn based on these calculations. Use ATR Periods and ATR Multiplier to create stops certain ATR away from band's top and bottom.
Other supertrend adoptions published are here:
Pivot point based donchian channel is published here:
ZigZag SupertrendBack to my favourite supertrend. But, this time on the basis of zigzag pivots.
This is similar to forming supertrend based on pivot high lows - but instead of using pivot poitns, we are using zigzag pivots here.
Zigzag is derived using the same method as this script:
But, have removed labels and display options of zigzag. Older lines are also immediately deleted so that it can work well in lower timeframes without any error. Number of zigzaglines to be kept in memory depends on the parameter History
WaitForConfirmation option when selected only considers the confirmed zigzaglines and will ignore present zigzag line which is forming. This is not going to make much difference as the present zigzag line will be always opposite to low or high it formed and hence will not affect the stop loss levels or reversals.
WaitForClose is for supertrend determination. When checked uses close prices. If unchecked uses highs and lows for supertrend direction update.
ATR parameters allow you to set an adjustment below pivot high lows. This is required because support and resistence are often zones rather than single point. Hence, adds bit more wiggle room for trend continuation and delays frequent reversals on pullbacks.

Concept Dual SuperTrendSimple SuperTrend indicator giving you the option to display two SuperTrends on a single script plus additional customization features. Dual setup inspired by Income Sharks 🦈

Multi Supertrend with no-repaint and HTF optionThis indicator has 2 Supertrends to filter the trend.
The Default one uses the same timeframe as chart.
The additional Supertrend is non-repaint type and can run on higher timeframes.
It has an auto-higher timeframe selection option, thanks to LonesomeTheBlue, the original author.
It is accurate on current timeframe also.
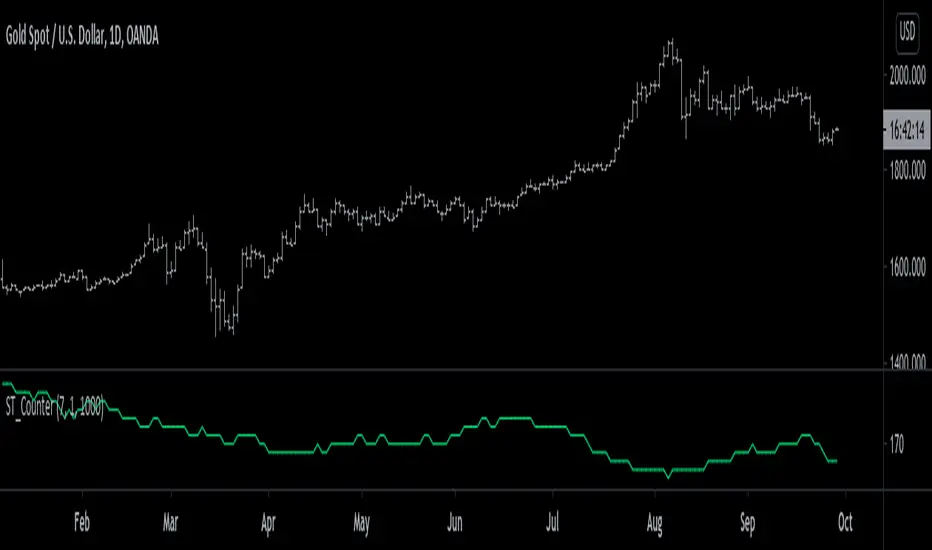
SuperTrend Counter [racer8]SuperTrend Counter counts the number of signals SuperTrend has produced over a defined lookback period. It may be useful if you want to backtest SuperTrend. If so, this is the perfect indicator for you. Special thanks to everget, I used part of his SuperTrend indicator. Enjoy ;)
Multilevel ZigZag SupertrendVery much similar to :
I have slightly changed code to accommodate multiple zigzags. Also removed possibility of external source to keep it simple.
Indicator shows 2 Level zigzag based supertrends. Second zigzag used is multi level zigzag and hence, this acts as higher timeframe filter and can be considered as overall trend bias.
3 SuperTrends + ATR SL + 3 EMAsHere I have assembled 3 indicators, SuperTrend + ATR + Ema, to make them fit into one indicator to make things more organized and to save space. Check Script for original Authors of the used scripts. The UI or the indicator is far from perfect as my programming skills are very low :D

[RS]Supertrend GridDynamic grid system based on supertrend.
note: the input nlines/nfractions are not locked so if values too high might start overlapping line objects.
Supertrend Crosses_AITSupertrend Crosser
Overview:
The "Supertrend Crosses" indicator is a technical analysis tool that combines two Supertrend lines with different parameters to generate buy and sell signals based on their crossovers. The indicator uses color coding to visualize the market trend and provides alerts for potential trade entries.
1. Settings and Inputs:
Supertrend A:
Factor: Multiplier for the ATR (Average True Range), which determines the sensitivity of Supertrend A.
ATR Period: Number of periods used to calculate the ATR for Supertrend A.
Supertrend B:
Factor: Multiplier for the ATR, which determines the sensitivity of Supertrend B.
ATR Period: Number of periods used to calculate the ATR for Supertrend B.
2. Indicator Components:
Supertrend A:
Plotted on the chart using dynamic coloring:
Green when Supertrend A is above Supertrend B.
Red when Supertrend A is below Supertrend B.
Supertrend B:
Plotted on the chart in white color to provide a visual reference for the crossover signals.
3. Crossover Signals:
Long Signal:
Triggered when Supertrend A crosses above Supertrend B.
A yellow upward triangle ("L") is displayed on the chart below the price bar.
Short Signal:
Triggered when Supertrend A crosses below Supertrend B.
A fuchsia downward triangle ("S") is displayed on the chart above the price bar.
4. How to Use the Indicator:
Identifying Trend Changes:
When Supertrend A crosses above Supertrend B, it indicates a potential upward trend, generating a buy signal.
Conversely, when Supertrend A crosses below Supertrend B, it suggests a potential downward trend, generating a sell signal.
Signal Visualization:
Yellow "L" markers indicate long entry points (buy signals).
Fuchsia "S" markers indicate short entry points (sell signals).
Alerts:
The indicator is equipped with alert conditions for both long and short signals. Users can set up alerts in TradingView to receive notifications when these signals occur.
5. Customization:
Supertrend Parameters:
The factors and ATR periods for Supertrend A and B can be adjusted in the settings to fit different market conditions and trading strategies.
Show Signals Option:
The user can toggle the display of the buy and sell signals on the chart through the "Show Signals?" checkbox in the settings.
6. Visual Representation:
Lines:
Supertrend A: Plotted with dynamic coloring based on its relation to Supertrend B.
Supertrend B: Plotted in white for a clear reference.
Markers:
"L" (yellow) for long signals and "S" (fuchsia) for short signals are plotted on the chart at the point of crossover.
7. Alerts Setup:
Buy Signal Alert: Alerts the user when Supertrend A crosses above Supertrend B.
Sell Signal Alert: Alerts the user when Supertrend A crosses below Supertrend B.
8. Advantages:
Simple and Effective: This indicator simplifies trend identification by using crossovers of two Supertrend lines.
Customizable: The indicator's parameters can be tailored to suit different trading styles and asset classes.
Alerts: Provides alert functionality to ensure traders do not miss trading opportunities.
9. Usage Tips:
Combine with Other Indicators: For more reliable signals, consider using this indicator in conjunction with other technical analysis tools like RSI, MACD, or support and resistance levels.
Risk Management: Always use appropriate risk management techniques, such as stop-loss orders, to protect your capital.
The "Supertrend Crosses" indicator offers a straightforward approach to identifying potential trend reversals and trade entries using the crossover of two Supertrend lines. It provides clear visual signals and alert notifications, making it a valuable tool for traders looking to incorporate trend-following strategies.
SuperTrend Cyan — Split ST & Triple Bands (A/B/C)SuperTrend Cyan — Split ST & Triple Bands (A/B/C)
✨ Concept:
The SuperTrend Cyan indicator expands the classical SuperTrend logic into a split-line + triple-band visualization for clearer structure and volatility mapping.
Instead of a single ATR-based line, this tool separates SuperTrend direction from volatility envelopes (A/B/C), providing a layered view of both regime and range compression.
✨ The design goal:
Preserve the simplicity of SuperTrend
Add volatility context via multi-band envelopes
Provide a compact MTF (Multi-Timeframe) summary for broader trend alignment
✨ How It Works
1. SuperTrend Core (Active & Opposite Lines)
Uses ATR-based bands (Factor × ATR-Length).
Active SuperTrend is plotted according to current regime.
Opposite SuperTrend (optional) shows potential reversal threshold.
2. Triple Band System (A/B/C)
Each band (A, B, C) scales from the median price (hl2) by different ATR multipliers.
A: Outer band (wider, long-range context)
B: Inner band (mid-range activity)
C: Core band (closest to price, short-term compression)
Smoothness can be controlled with EMA.
Uptrend fills are lime-toned, downtrend fills are red-toned, with adjustable opacity (gap intensity).
3. Automatic Directional Switch
When the regime flips from up → down (or vice versa), the overlay automatically switches between lower and upper bands for a clean transition.
4. Multi-Timeframe SuperTrend Table
Displays SuperTrend direction across 5m, 15m, 1h, 4h, and 1D frames.
Green ▲ = Uptrend, Red ▼ = Downtrend.
Useful for checking cross-timeframe trend alignment.
✨ How to Read It
Green SuperTrend + Lime Bands
- Uptrend regime; volatility expanding upward
Red SuperTrend + Red Bands
- Downtrend regime; volatility expanding downward
Narrow gaps (A–C)
- Low volatility / compression (potential squeeze)
Wide gaps
- High volatility / active trend phase
Opposite ST line close to price
- Early warning for regime transition
✨ Practical Use
Identify trend direction (SuperTrend color & line position).
Assess volatility conditions (band width and gap transparency).
Watch for MTF alignment: consistent up/down signals across 1h–4h–1D = strong structural trend.
Combine with momentum indicators (e.g., RSI, DFI, PCI) for confirmation of trend maturity or exhaustion.
✨ Customization Tips
ST Factor / ATR Length
- Adjust sensitivity of SuperTrend direction changes
Band ATR Length
- Controls overall smoothness of volatility envelopes
Band Multipliers (A/B/C)
- Define how wide each volatility band extends
Gap Opacity
- Affects visual contrast between layers
MTF Table
- Enable/disable multi-timeframe display
✨ Educational Value
This script visualizes the interaction between trend direction (SuperTrend) and volatility envelopes, helping traders understand how price reacts within layered ATR zones.
It also introduces a clean MTF (multi-timeframe) perspective — ideal for discretionary and system traders alike.
✨ Disclaimer
This indicator is provided for educational and research purposes only.
It does not constitute financial advice or a trading signal.
Use at your own discretion and always confirm with additional tools.
───────────────────────────────
📘 한국어 설명 (Korean translation below)
───────────────────────────────
✨개념
SuperTrend Cyan 지표는 기존의 SuperTrend를 확장하여,
추세선 분리(Split Line) + 3중 밴드 시스템(Triple Bands) 으로
시장의 구조적 흐름과 변동성 범위를 동시에 시각화합니다.
단순한 SuperTrend의 강점을 유지하면서도,
ATR 기반의 A/B/C 밴드를 통해 변동성 압축·확장 구간을 직관적으로 파악할 수 있습니다.
✨ 작동 방식
1. SuperTrend 코어 (활성/반대 라인)
ATR×Factor를 기반으로 추세선을 계산합니다.
현재 추세 방향에 따라 활성 라인이 표시되고, “Show Opposite” 옵션을 켜면 반대편 경계선도 함께 보입니다.
2. 트리플 밴드 시스템 (A/B/C)
hl2(중간값)를 기준으로 ATR 배수에 따라 세 개의 밴드를 계산합니다.
A: 외곽 밴드 (가장 넓고 장기 구조 반영)
B: 중간 밴드 (중기적 움직임)
C: 코어 밴드 (가격에 가장 근접, 단기 변동성 반영)
EMA 스무딩으로 부드럽게 조정 가능.
업트렌드 구간은 라임색, 다운트렌드는 빨간색 음영으로 표시됩니다.
3. 자동 전환 시스템
추세가 전환될 때(Up ↔ Down), 밴드 오버레이도 자동으로 교체되어 깔끔한 시각적 구조를 유지합니다.
4. MTF SuperTrend 테이블
5m / 15m / 1h / 4h / 1D 프레임별 SuperTrend 방향을 표시합니다.
초록 ▲ = 상승, 빨강 ▼ = 하락.
복수 타임프레임 정렬 확인용으로 유용합니다.
✨ 해석 방법
초록 SuperTrend + 라임 밴드
- 상승 추세 및 확장 구간
빨강 SuperTrend + 레드 밴드
- 하락 추세 및 확장 구간
밴드 폭이 좁음
- 변동성 축소 (스퀴즈)
밴드 폭이 넓음
- 변동성 확장, 추세 강화
반대선이 근접
- 추세 전환 가능성 높음
✨ 활용 방법
SuperTrend 색상으로 추세 방향을 확인
A/B/C 밴드 폭으로 변동성 수준을 판단
MTF 테이블을 통해 복수 타임프레임 정렬 여부 확인
RSI, DFI, PCI 등 다른 지표와 함께 활용 시, 추세 피로·모멘텀 변화를 조기에 파악 가능
✨ 교육적 가치
이 스크립트는 추세 구조(SuperTrend) 와 변동성 레이어(ATR Bands) 의 상호작용을
시각적으로 학습하기 위한 교육용 지표입니다.
또한, MTF 구조를 통해 시장의 “위계적 정렬(hierarchical alignment)”을 쉽게 인식할 수 있습니다.
✨ 면책
이 지표는 교육 및 연구 목적으로만 제공됩니다.
투자 판단의 책임은 사용자 본인에게 있으며, 본 지표는 매매 신호를 보장하지 않습니다.
