Premarket High/Low Label (Single Line)it shows you what the premarket high low label is on a single line, saving you the hassale of fidning it yourself. :) hope it helps.
Statistics
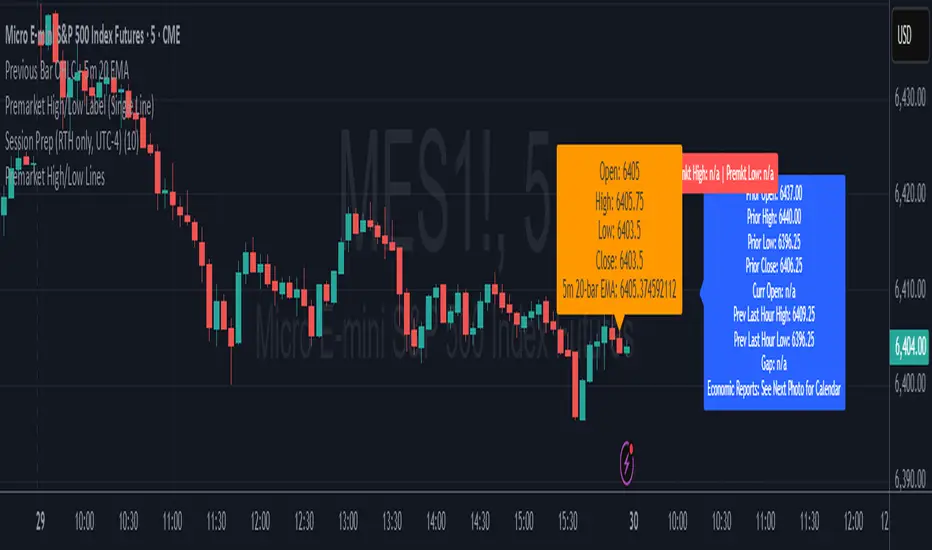
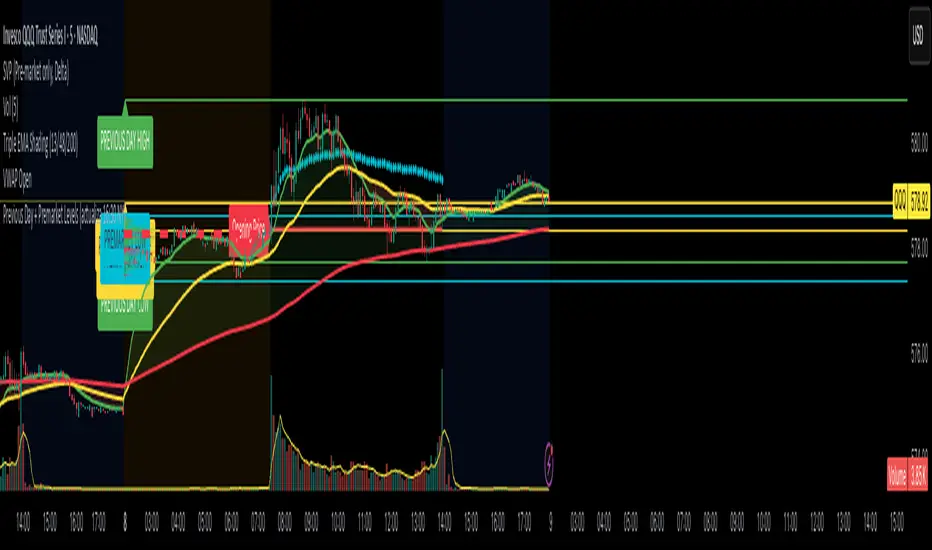
Previous Day Levels (High, Low, Open, Close)This TradingView Pine Script indicator plots the previous day’s price levels (High, Low, Open, and Close) as horizontal rays that extend across the current trading day.
Green lines mark the Previous Day High and Previous Day Low.
Yellow lines mark the Previous Day Open and Previous Day Close.
Labels are automatically displayed at the right edge of the chart, positioned above each line, making it easy to identify the corresponding level in real time.
The levels are updated daily and always begin at the start of the current day, ensuring that they cover the entire intraday session.
This tool helps traders quickly visualize key support and resistance levels from the previous trading day and incorporate them into intraday strategies.
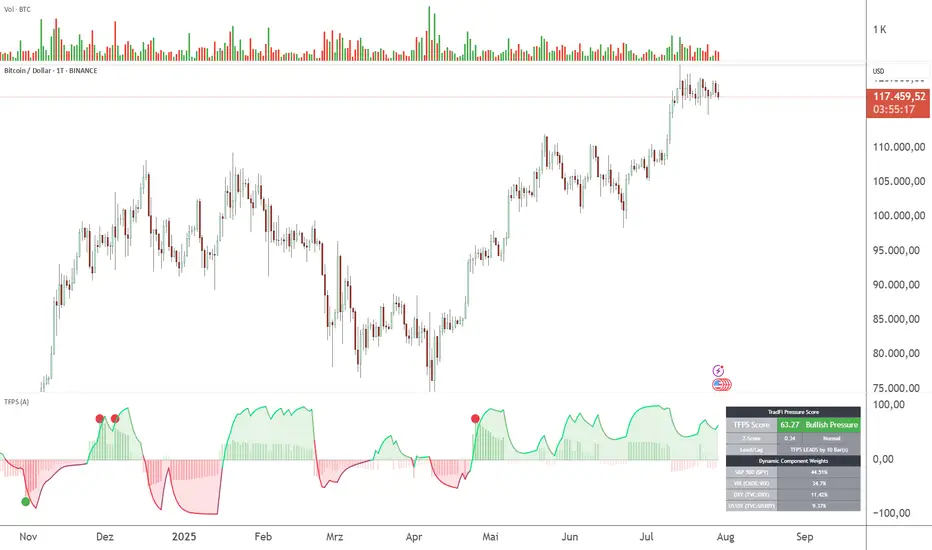
TFPS - TradFi-Pressure-Score (Adaptive)The data-driven answer to an irreversible market reality.
This indicator quantifies the combined pressure from the S&P 500, VIX, DXY, and US10Y, whose correlation to crypto has reached peak values of 0.87. Your decisive macro edge, in real-time.
This indicator is built on a fundamental analysis of market data from the last five years. The analysis proves an irreversible transformation: The crypto market has evolved into a high-beta risk asset, its fate inextricably linked to Traditional Finance (TradFi).
The empirical data is clear:
Bitcoin increasingly behaves like a leveraged version of the S&P 500.
The correlation to stock indices, with peak values of up to 0.87, is statistically highly significant.
The "digital gold" safe-haven narrative is refuted by the data; the correlation to gold (0.04) is virtually non-existent and statistically insignificant.
This means: Standard indicators like RSI or MACD are insufficient for today's market conditions. They only see price, ignoring the powerful external context that now dominates price action.
The TradFi Pressure Score (TFPS) is the answer to this data-driven reality. It's your institutional-grade macro dashboard, aggregating the four most dominant external forces into a single, actionable score:
S&P 500 (SPY): The pulse of global risk appetite. A rising S&P signals a "risk-on" environment, fueling capital flows into crypto.
VIX: The market's "Fear Gauge". A rising VIX signals a "risk-off" flight to safety, draining liquidity from crypto.
DXY (US-Dollar Index): The counter-pole to risk assets. A strong Dollar (rising DXY) tightens global liquidity, creating significant headwinds for Bitcoin.
US 10Y Yield: The opportunity cost of capital. Rising yields make risk-free assets more attractive, pulling capital away from non-yielding assets like crypto.
What makes TFPS truly unique?
Dynamic Weighting (its secret weapon): Which factor matters most today? The DXY or the VIX? TFPS continuously analyzes the correlation of all four factors to your chosen asset (e.g., Bitcoin) and automatically adjusts their weight in real-time. This ensures you're always focused on what's currently driving the market.
Adaptive Engine : What drives a 15-minute chart is different from a daily chart. The TFPS engine automatically adapts its lookback periods and calculations to your chosen timeframe for optimal relevance.
Clear, Actionable Signals Designed for Traders:
Pressure Line (>0 or <0): Instantly see if the world's largest financial forces are providing a tailwind or a headwind for your trade.
Z-Score (Extreme Readings) : Get early warnings of extreme macro "Greed" or "Fear". Readings above +2 or below -2 have historically pinpointed moments of market exhaustion that often precede major trend reversals.
Regime Change : A fundamental shift in the nature of TradFi pressure is visualized with a clear signal, providing unambiguous macro insights.
Lead/Lag Status : Gain a critical edge by knowing who's in the driver's seat. The dashboard tells you if TradFi is LEADING the price action or if crypto is moving independently, allowing you to focus on the right information source.
This is a private beta. I am granting exclusive access to a limited number of traders who understand this new market reality. In exchange for your valuable feedback, you will be among the first to leverage what I believe is the new standard for macro analysis in crypto trading.
Request access to trade with the full context.
Volume Footprint Anomaly Scanner [PhenLabs]📊 PhenLabs - Volume Footprint Anomaly Scanner (VFAS)
Version: PineScript™ v6
📌 Description
The PhenLabs Volume Footprint Anomaly Scanner (VFAS) is an advanced Pine Script indicator designed to detect and highlight significant imbalances in buying and selling pressure within individual price bars. By analyzing a calculated "Delta" – the net difference between estimated buy and sell volume – and employing statistical Z-score analysis, VFAS pinpoints moments when buying or selling activity becomes unusually dominant. This script was created not in hopes of creating a "Buy and Sell" indicator but rather providing the user with a more in-depth insight into the intrabar volume delta and how it can fluctuate in unusual ways, leading to anomalies that can be capitalized on.
This indicator helps traders identify high-conviction points where strong market participants are active, signaling potential shifts in momentum or continuation of a trend. It aims to provide a clearer understanding of underlying market dynamics, allowing for more informed decision-making in various trading strategies, from identifying entry points to confirming trend strength.
🚀 Points of Innovation
● Z-Score for Delta Analysis : Utilizes statistical Z-scores to objectively identify statistically significant anomalies in buying/selling pressure, moving beyond simple, arbitrary thresholds.
● Dynamic Confidence Scoring : Assigns a multi-star confidence rating (1-4 stars) to each signal, factoring in high volume, trend alignment, and specific confirmation criteria, providing a nuanced view of signal strength.
● Integrated Trend Filtering : Offers an optional Exponential Moving Average (EMA)-based trend filter to ensure signals align with the broader market direction, reducing false positives in ranging markets.
● Strict Confirmation Logic : Implements specific confirmation criteria for higher-confidence signals, including price action and a time-based gap from previous signals, enhancing reliability.
● Intuitive Info Dashboard : Provides a real-time summary of market trend and the latest signal's direction and confidence directly on the chart, streamlining information access.
🔧 Core Components
● Core Delta Engine : Estimates the net buying/selling pressure (bar Delta) by analyzing price movement within each bar relative to volume. It also calculates average volume to identify bars with unusually high activity.
● Anomaly Detection (Z-Score) : Computes the Z-score for the current bar's Delta, indicating how many standard deviations it is from its recent average. This statistical measure is central to identifying significant anomalies.
● Trend Filter : Utilizes a dual Exponential Moving Average (EMA) cross-over system to define the prevailing market trend (uptrend, downtrend, or range), providing contextual awareness.
● Signal Processing & Confidence Algorithm : Evaluates anomaly conditions against trend filters and confirmation rules, then calculates a dynamic confidence score to produce actionable, contextualized signal information.
🔥 Key Features
● Advanced Delta Anomaly Detection : Pinpoints bars with exceptionally high buying or selling pressure, indicating potential institutional activity or strong market conviction.
● Multi-Factor Confidence Scoring : Each signal comes with a 1-4 star rating, clearly communicating its reliability based on high volume, trend alignment, and specific confirmation criteria.
● Optional Trend Alignment : Users can choose to filter signals, so only those aligned with the prevailing EMA-defined trend are displayed, enhancing signal quality.
● Interactive Signal Labels : Displays compact labels on the chart at anomaly points, offering detailed tooltips upon hover, including signal type, direction, confidence, and contextual information.
● Customizable Bar Colors : Visually highlights bars with Delta anomalies, providing an immediate visual cue for strong buying or selling activity.
● Real-time Info Dashboard : A clean, customizable dashboard shows the current market trend and details of the latest detected signal, keeping key information accessible at a glance.
● Configurable Alerts : Set up alerts for bullish or bearish Delta anomalies to receive real-time notifications when significant market pressure shifts occur.
🎨 Visualization
Signal Labels :
* Placed at the top/bottom of anomaly bars, showing a "📈" (bullish) or "📉" (bearish) icon.
* Tooltip: Hovering over a label reveals detailed information: Signal Type (e.g., "Delta Anomaly"), Direction, Confidence (e.g., "★★★☆"), and a descriptive explanation of the anomaly.
* Interpretation: Clearly marks actionable signals and provides deep insights without cluttering the chart, enabling quick assessment of signal strength and context.
● Info Dashboard :
* Located at the top-right of the chart, providing a clean summary.
* Displays: "PhenLabs - VFAS" header, "Market Trend" (Uptrend/Downtrend/Range with color-coded status), and "Direction | Conf." (showing the last signal's direction and star confidence).
* Optional "💡 Hover over signals for details" reminder.
* Interpretation: A concise, real-time summary of the market's pulse and the most recent high-conviction event, helping traders stay informed at a glance.
📖 Usage Guidelines
Setting Categories
⚙️ Core Delta & Volume Engine
● Minimum Volume Lookback (Bars)
○ Default: 9
○ Range: Integer (e.g., 5-50)
○ Description: Defines the number of preceding bars used to calculate the average volume and delta. Bars with volume below this average won't be considered for high-volume signals. A shorter lookback is more reactive to recent changes, while a longer one provides a smoother average.
📈 Anomaly Detection Settings
Delta Z-Score Anomaly Threshold
○ Default: 2.5
○ Range: Float (e.g., 1.0-5.0+)
○ Description: The number of standard deviations from the mean that a bar's delta must exceed to be considered a significant anomaly. A higher threshold means fewer, but potentially stronger, signals. A lower threshold will generate more signals, which might include less significant events. Experiment to find the optimal balance for your trading style.
🔬 Context Filters
Enable Trend Filter
○ Default: False
○ Range: Boolean (True/False)
○ Description: When enabled, signals will only be generated if they align with the current market trend as determined by the EMAs (e.g., only bullish signals in an uptrend, bearish in a downtrend). This helps to filter out counter-trend noise.
● Trend EMA Fast
○ Default: 50
○ Range: Integer (e.g., 10-100)
○ Description: The period for the faster Exponential Moving Average used in the trend filter. In combination with the slow EMA, it defines the trend direction.
● Trend EMA Slow
○ Default: 200
○ Range: Integer (e.g., 100-400)
○ Description: The period for the slower Exponential Moving Average used in the trend filter. The relationship between the fast and slow EMA determines if the market is in an uptrend (fast > slow) or downtrend (fast < slow).
🎨 Visual & UI Settings
● Show Info Dashboard
○ Default: True
○ Range: Boolean (True/False)
○ Description: Toggles the visibility of the dashboard on the chart, which provides a summary of market trend and the last detected signal.
● Show Dashboard Tooltip
○ Default: True
○ Range: Boolean (True/False)
○ Description: Toggles a reminder message in the dashboard to hover over signal labels for more detailed information.
● Show Delta Anomaly Bar Colors
○ Default: True
○ Range: Boolean (True/False)
○ Description: Enables or disables the coloring of bars based on their delta direction and whether they represent a significant anomaly.
● Show Signal Labels
○ Default: True
○ Range: Boolean (True/False)
○ Description: Controls the visibility of the “📈” or “📉” labels that appear on the chart when a delta anomaly signal is generated.
🔔 Alert Settings
Alert on Delta Anomaly
○ Default: True
○ Range: Boolean (True/False)
○ Description: When enabled, this setting allows you to set up alerts in TradingView that will trigger whenever a new bullish or bearish delta anomaly is detected.
✅ Best Use Cases
Early Trend Reversal / Continuation Detection: Identify strong surges of buying/selling pressure at key support/resistance levels that could indicate a reversal or the continuation of a strong move.
● Confirmation of Breakouts: Use high-confidence delta anomalies to confirm the validity of price breakouts, indicating strong conviction behind the move.
● Entry and Exit Points: Pinpoint precise entry opportunities when anomalies align with your trading strategy, or identify potential exhaustion signals for exiting trades.
● Scalping and Day Trading: The indicator’s sensitivity to intraday buying/selling imbalances makes it highly effective for short-term trading strategies.
● Market Sentiment Analysis: Gain a real-time understanding of underlying market sentiment by observing the prevalence and strength of bullish vs. bearish anomalies.
⚠️ Limitations
Estimated Delta: The script uses a simplified method to estimate delta based on bar close relative to its range, not actual order book or footprint data. While effective, it’s an approximation.
● Sensitivity to Z-Score Threshold: The effectiveness heavily relies on the `Delta Z-Score Anomaly Threshold`. Too low, and you’ll get many false positives; too high, and you might miss valid signals.
● Confirmation Criteria: The 4-star confidence level’s “confirmation” relies on specific subsequent bar conditions and previous confirmed signals, which might be too strict or specific for all contexts.
● Requires Context: While powerful, VFAS is best used in conjunction with other technical analysis tools and price action to form a comprehensive trading strategy. It is not a standalone “buy/sell” signal.
💡 What Makes This Unique
Statistical Rigor: The application of Z-score analysis to bar delta provides an objective, statistically-driven way to identify true anomalies, moving beyond arbitrary thresholds.
● Multi-Factor Confidence Scoring: The unique 1-4 star confidence system integrates multiple market dynamics (volume, trend alignment, specific follow-through) into a single, easy-to-interpret rating.
● User-Friendly Design: From the intuitive dashboard to the detailed signal tooltips, the indicator prioritizes clear and accessible information for traders of all experience levels.
🔬 How It Works
1. Bar Delta Calculation:
● The script first estimates the “buy volume” and “sell volume” for each bar. This is done by assuming that volume proportional to the distance from the low to the close represents buying, and volume proportional to the distance from the high to the close represents selling.
● How this contributes: This provides a proxy for the net buying or selling pressure (delta) within that specific price bar, even without access to actual footprint data.
2. Volume & Delta Z-Score Analysis:
● The average volume over a user-defined lookback period is calculated. Bars with volume less than twice this average are generally considered of lower interest.
● The Z-score for the calculated bar delta is computed. The Z-score measures how many standard deviations the current bar’s delta is from its average delta over the `Minimum Volume Lookback` period.
● How this contributes: A high positive Z-score indicates a bullish delta anomaly (significantly more buying than usual), while a high negative Z-score indicates a bearish delta anomaly (significantly more selling than usual). This identifies statistically unusual levels of pressure.
3. Trend Filtering (Optional):
● Two Exponential Moving Averages (Fast and Slow EMA) are used to determine the prevailing market trend. An uptrend is identified when the Fast EMA is above the Slow EMA, and a downtrend when the Fast EMA is below the Slow EMA.
● How this contributes: If enabled, the indicator will only display bullish delta anomalies during an uptrend and bearish delta anomalies during a downtrend, helping to confirm signals within the broader market context and avoid counter-trend signals.
4. Signal Generation & Confidence Scoring:
● When a delta Z-score exceeds the user-defined anomaly threshold, a signal is generated.
● This signal is then passed through a multi-factor confidence algorithm (`f_calculateConfidence`). It awards stars based on: high volume presence, alignment with the overall trend (if enabled), and a fourth star for very strong Z-scores (above 3.0) combined with specific follow-through candle patterns after a cooling-off period from a previous confirmed signal.
● How this contributes: Provides a qualitative rating (1-4 stars) for each anomaly, allowing traders to quickly assess the potential significance and reliability of the signal.
💡 Note:
The PhenLabs Volume Footprint Anomaly Scanner is a powerful analytical tool, but it’s crucial to understand that no indicator guarantees profit. Always backtest and forward-test the indicator settings on your chosen assets and timeframes. Consider integrating VFAS with your existing trading strategy, using its signals as confirmation for entries, exits, or trend bias. The Z-score threshold is highly customizable; lower values will yield more signals (including potential noise), while higher values will provide fewer but potentially higher-conviction signals. Adjust this parameter based on market volatility and your risk tolerance. Remember to combine statistical insights from VFAS with price action, support/resistance levels, and your overall market outlook for optimal results.

Spot vs. Derivatives BasisThis indicator calculates the basis between average spot and average perpetual futures prices across selected exchanges. It helps identify deviations between spot and perp markets — a key signal for funding pressure, arbitrage, or market dislocation.
Key Features:
Manual Pair Control – Enable or disable specific trading pairs as needed
Flexible Basis Smoothing – Apply SMA, EMA, WMA, or VWMA to filter noise
Anomaly Highlighting – Automatically flags basis deviations beyond ±0.1%

BTC Perp-Spot PremiumBTC Perp‑Spot Premium w/ EMA Cross
This indicator measures the premium or discount between BTC spot prices and perpetual futures across major exchanges. It visualizes real-time sentiment in the derivatives market and identifies potential inflection points by comparing the behavior of spot traders (real demand) and perp traders (speculative positioning).
What It Does
Calculates the premium spread
Shows the percentage difference between perp and spot prices as a color-coded histogram. Blue bars indicate perps trading above spot (aggressive longs), while red bars suggest perps below spot (risk-off or bearish positioning).
7-exchange composite data feed
Uses a robust average of six perpetual futures sources and seven spot market sources across Binance, Bybit, OKX, Coinbase, Bitfinex, Kraken, and Bitstamp for a balanced and high-fidelity view.
EMA crossover signals
Includes a customizable EMA and MA of the premium. Crossovers are visualized with subtle circle markers to signal sentiment shifts—blue for EMA crossing above, red for crossing below.
Zero baseline
A horizontal line at zero makes it easy to identify when perps flip from premium to discount territory and vice versa.
Dynamic stats table
Displays live values for the perp average, spot average, and premium % in a neatly formatted corner table.
Why It's Useful
This tool helps traders:
Monitor market sentiment and speculative aggression
Spot inefficiencies between derivatives and spot markets
Identify early reversal or continuation signals
Track potential liquidation zones or trend exhaustion
Confirm breakouts with perp/spot alignment
Whether you're trading short-term momentum or watching for mean-reverting setups, this premium analysis tool brings deeper context to BTC price action directly on your chart.

Support/Resistance MTF Merge ZonesIndicator Introduction
Support/Resistance MTF Merge Zones is an advanced technical analysis tool that automatically identifies and merges key support/resistance zones by analyzing highs and lows from multiple timeframes (15M, 1H, 4H, Daily).
Key Features
Multi-Timeframe Analysis: Integrates data from 15M, 1H, 4H, and Daily charts
Smart Zone Merging: Automatically consolidates levels within a specified percentage range into unified zones
Dynamic Color System: Distinguishes support/resistance zones based on position relative to current price
Strength Indication: Highlights zones where multiple levels converge as strong zones
Usage Guide
Configuration Parameters
Lookback Period (10): Period for calculating highs/lows
Adjustable range: 5-30
Higher values detect more long-term levels
Zone Merge % (0.5): Percentage threshold for zone merging
Range: 0.1-2.0%
Higher values merge levels across wider price ranges
Min Levels for Zone (2): Minimum number of levels required to form a zone
Range: 2-5 levels
Higher values display only more confirmed zones
Box Opacity (7): Transparency level of zone boxes
Range: 0-100%
Color Scheme
Red: Resistance zones above current price
Blue: Support zones below current price
Orange: Strong zones (3+ merged levels)

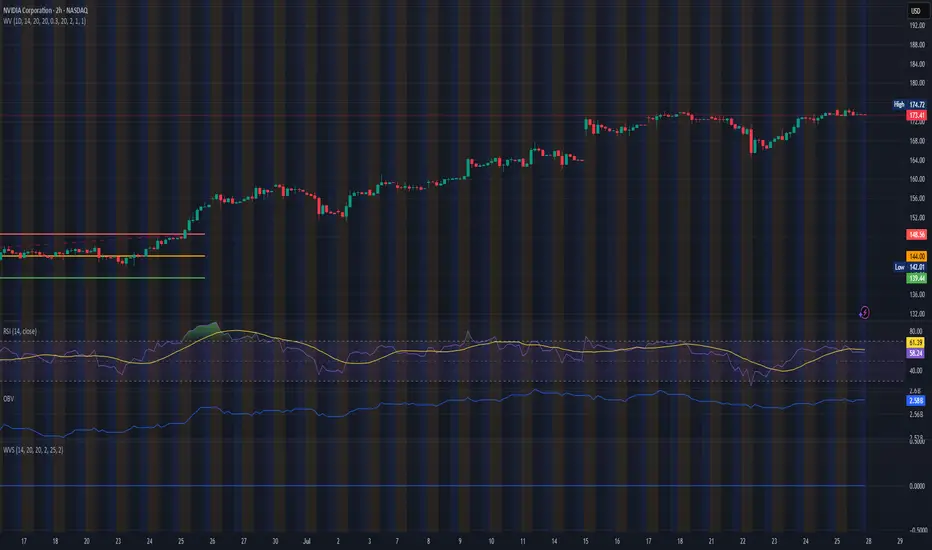
Master Trend Navigator/趋势大师导航仪[4H] by mrlazycat趋势大师导航仪使用说明
⚠ 非常重要,使用指标前请认真阅读这个使用说明
指标核心功能 本指标通过分析比特币的成交量、动能指标(MACD)、相对强弱指数(RSI)、趋势强度和成交量比率,生成在-1到1之间波动的趋势大师导航仪,帮助判断买卖时机。指标最佳适用场为4小时(4H)图表,适合1-2周的中短期交易。该趋势大师导航仪适用于 BTC,ETH, DOGE 等现货成交量大的虚拟货币
趋势曲线解读指南
① 市场状态(曲线颜色)
暗紫色:区间震荡市场 浅红色:弱多头趋势 深红色:强多头趋势 浅绿色:弱空头趋势 深绿色:强空头趋势
② 关键信号区域
红色区域(超买):趋势曲线 ≥ 0.6 时,可能出现回调风险
绿色区域(超卖):趋势曲线 ≤ -0.615 时,可能出现反弹机会
③ 锁定机制
在强多头趋势(深红色)和深绿色(强空头趋势)和部分弱趋势期间:
如果趋势曲线突破红色区域(超买)且市场趋势强度保持在强趋势或较强的弱趋势,趋势曲线会锁定在0.7附近(原始曲线以灰色继续)。
如果趋势曲线跌破绿色区域(超卖)且市场趋势强度保持在强趋势或较强的弱趋势,趋势曲线会锁定在-0.7附近(原始曲线以灰色继续)。 这表示趋势可能继续发展,建议等待锁定期结束后再进行操作。
✅ 极端多头趋势的特殊案例:(如ETH在2025年7月10日到20日,趋势曲线一直维持红色,意味着多头趋势不变。但这段时间ETH的趋势曲线曾跌到超卖区,因此曲线曾在底部锁定3个K线的时间,这意味着是多头右侧追多的机会。)
交易信号
① 超买超卖信号
红色区域(超买):趋势曲线 ≥ 0.6 时,可能出现回调风险
绿色区域(超卖):趋势曲线 ≤ -0.615 时,可能出现反弹机会
② 成交量爆发信号
顶部红色圆圈:代表成交量比率的爆发期,可能在当前或未来1-6根K线内出现阶段性高点。
底部黄色圆圈:代表成交量比率的潜在底部机会,可能在当前或未来1-6根K线内出现阶段性低点。
✅ 注意连续大量的顶部红色圆圈和底部黄色圆圈的出现,这意味着极端行情的出现。
③ 背离信号
顶背离(卖出信号):红色倒三角图标(标记为Bearish divergence\Sell)出现在趋势曲线顶部,当价格创新高但趋势曲线未创新高时触发,预示大幅回调风险。
底背离(买入信号):绿色正三角图标(标记为Bullish divergence\Buy)出现在趋势曲线底部,当价格创新低但趋势曲线未创新低时触发,预示底部反弹机会。
使用注意事项
① 交易所推荐:同时使用币安(Binance)和OKX的BTC/USDT现货数据(不同交易所的量能差异可能影响信号准确性)。
② 特殊行情优化:已针对2024-2025年比特币ETF上市后的低波动行情调整参数,未来将持续根据市场变化优化。
③ 强趋势操作提示:当趋势曲线锁定在超买或超卖区,应减少逆势操作。
④ 首次使用建议:观察历史行情以验证信号特征,震荡市捕捉反转点,趋势市识别延续信号。
最简单操作要诀
✅ 底部抄底组合:强空头趋势转弱空头 + 绿色超卖区 + 底背离绿色三角 + 底部黄色成交量圈
✅ 顶部逃顶组合:强多头趋势转弱多头趋势转换 + 红色超买区 + 顶背离红色三角 + 顶部红色成交量圈
✅ 趋势延续信号:趋势曲线锁定在 ±0.7 时,耐心等待锁定解除
推特联系:Jeffmo0769
Trend Master Navigator User Guide
⚠ Important: Please read this guide carefully before using the indicator
Core Functionality
This indicator analyzes Bitcoin's trading volume, MACD, RSI, trend strength, and volume ratio to generate the Trend Master Navigator, which oscillates between -1 and 1 to assist in buy/sell decisions. The indicator is best suited for 4-hour (4H) charts and is ideal for 1-2 week swing trading.The Trend Master Navigator is suitable for cryptocurrencies with high spot trading volumes, such as BTC , ETH , and DOGE .
Interpreting the Trend Curve
① Market States (Curve Colors)
Dark Purple: Range-bound market
Light Red: Weak bullish trend
Deep Red: Strong bullish trend
Light Green: Weak bearish trend
Deep Green: Strong bearish trend
② Key Signal Zones
Red Zone (Overbought): Trend curve ≥ 0.6 → Potential pullback risk
Green Zone (Oversold): Trend curve ≤ -0.615 → Potential rebound opportunity
③ Locking Mechanism
During strong bullish trends (deep red) and strong bearish trends (deep green), and partial weak trends:
If the trend curve breaks above the red zone (overbought) and market trend strength remains in a strong trend or robust weak trend, the trend curve will lock near 0.7 (original curve continues in gray).
If the trend curve breaks below the green zone (oversold) and market trend strength remains in a strong trend or robust weak trend, the trend curve will lock near -0.7 (original curve continues in gray).
This indicates that the trend may continue, and it is advisable to wait until the lock period ends before taking action.
✅ In the context of extreme bullish trends (e.g., ETH from July 10 to 20, 2025, where the trend curve remained red, indicating a persistent bullish trend), even though ETH's trend curve once dipped into the oversold zone, causing the curve to lock at the bottom for 3 K-line periods, this signifies a right-side buying opportunity during the bullish trend.
Trading Signals
① Overbought/Oversold Signals
Red Zone (Overbought): Trend curve ≥ 0.6 → Potential pullback risk
Green Zone (Oversold): Trend curve ≤ -0.615 → Potential rebound opportunity
② Volume Explosion Signals
Top Red Circle: Represents a volume ratio explosion period, possibly indicating a phase peak within the current or next 1-6 bars.
Bottom Yellow Circle: Represents a potential bottom opportunity in volume ratio, possibly indicating a phase trough within the current or next 1-6 bars.
✅ Pay attention to the continuous appearance of top red circles and bottom yellow circles, as this signals the emergence of extreme market conditions.
③ Divergence Signals
Bearish Divergence (Sell): Red inverted triangle icon (marked as Bearish divergence\Sell) appears at the trend curve top when the price makes a new high, but the trend curve does not; this indicates a significant pullback risk.
Bullish Divergence (Buy): Green upright triangle icon (marked as Bullish divergence\Buy) appears at the trend curve bottom when the price makes a new low, but the trend curve does not; this indicates a potential bottom rebound opportunity.
Other Usage Notes
① Exchange Recommendation: Use Binance and OKX BTC/USDT spot data simultaneously (volume discrepancies across different exchanges may affect signal accuracy).
② Special Market Optimization: Parameters have been adjusted for the low-volatility era following the Bitcoin ETF launch (2024-2025) and will continue to be optimized based on market changes.
③ Strong Trend Operation Tips: When the trend curve is locked in overbought or oversold zones, reduce counter-trend operations.
④ First Use Recommendation: Observe historical market trends to validate signal characteristics. Capture reversal points in range-bound markets and identify continuation signals in trending markets.
Simplest Trading Tactics
✅ Bottom Picking Setup: Transition from strong bearish trend to weak bearish + Green oversold zone + Bullish divergence green triangle + Bottom yellow volume circle
✅ Top Selling Setup: Transition from strong bullish trend to weak bullish trend + Red overbought zone + Bearish divergence red triangle + Top red volume circle
✅ Trend Continuation Signal: Trend curve locked at ±0.7 → Wait patiently for lock release
Contact on X: Jeffmo0769


Nifty Buy/Sell Signals with RSI & Fisheruy Signal when:
RSI crosses above 40 from below.
Fisher Transform crosses above its signal line (bullish crossover).
Sell Signal when:
RSI crosses below 60 from above.
Fisher Transform crosses below its signal line (bearish crossover).

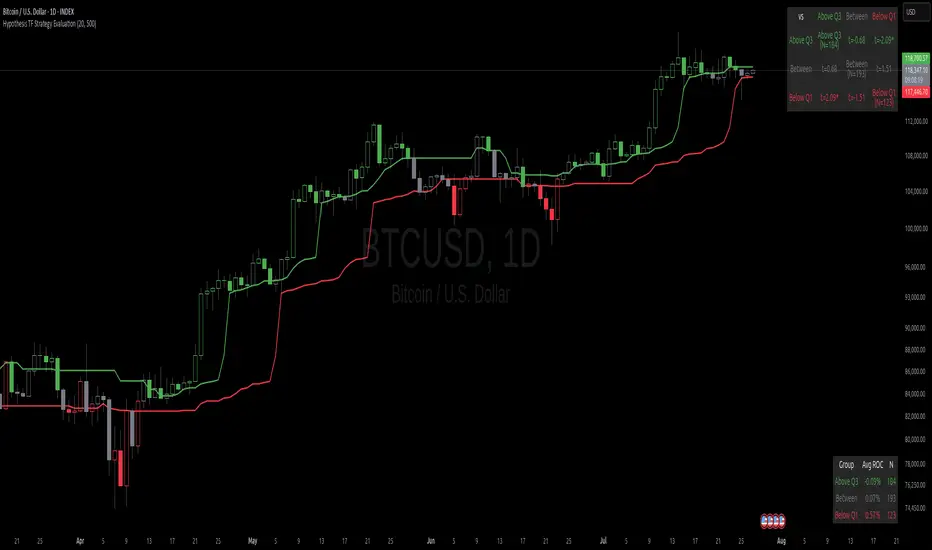
Hypothesis TF Strategy EvaluationThis script provides a statistical evaluation framework for trend-following strategies by examining whether mean returns (measured here as 1-period Rate of Change, ROC) differ significantly across different price quantile groups.
Specifically, it:
Calculates rolling 25th (Q1) and 75th (Q3) percentile levels of price over a user-defined window.
Classifies returns into three groups based on whether price is above Q3, between Q1 and Q3, or below Q1.
Computes mean returns and sample sizes for each group.
Performs Welch's t-tests (which account for unequal variances) between groups to assess if their mean returns differ significantly.
Displays results in two tables:
Summary Table: Shows mean ROC and number of observations for each group.
Hypothesis Testing Table: Shows pairwise t-statistics with significance stars for 95% and 99% confidence levels.
Key Features
Rolling quantile calculations: Captures local price distributions dynamically.
Robust hypothesis testing: Welch's t-test allows for heteroskedasticity between groups.
Significance indicators: Easy visual interpretation with "*" (95%) and "**" (99%) significance levels.
Visual aids: Plots Q1 and Q3 levels on the price chart for intuitive understanding.
Extensible and transparent: Fully commented code that emphasizes the evaluation process rather than trading signals.
Important Notes
Not a trading strategy: This script is intended as a tool for research and validation, not as a standalone trading system.
Look-ahead bias caution: The calculation carefully avoids look-ahead bias by computing quantiles and ROC values only on past data at each point.
Users must ensure look-ahead bias is removed when applying this or similar methods, as look-ahead bias would artificially inflate performance and statistical significance.
The statistical tests rely on the assumption of independent samples, which might not fully hold in financial time series but still provide useful insights
Usage Suggestions
Use this evaluation framework to validate hypotheses about the behavior of returns under different price regimes.
Integrate with your strategy development workflow to test whether certain market conditions produce statistically distinct return distributions.
Example
In this example, the script was run with a quantile length of 20 bars and a lookback of 500 bars for ROC classification.
We consider a simple hypothetical "strategy":
Go long if the previous bar closed above Q3 the 75th percentile).
Go short if the previous bar closed below Q1 (the 25th percentile).
Stay in cash if the previous close was between Q1 and Q3.
The screenshot below demonstrates the results of this evaluation. Surprisingly, the "long" group shows a negative average return, while the "short" group has a positive average return, indicating mean reversion rather than trend following.
The hypothesis testing table confirms that the only statistically significant difference (at 95% or higher confidence) is between the above Q3 and below Q1 groups, suggesting a meaningful divergence in their return behavior.
This highlights how this framework can help validate or challenge intuitive assumptions about strategy performance through rigorous statistical testing.
Markov Chain Trend ProbabilityA Markov Chain is a mathematical model that predicts future states based on the current state, assuming that the future depends only on the present (not the past). Originally developed by Russian mathematician Andrey Markov, this concept is widely used in:
Finance: Risk modeling, portfolio optimization, credit scoring, algorithmic trading
Weather Forecasting: Predicting sunny/rainy days, temperature patterns, storm tracking
Here's an example of a Markov chain: If the weather is sunny, the probability that will be sunny 30 min later is say 90%. However, if the state changes, i.e. it starts raining, how the probability that will be raining 30 min later is say 70% and only 30% sunny.
Similar concept can be applied to markets price action and trends.
Mathematical Foundation
The core principle follows the Markov Property: P(X_{t+1}|X_t, X_{t-1}, ..., X_0) = P(X_{t+1}|X_t)
Transition Matrix :
-------------Next State
Current----
--------P11 P12
-----P21 P22
Probability Calculations:
P(Up→Up) = Count(Up→Up) / Count(Up states)
P(Down→Down) = Count(Down→Down) / Count(Down states)
Steady-state probability: π = πP (where π is the stationary distribution)
State Definition:
State = UPTREND if (Price_t - Price_{t-n})/ATR > threshold
State = DOWNTREND if (Price_t - Price_{t-n})/ATR < -threshold
How It Works in Trading
This indicator applies Markov Chain theory to market trends by:
Defining States: Classifies market conditions as UPTREND or DOWNTREND based on price movement relative to ATR (Average True Range)
Learning Transitions: Analyzes historical data to calculate probabilities of moving from one state to another
Predicting Probabilities: Estimates the likelihood of future trend continuation or reversal
How to Use
Parameters:
Lookback Period: Number of bars to analyze for trend detection (default: 14)
ATR Threshold: Sensitivity multiplier for state changes (default: 0.5)
Historical Periods: Sample size for probability calculations (default: 33)
Trading Applications:
Trend confirmation for entry/exit decisions
Risk assessment through probability analysis
Market regime identification
Early warning system for potential trend reversals
The indicator works on any timeframe and asset class. Enjoy!

Clarix 5m Scalping Breakout StrategyPurpose
A 5-minute scalping breakout strategy designed to capture fast 3-5 pip moves, using premium/discount zone filters and market bias conditions.
How It Works
The script monitors price action in 5-minute intervals, forming a 15-minute high and low range by tracking the highs and lows of the first 3 consecutive 5-minute candles starting from a custom time. In the next 3 candles, it waits for a breakout above the 15m high or below the 15m low while confirming market bias using custom equilibrium zones.
Buy signals trigger when price breaks the 15m high while in a discount zone
Sell signals trigger when price breaks the 15m low while in a premium zone
The strategy simulates trades with fixed 3-5 pip take profit and stop loss values (configurable). All trades are recorded in a backtest table with live trade results and an automatically updated win rate.
Features
Designed exclusively for the 5-minute timeframe
Custom 15-minute high/low breakout logic
Premium, Discount, and Equilibrium zone display
Built-in backtest tracker with live trade results, statistics, and win rate
Customizable start time, take profit, and stop loss settings
Real-time alerts on breakout signals
Visual markers for trade entries and failed trades
Consistent win rate exceeding 90–95% on average when following market conditions
Usage Tips
Use strictly on 5-minute charts for accurate signal performance. Avoid during high-impact news releases.
Important: Once a trade is opened, manually set your take profit at +3 to +5 pips immediately to secure the move, as these quick scalps often hit the target within a single candle. This prevents missed exits during rapid price action.

GLOBEX BOX v1.0All credit to the creator and teacher of this strategy, @RS.
The "GOBEX BOX v1.0" indicator draws customizable horizontal rectangles (with optional midlines and labels) around specific opening candles in the EST timezone ("America/New_York").
It highlights:
The 09:30–09:31 EST 1-minute candle high/low for Monday through Friday.
The 18:00–18:05 EST 5-minute candle high/low for Sunday through Thursday.
Various customizable features are in the indicator settings.
Happy trading!

HTF Current/Average RangeThe "HTF(Higher Timeframe) Current/Average Range" indicator calculates and displays the current and average price ranges across multiple timeframes, including daily, weekly, monthly, 4 hour, and user-defined custom timeframes.
Users can customize the lookback period, table size, timeframe, and font color; with the indicator efficiently updating on the final bar to optimize performance.
When the current range surpasses the average range for a given timeframe, the corresponding table cell is highlighted in green, indicating potential maximum price expansion and signaling the possibility of an impending retracement or consolidation.
For day trading strategies, the daily average range can serve as a guide, allowing traders to hold positions until the current daily range approaches or meets the average range, at which point exiting the trade may be considered.
For scalping strategies, the 15min and 5min average range can be utilized to determine optimal holding periods for fast trades.
Other strategies:
Intraday Trading - 1h and 4h Average Range
Swing Trading - Monthly Average Range
Short-term Trading - Weekly Average Range
Also using these statistics in accordance with Power 3 ICT concepts, will assist in holding trades to their statistical average range of the chosen HTF candle.
CODE
The core functionality lies in the data retrieval and table population sections.
The request.security function (e.g., = request.security(syminfo.tickerid, "D", , lookahead = barmerge.lookahead_off)) retrieves high and low prices from specified timeframes without lookahead bias, ensuring accurate historical data.
These values are used to compute current ranges and average ranges (ta.sma(high - low, avgLength)), which are then displayed in a dynamically generated table starting at (if barstate.islast) using table.new, with conditional green highlighting when the current range is greater than average range, providing a clear visual cue for volatility analysis.

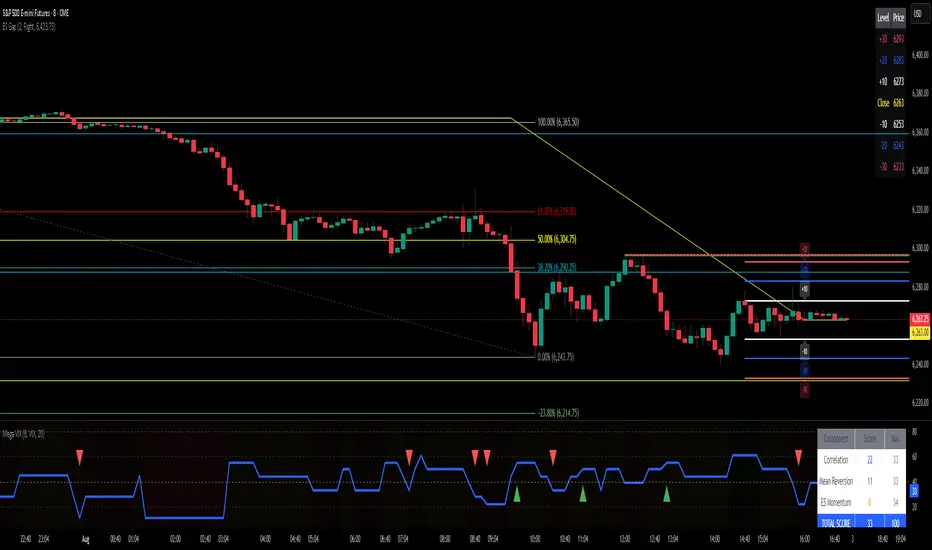
ES Gap Trading Levels# ES Gap Trading Levels
## Overview
A professional gap trading indicator designed specifically for ES Futures traders. This indicator automatically captures the closing price at 3:59 PM ET (NYSE close) and immediately displays key gap levels for the evening trading session starting at 6:00 PM ET.
## Key Features
### ✅ **Automatic Gap Level Detection**
- Captures ES Futures closing price at 3:59-4:00 PM ET
- Instantly displays gap levels for immediate session planning
- Resets daily for fresh gap analysis
### ✅ **Six Critical Gap Levels**
- **±10 Points** (White lines) - Short-term gap targets
- **±20 Points** (Light Blue lines) - Medium gap targets
- **±30 Points** (Red lines) - Extended gap targets
### ✅ **Professional Display**
- Clean horizontal lines with customizable colors
- Clear labels showing point values (+30, +20, +10, -10, -20, -30)
- Gap levels table showing exact price targets
- Optional closing price reference line
### ✅ **Customizable Settings**
- Adjustable line colors, width, and extension
- Toggle labels and reference table on/off
- Manual closing price override for testing
- Debug mode for troubleshooting
### ✅ **Smart Management**
- Automatic cleanup of previous day's levels
- Lines appear immediately after market close
- Optimized for ES1!, MES1!, and other ES futures contracts
## How It Works
1. **Market Close Capture**: At 3:59 PM ET, the indicator captures the ES closing price
2. **Instant Display**: Gap levels immediately appear on your chart
3. **Evening Session Ready**: Lines are positioned for 6:00 PM ET session start
4. **Daily Reset**: Old levels are automatically cleared each new trading day
## Perfect For:
- Gap trading strategies
- Overnight futures trading
- ES futures scalping
- Session transition analysis
- Risk management levels
## Usage Tips:
- Best used on 1-15 minute ES futures charts
- Ensure chart timezone shows ET times
- Use manual mode for backtesting specific dates
- Combine with volume and momentum indicators
## Settings Guide:
- **Display Settings**: Control lines, labels, and table visibility
- **Colors**: Customize each gap level color scheme
- **Manual Settings**: Override closing price for testing
- **Debug**: View time detection and diagnostic information
*Designed by traders, for traders. Clean, professional, and reliable gap level detection for serious ES futures trading.*
6FG Trading Plan Checklist & Setups6FG Trading Plan Checklist & Setups
Trend context (4H & H1)
Candle confirmations on 15M (bull/bear engulfing & pin bar)
Your two A+ setups:
• H1 Break of Structure (BxOxS)
• Trap Break (with last LH/HL break logic)
Alerts for both setups

Waterfall ScreenerHow to Use This to Screen Stocks: A Step-by-Step Guide
Save the Screener Script: Open the Pine Editor, paste the code above, and save it with a clear name like "Waterfall Screener".
Open the Stock Screener: Go to the TradingView homepage or any chart page and click the "Screener" tab at the bottom. Make sure you are on the "Stock" screener.
Set Your Market: Choose the market you want to scan (e.g., NASDAQ, NYSE).
Add Your Custom Filter (The Magic Step):
Click the "Filters" button on the right side of the screener panel.
In the search box that appears, type the name of your new script: "Waterfall Screener".
It will appear as a selectable filter. Click it.
Configure the Filter:
A new filter will appear in your screener list named "Waterfall Screener".
You can now set conditions for the "ScreenerSignal" value we plotted.
To find stocks with a new, actionable trade plan, set the filter to:
Waterfall Screener | Equal | 1
Refine and Scan:
Add other essential filters to reduce noise, such as:
Volume > 1M (to find liquid stocks)
Market Cap > 1B (to find established companies)
The screener will now automatically update and show you a list of all stocks that currently have a "PENDING_ENTRY" setup according to the indicator's logic and your chosen timeframe (e.g., Daily).
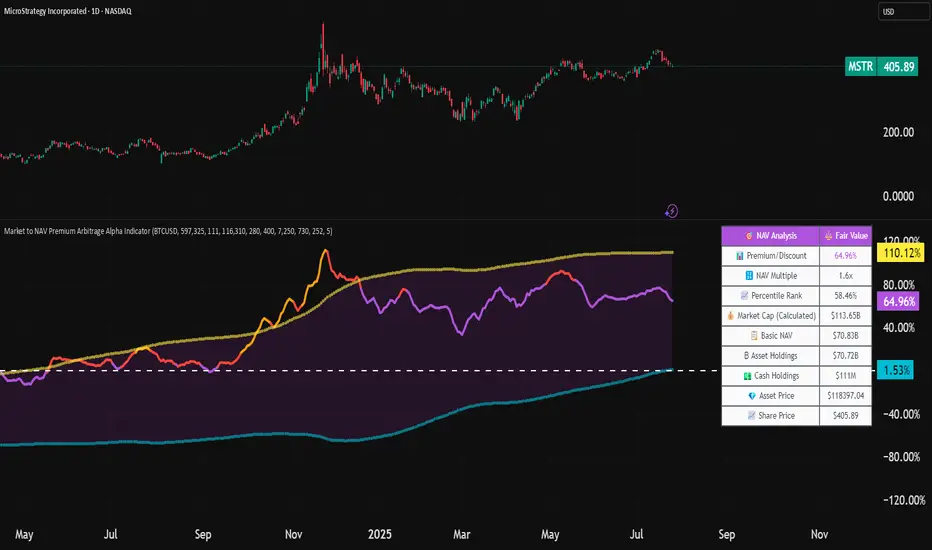
Market to NAV Premium Arbitrage Alpha IndicatorBitcoin treasury companies such as Microstrategy are known for trading at significant premiums. but how big exactly is the premium? And how can we measure it in real time?
I developed this quantitative tool to identify statistical mispricings between market capitalization and net asset value (NAV), specifically designed for arbitrage strategies and alpha generation in Bitcoin-holding companies, such as MicroStrategy or Sharplink Gaming, or SPACs used primarily to hold cryptocurrencies, Bitcoin ETFs, and other NAV-based instruments. It can probably also be used in certain spin-offs.
KEY FEATURES:
✅ Real-time Premium/Discount Calculation
• Automatically retrieves market cap data from TradingView
• Calculates precise NAV based on underlying asset holdings (for example Bitcoin)
• Formula: (Market Cap - NAV) / NAV × 100
✅ Statistical Analysis
• Historical percentile rankings (customizable lookback period)
• Standard deviation bands (2σ) for extreme value detection (close to these values might be seen as interesting points to short or go long)
• Smoothing period to reduce noise
✅ Multi-Source Market Cap Detection
• You can add the ticker of the NAV asset, but if necessary, you can also put it manually. Priority system: TradingView data → Calculated → Manual override
✅ Advanced NAV Modeling
• Basic NAV: Asset holdings + cash.
• Adjusted NAV: Includes software business value, debt, preferred shares. If the company has a lot of this kind of intrinsic value, put it in the "cash" field
• Support for any underlying asset (BTC, ETH, etc.)
TRADING APPLICATIONS:
🎯 Pairs Trading Signals
• Long/Short opportunities when premium reaches statistical extremes
• Mean reversion strategies based on historical ranges
• Risk-adjusted position sizing using percentile ranks
🎯 Arbitrage Detection
• Identifies when market pricing significantly deviates from fair value
• Quantifies the magnitude of mispricing for profit potential
• Historical context for timing entry/exit points
CONFIGURATION OPTIONS:
• Underlying Asset: Any symbol (default: COINBASE:BTCUSD) NEEDS MANUAL INPUT
• Asset Quantity: Precise holdings amount (for example, how much BTC does the company currently hold). NEEDS MANUAL INPUT
• Cash Holdings: Additional liquid assets. NEEDS MANUAL INPUT
• Market Cap Mode: Auto-detect, calculated, or manual
• Advanced Adjustments: Business value, debt, preferred shares
• Display Settings: Lookback period, smoothing, custom colors
IT CAN BE USED BY:
• Quantitative traders focused on statistical arbitrage
• Institutional investors monitoring NAV-based instruments
• Bitcoin ETF and MSTR traders seeking alpha generation
• Risk managers tracking premium/discount exposures
• Academic researchers studying market efficiency (as you can see, markets are not efficient 😉)
Stochastic Z-Score [AlgoAlpha]🟠 OVERVIEW
This indicator is a custom-built oscillator called the Stochastic Z-Score , which blends a volatility-normalized Z-Score with stochastic principles and smooths it using a Hull Moving Average (HMA). It transforms raw price deviations into a normalized momentum structure, then processes that through a stochastic function to better identify extreme moves. A secondary long-term momentum component is also included using an ALMA smoother. The result is a responsive oscillator that reacts to sharp imbalances while remaining stable in sideways conditions. Colored histograms, dynamic oscillator bands, and reversal labels help users visually assess shifts in momentum and identify potential turning points.
🟠 CONCEPTS
The Z-Score is calculated by comparing price to its mean and dividing by its standard deviation—this normalizes movement and highlights how far current price has stretched from typical values. This Z-Score is then passed through a stochastic function, which further refines the signal into a bounded range for easier interpretation. To reduce noise, a Hull Moving Average is applied. A separate long-term trend filter based on the ALMA of the Z-Score helps determine broader context, filtering out short-term traps. Zones are mapped with thresholds at ±2 and ±2.5 to distinguish regular momentum from extreme exhaustion. The tool is built to adapt across timeframes and assets.
🟠 FEATURES
Z-Score histogram with gradient color to visualize deviation intensity (optional toggle).
Primary oscillator line (smoothed stochastic Z-Score) with adaptive coloring based on momentum direction.
Dynamic bands at ±2 and ±2.5 to represent regular vs extreme momentum zones.
Long-term momentum line (ALMA) with contextual coloring to separate trend phases.
Automatic reversal markers when short-term crosses occur at extremes with supporting long-term momentum.
Built-in alerts for oscillator direction changes, zero-line crosses, overbought/oversold entries, and trend confirmation.
🟠 USAGE
Use this script to track momentum shifts and identify potential reversal areas. When the oscillator is rising and crosses above the previous value—especially from deeply negative zones (below -2)—and the ALMA is also above zero, this suggests bullish reversal conditions. The opposite holds for bearish setups. Reversal labels ("▲" and "▼") appear only when both short- and long-term conditions align. The ±2 and ±2.5 thresholds act as momentum warning zones; values inside are typical trends, while those beyond suggest exhaustion or extremes. Adjust the length input to match the asset’s volatility. Enable the histogram to explore underlying raw Z-Score movements. Alerts can be configured to notify key changes in momentum or zone entries.

Elite Display# 😎 Elite Display - Simple Chart Info with Style
**Never lose track of what you're looking at!**
A clean, fun way to display your asset name, timeframe, and daily performance directly on your chart. Created by ** ** for traders who like their charts both informative and stylish.
## 📊 **What it shows:**
- Asset name (BTCUSDT) or description (Bitcoin/TetherUS)
- Current timeframe (1H, 4H, 1D, etc.)
- Daily % change with green/red colors
**Example:** `BTCUSDT | 1H | +2.45%`
## 🎨 **Make it yours:**
- **60+ separator styles** - From classic `|` to fun emojis 🚀💎⚡
- **Mood mode** - Separators react to your performance (😄 for gains, 😢 for losses)
- **Position anywhere** - 9 spots on your chart
- **Custom styling** - Colors, fonts, sizes, bold/italic
## 🎯 **Perfect for:**
- Multi-timeframe analysis (never forget which TF you're on!)
- Taking clean screenshots for social media
- Avoiding "wait, what symbol is this?" moments
- Adding a bit of personality to your workspace
## ⚙️ **Super simple setup:**
1. Add to chart
2. Pick what to show (asset/timeframe/both)
3. Choose your style (classic, fun, or reactive mood)
4. Position it wherever you want
5. Done!
**It's just chart info... but way more fun!** 😊
*Works on all markets: Stocks, Crypto, Forex, Commodities*# 📊 TradingHUD - Your Smart Chart Companion
**Transform your charts with the ultimate context display!** Never lose track of your symbol, timeframe, and performance again. This highly customizable indicator brings personality and clarity to your trading workspace.
## 🚀 **Key Features:**
✅ **5 Display Modes:**
- Asset Name (ticker only)
- Full Description (complete name)
- Both combined
- Timeframe Only
- Daily Variation Only
✅ **60+ Separator Styles in 3 Categories:**
- 🎨 **Classic** (15): Professional symbols (|, •, →, ★, etc.)
- 🎉 **Fun** (20): Colorful objects (🚀, 💎, ⚡, 🎯, 💰, etc.)
- 🎭 **Mood** (40+): Reactive yellow faces!
- 😄 **Happy** (21): 😀😊🥰😎🥳 (for green gains)
- 😢 **Sad** (23): 😢😭🥺😞😩 (for red losses)
✅ **Intelligent Variation Display:**
- Daily % change with smart color coding
- Green/red performance tracking
- Only appears on relevant timeframes (intraday + daily)
- Automatically hidden on weekly/monthly
✅ **Ultimate Customization:**
- 9 positioning options anywhere on chart
- Font families: Default or Monospace
- Bold/italic text formatting
- Custom colors and sizes
- Flexible element ordering
## 🎭 **Mood Mode Magic:**
Watch your separators celebrate wins with 😄🤑🚀 or empathize with losses using 😢😭💸. Toggle this emotional feature on/off anytime!
## 💡 **Perfect For:**
- Multi-timeframe analysis
- Screenshot documentation with context
- Avoiding symbol confusion
- Real-time performance tracking
- Adding personality to professional charts
- Social media trading posts
## ⚙️ **Quick Setup:**
1. Add TradingHUD to your chart
2. Select display mode (Asset/Description/Both/etc.)
3. Choose separator style (Classic/Fun/Mood)
4. Position anywhere you want
5. Customize colors, fonts, and formatting
6. Trade with confidence and style!
## 🎯 **Live Examples:**
- **Classic**: `BTCUSDT | 1H | +2.45%`
- **Fun**: `AAPL 🚀 4H 🚀 -1.23%`
- **Happy Mood**: `Gold 😄 1D 😄 +3.67%`
- **Sad Mood**: `BTC 😢 15min 😢 -5.12%`
**Professional meets personality. Context meets creativity. This is TradingHUD.** 📈✨
*Compatible with all markets: Stocks, Crypto, Forex, Commodities, Indices*