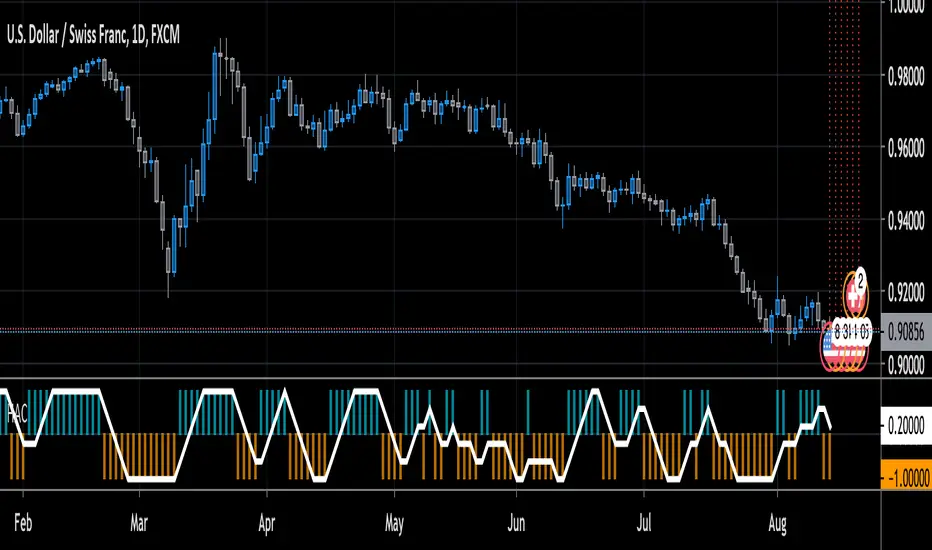
Introduction I already made an indicator (simple line) that tried to make lines on price such that the results would not repaint and give a good fit to the price, today i publish a channels indicator based on the simple line indicator. The indicator aim to show possible support and resistance levels when the central line posses a low sum of squares with the...
This is an update to the idea of The Kahlman smoother makes the signal more precise (by one candle).
The Smooth moving average ribbon script is an enhancement of the script I posted yesterday. But will help you also create a very simple trend-following strategy or a simple trend-following filter. You are able to select from a large variety of moving averages add Heikin Ashi Candles as a source and also add additional smoothing to every single of the moving...
The Smooth moving average script combo combines the ability to help you create a very simple trend-following strategy or a simple trend-following filter. You are able to select from a large variety of moving averages add Heikin Ashi Candles as a source and also add additional smoothing to every single of the moving averages. The Study is equipped with...
Exponential Moving Average on last 20, 50 and 200 close prices.
Simple Moving Average over 20, 50 and 200 close prices.
Introduction Technical indicators often have parameters settings that the user must enter, those are inconvenient when the user must design a strategy because such settings must be optimized, it must also been noted that the optimal settings at time t could change at time t+n , this is why non parametric indicators are more efficient. Today i propose a moving...
Here's an updated version of our Vortex Trend Tracker indicator. Here's the link to the original if anyone wants to read more about the Vortex or see the first version: We've added in 4 rsi's of varying lengths for this second version(2 fast and 2 slow) that create the background color effect.
Script for filtering out periods when market is not trending. It defines downtrend as following: Lowest price of last 2 days is equal or lower then lowest price of last 100 days. Values 2 and 100 are customizable. Uptrend analogically with highs.
For thos who prefer Kinjun-Sen from the Ichimoku algo to use as your baseline. Trade safe mnovo
This script is a fork of the Madrid Ribbon, the only difference is that you can color your bars depending on the trend.
Introduction Using conditions in filters is a way to make them adapt to those, i already used this methodology in one of my proposed indicators ARMA which gave a really promising adaptive filter, ARMA tried to have a flat response when dealing with ranging market while following the price when the market where trending or exhibiting volatile movements, the...
Though it may sound complex, the Vortex Indicator is essentially an uptrend line and a downtrend line. The vortex indicator can be used for a variety of purposes, including tracking the strength of trends, identifying/anticipating reversals, and generating entry/exit signals. It’s calculation is shown in the open-source code below. To reduce the number of...
Hello traders The SMA 50 is known to define a trend. If price is closing above, trend is bullish, if below, trend is bearish. That's why I like to have all of them on my chart :) Enjoy David
Hello traders Some friends asked me to do it so... sharing it for everyone instead This indicator detects when the first moving average is above the two others. It's a very powerful tool for trend traders that use multiple moving averages to detect a strong trend Enjoy Dave
Hello traders This indicator is to color the candles based on a MACD Zero LAG Just wanted to show that removing the noise from the candles natural coloring could be very helpful to determine a trend and stay focused Enjoy Dave