EMA Pullback Pro V8.5Introduction to High-Probability Trend Trading
The EMA PBN Pro 8.5 is a specialized trading suite designed to assist scalpers and day traders in identifying high-probability trend continuation setups.
In professional trading, one of the most difficult challenges is distinguishing between a genuine "dip" in an uptrend and the beginning of a reversal. Many traders lose capital by entering pullbacks too early (catching a falling knife) or too late (chasing the move). This script addresses that issue by combining multiple layers of trend analysis into a single, objective visual interface.
The Philosophy Behind the Script
This tool is built on the core principle that price action in strong trends tends to respect dynamic support and resistance zones derived from institutional moving averages and relative strength flows.
Trend Alignment: Markets are fractal. A 5-minute pullback is often a 1-minute downtrend. This system uses multi-factor analysis to ensure you are trading in the direction of the dominant momentum, filtering out low-quality "chop" environments where moving averages lose their efficacy.
Relative Strength (RS/RW): Asset selection is key. Trading an asset that is showing relative strength compared to the broader market index (like SPY or QQQ) significantly increases the probability of a successful bounce. This script incorporates logic to highlight assets that are outperforming their peers.
Objective Entries: By visually plotting "Value Zones," the script removes the guesswork. It waits for specific confluence criteria—momentum exhaustion, trend alignment, and relative strength—before suggesting an area of interest.
Features Overview
Dynamic Trend Filtering: Color-coded zones indicate when the market is in a "safe" buy/sell zone versus a neutral zone where cash is the best position.
Pullback Detection: Automatically identifies optimal zones for re-entry into established trends, helping traders enter on weakness in strong stocks.
Noise Reduction: The algorithm smoothes out insignificant price fluctuations, allowing the trader to focus on the structural moves of the session.
Access and Permissions
This is a proprietary, Invite-Only script. It is protected to prevent unauthorized distribution and to maintain the integrity of the strategy for current users.
The source code is hidden.
Access is granted on a per-user basis.
Please refer to the Author's Instructions section below for details on how to request access or trial the system.
(Note: This tool is for educational purposes only. Past performance is not indicative of future results. Always manage your risk.)
Indicateurs et stratégies


Bayesian Order Flow Predictor📌 Bayesian Order Flow Predictor — Advanced Probability Engine for Nasdaq and Futures
This indicator is a next-generation probabilistic forecasting system designed for Nasdaq traders who rely on Order Flow, Auction Market Theory, Value Area dynamics, market structure, DOM imbalance, and Bayesian probability models.
It combines 7 professional-grade factors (DOM, CVD, RSI, EMA trend, ATR volatility, Market Structure, Value Area positioning) into a unified Bayesian probability panel that outputs a clean bullish/bearish probability curve with high-confidence reversal and trend-continuation signals.
Engineered for scalpers, day traders, futures traders, and ICT-style order flow technicians, it delivers real-time directional probability, session-aware signals, and optional news-filter exclusion.
⭐ Features
Bayesian Probability Model (0–100%)
DOM imbalance scoring across dynamic depth levels
Cumulative Volume Delta (CVD) scoring
Market structure detection (HH/LL micro-trend shifts)
RSI momentum and overbought/oversold scoring
EMA directional bias + ATR-normalized deviation
Value Area positioning (VAH / VAL / POC) with optional previous-session mode
Session filtering (only signals during active hours)
Automated news filter (exclude signals around scheduled macro events)
Bull/Bear probability zones with background coloring
Anti-repetition system (no double signals in same direction)
Designed for future scalping, futures order flow, and high-precision timing
🧠 Bayesian Probability Engine — How It Works
The model evaluates 7 independent market factors simultaneously:
DOM imbalance
CVD pressure
Market structure
RSI deviation
EMA trend
Value Area position
ATR volatility shift
Each factor is transformed into a normalized score, multiplied by its weighting parameter, and aggregated into a global score.
This score is then passed through a Bayesian logistic function to convert uncertainty into a smooth probability curve, giving traders a clean, mathematically stable, and noise-resistant forecast.
📈 Buy & Sell Signal Logic
Signals trigger when:
Bullish Probability crosses above the user threshold
Bearish Probability crosses below the opposite threshold
Session is active
No protected news event is occurring
This avoids noise, prevents over-signaling, and focuses only on high-confidence inflection points.
🎯Fully compatible with the indicator: ➡️ AI Probabilistic Orderflow scalper
Both indicators synchronize perfectly when used together:
Bayesian panel → trend probability
Scalper v1 → timing + TP/SL engine
Together they create a complete probability-driven revenue management system for scalping Future.
📘 How to Use
Add the indicator to your chart
Set your trading session (e.g., 09:30–16:00 EST)
Adjust weights depending on your style (Order Flow / Momentum / Value Area)
Watch the probability curve:
Above threshold → bullish bias
Below threshold → bearish bias
Take signals when the curve crosses thresholds, not when flat
Combine with "AI Probabilistic Orderflow scalper" indicator for execution timing
Avoid high-impact news using the News Filter
💎 Advantages
Professional-grade Bayesian model
Works in all volatility regimes
Noise-resistant and smoother than traditional oscillators
Integrates Order Flow + Auction Theory + Momentum + Volatility
Perfect for NQ scalpers seeking an AI-style probability dashboard
Reduces emotional decision-making
Compatible with any execution strategy
Optimized for high winrate scalping and sniper entries

QuantBot StrategyAutomated opening range breakout strategy for futures and intraday trading. Identifies the initial trading range and executes trades on breakouts with multiple confluence filters.
Key Features:
Opening Range Detection: Automatically identifies and tracks the opening range
Multi-Filter Entry System: Optional confluence filters to improve entry quality
Flexible Profit Targets: Dynamic targets based on recent volatility, or fixed tick/dollar targets
Advanced Position Management: Add to positions at key levels; partial profit-taking with trailing runners
Risk Controls: Multiple stop loss methods, maximum trade limits, and distance filters
Time-Based Filters: Configurable trading hours and days, with optional holiday blackouts
Visual Indicators: Displays trend lines, bands, and range levels on your chart
Designed for disciplined, systematic trading with customizable risk management and position sizing.

AbunawafAlotabi - Breakout - 66 Breakout - 66
A professional breakout detector designed to identify strong bullish breakouts when price closes above the highest level of the previous day, previous week, or previous month.
The indicator evaluates the current close relative to the previous period’s high and only highlights breakouts that exceed a user-defined percentage threshold—filtering out weak or insignificant movements.
🔍 How the Indicator Works
Choose Your Reference Period
You may select:
Previous Day
Previous Week
Previous Month
The indicator retrieves that period’s high, then continuously compares the current close to that benchmark.
Breakout Condition
A breakout is triggered only when:
The current candle closes above the previous period high
The prior candle was still below that high
The breakout strength exceeds the minimum percentage threshold
Visual Signals
The breakout candle is optionally colored green
A small marker appears below the candle indicating whether the breakout is Daily (D), Weekly (W), or Monthly (M)
Automatic Alert
An alert fires instantly when a valid breakout occurs, allowing the trader to respond without constantly monitoring the chart.
✨ Why This Indicator Stands Out
✔ Filters out weak breakouts using a minimum breakout percentage
✔ Works seamlessly on all instruments and timeframes
✔ Ideal for day traders, swing traders, and HTF analysts
✔ Helps identify the start of momentum moves as price breaks above structural highs
✔ Clean, simple visual design with minimal clutter
⚡ Summary
Breakout 66 is a powerful tool for traders who want to capture meaningful momentum as price breaks above major highs from prior sessions, weeks, or months—highlighting only the strongest and most actionable breakout signals.
مؤشر احترافي يهدف إلى التقاط لحظات الاختراق القوية عندما يخترق السعر أعلى مستوى تم تسجيله في الفترة السابقة، سواء كانت اليوم السابق أو الأسبوع السابق أو الشهر السابق.
يستخدم المؤشر مقارنة مباشرة بين السعر الحالي وأعلى قمة من الفترة المرجعية المختارة، ويحدد فقط الاختراقات الحقيقية التي يتجاوز فيها السعر نسبة محددة مسبقًا من الحركة، مما يساعد على تصفية الإشارات الضعيفة وإظهار أقوى فرص التحرك السعري.
🔍 كيف يعمل المؤشر؟
اختيار الفترة المرجعية
يمكنك اختيار واحدة من الفترات التالية:
اليوم السابق
الأسبوع السابق
الشهر السابق
المؤشر يتتبع أعلى قمة في تلك الفترة
ثم يقارن السعر الحالي بها بشكل لحظي.
تفعيل إشارة الاختراق (Breakout)
يتحقق الاختراق عندما:
يخترق الإغلاق مستوى القمة السابقة.
وكانت شمعة الأمس/الأسبوع/الشهر أقل من تلك القمة.
ويتجاوز السعر نسبة الحد الأدنى للاختراق (Breakout %) المحددة من المستخدم.
تمييز شمعة الاختراق
في حال تحقق الشرط، يقوم المؤشر بتلوين الشمعة باللون الأخضر وإظهار نقطة صغيرة تحتها للدلالة على نوع الاختراق (يومي – أسبوعي – شهري).
تنبيه تلقائي
عند حدوث أي اختراق صالح، يقوم المؤشر بإطلاق تنبيه تلقائي يشير إلى Breakout حقيقي قائم على الفترة المرجعية المختارة.
✨ لماذا هذا المؤشر مختلف؟
✔ يساعدك على اكتشاف الاختراقات القوية فقط وليس أي حركة بسيطة فوق القمة.
✔ يقيس نسبة قوة الحركة (Breakout %) لضمان جودة الإشارة.
✔ يناسب جميع الأساليب: المتداول اليومي، المتأرجح، ومستويات HTF.
✔ يعطيك رؤية واضحة حول الاتجاهات عندما تتجاوز الأسعار أعلى مستوياتها التاريخية القريبة.
✔ يعمل على أي أصل: أسهم – عملات – عملات رقمية – عقود – سلع.
⚡ النتيجة
مؤشر Breakout 66 هو أداة قوية للمتداول الذي يبحث عن لحظات الحركة الحقيقية التي تكسر مستويات المقاومة الطبيعية للسوق، وتحدد بداية موجة جديدة محتملة من الزخم.

Intraday for Options By TradeEarnIntraday for Options By TradeEarn
**High-Probability Scalping Strategy with Leading Indicators & Automation Support**
This strategy is designed for **Intraday Nifty & BankNifty Futures** trading. Unlike traditional strategies that rely on lagging indicators (like Supertrend or Moving Averages), this script uses **Leading Indicators** and **Price Action** to detect momentum bursts *before* they happen.
It is fully optimized for **Options Buying** automation via the **Stoxxo/Algobaba Bridge**.
### 🚀 Key Features
**1. Leading Signal Logic (No Lag)**
* **RSI Momentum:** Filters for strong bullish (>55) or bearish (<45) momentum shifts.
* **Impulse Price Action:** Detects "Smart Money" entries by analyzing candle body size relative to the recent average.
* **ADX Filter:** Built-in "Chop Filter". The strategy will **refuse to trade** in sideways markets (when ADX < 20), protecting your capital from fakeouts.
**2. Smart Risk Management (Rupee-Based)**
* **Auto-Calculation:** You input your Target and Stop Loss in **Rupees (₹)** (e.g., ₹1000 Profit, ₹500 Loss). The script automatically calculates the required Index Points and Ticks based on your Lot Size.
* **Trailing Stop Loss:** Features an intelligent trailing mechanism. (Default: For every ₹25 gain, the SL trails by ₹10) to lock in profits during big trends.
**3. Anti-Overtrading Mechanism (Cooldown)**
* To prevent "revenge trading" or getting caught in volatility, the strategy includes a **Cooldown Period**. After any trade exit, it waits for **5 Candles** (adjustable) before scanning for new signals.
**4. Automation Ready**
* Pre-configured with `MULTILEG` alert strings for **Stoxxo/Algobaba**.
* Sends "LongCall" and "LongPut" tags, allowing your bridge to automatically select the Best Strike (ATM/ITM).
---
### ⚙️ How to Use
1. **Chart:** Use **NIFTY FUTURES** (e.g., `NIFTY1!`) or **BANKNIFTY FUTURES**. (Do not use Spot charts as they lack volume data).
2. **Timeframe:** Optimized for **3 Minutes** or **5 Minutes**.
3. **Inputs:**
* **Target (₹):** Desired profit per lot.
* **Stop Loss (₹):** Max risk per lot.
* **Cooldown:** Number of candles to wait after a trade (Default: 5).
* **Volume Filter:** Uncheck if your data provider does not show Volume on the chart.
**Disclaimer:** This strategy is for educational purposes. Please backtest with your own risk parameters before real trading.

Weekly & Monthly Thresholds + VIX-Based Dynamic TargetsWeekly & Monthly Thresholds + VIX-Based Dynamic Targets
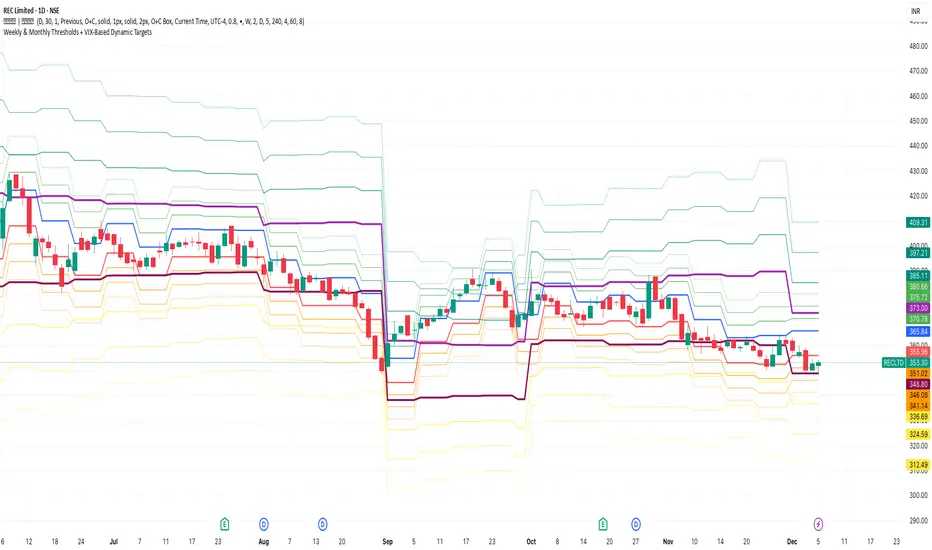
Weekly & Monthly Thresholds + VIX-Based Dynamic TargetsWeekly & Monthly Thresholds + VIX-Based Dynamic Targets

HTF Liquidity Sweep DetectorAn indicator designed to detect liquidity sweeps on Higher Timeframes (HTF), displaying points where price sweeps through the highs or lows of candles on larger timeframes.
Key Features
Supports analysis of 2 timeframes simultaneously (HTF 1 and HTF 2)
Detects both Bullish and Bearish liquidity sweeps
Displays lines and labels with turtle emoji markers
Automatic sweep invalidation system
Customizable line styles, colors, and widths for each HTF
Independent label and turtle emoji display controls
Adjustable label position (Left, Center, Right)
Configurable line extension length
Alert notifications when sweeps are formed
How It Works
Monitors candles on selected higher timeframes
Identifies when price sweeps above previous highs (Bullish Sweep) or below previous lows (Bearish Sweep)
Validates sweep formations and automatically removes invalidated sweeps
Displays sweep lines extending forward with optional labels
Settings
HTF 1 & HTF 2:
Enable/Disable HTF
Timeframe selection
Number of candles to track
Show/Hide sweep lines
Line style (Solid, Dashed, Dotted)
Line width and color
Extend bars length
Show/Hide labels and turtle emojis independently
Label position (Left, Center, Right)
Label size and color
Alerts:
Sweep formation notifications
Use Cases
Identifying liquidity grab zones
Confirming trend reversals
Spotting institutional manipulation patterns
Planning entries after liquidity sweeps

AbunawafAlotabi - Indicators Banner - 33This indicator provides a clean, compact data banner that displays essential technical values directly on your chart.
Instead of opening multiple indicators or cluttering your workspace, this banner shows all important metrics in one organized row.
The banner includes:
• Current Volume (VOL)
• Daily Volume (D-VOL)
• RSI
• MA20
• Stochastic
• ATR
• MACD Line
Each value also uses a dynamic flash-background effect, allowing you to instantly see whether the metric increased or decreased compared to the previous bar.
📌 Important Clarification for Users:
1️⃣ VOL (First Box) – Always based on the current chart timeframe
The first box displays the volume of the current candle, based strictly on the timeframe you are viewing.
• On a 1-minute chart → shows the latest 1-min volume
• On a 15-minute chart → shows the latest 15-min volume
• On a 4-hour chart → shows the latest 4-hour volume
…and so on.
Its background color updates in real time depending on whether the value increased or decreased from the previous bar.
2️⃣ D-VOL (Second Box) – Always based on DAILY volume only
This box shows today’s total daily volume, regardless of which timeframe you are using.
• Even if you view the chart on 1-minute or 5-minute intervals, D-VOL always represents the DAILY timeframe.
• The color will indicate whether today’s volume is higher or lower compared to yesterday.
This separation allows you to track intraday activity (VOL) and overall daily strength (D-VOL) simultaneously.
✨ Why this indicator matters
✔ Quick, clean overview of multiple indicators
✔ Reduces chart clutter
✔ Constantly updates with each candle
✔ Works for day traders, scalpers, swing traders, and investors
✔ Highly customizable in size, spacing, and colors
This indicator does not generate trade recommendations; it simply provides high-clarity technical data to improve your decision-making.
هذا المؤشر يعرض شريطًا معلوماتيًا متكاملًا (Banner) يظهر مباشرة على الرسم البياني، ويقدم قراءة فورية لأهم المؤشرات الفنية دون الحاجة لفتح نوافذ إضافية أو إضافة أدوات متعددة على الشارت.
يعرض المؤشر مجموعة واسعة من القيم الفنية مثل:
• حجم التداول (VOL)
• حجم تداول اليوم الكامل (D-VOL)
• مؤشر القوة النسبية RSI
• المتوسط المتحرك MA20
• مؤشر الاستوكاستك Stochastic
• مؤشر ATR
• خط MACD
ويتميّز هذا المؤشر بأنه لا يكتفي بعرض الأرقام فقط، بل يضيف تأثيرًا بصريًا ديناميكيًا (Flash Effect) يوضح لك لحظيًا ما إذا كانت قيمة المؤشر ترتفع أو تنخفض مقارنة بالشمعة السابقة.
📌 توضيح مهم للمستخدم:
1️⃣ صندوق VOL (أول مربع) – يعتمد على الفاصل الزمني الحالي
يعرض المؤشر في المربع الأول قيمة حجم الشمعة الحالية من نفس الفاصل الزمني الذي تستخدمه الآن.
• إذا كنت على فاصل 1 دقيقة → يعرض حجم آخر شمعة دقيقة
• إذا كنت على فاصل 15 دقيقة → يعرض حجم آخر شمعة 15 دقيقة
• إذا كنت على فاصل 4 ساعات → يعرض حجم آخر شمعة 4 ساعات
وهكذا…
ويتغير لون الخلفية مباشرة عند ارتفاع أو انخفاض الحجم مقارنةً بالشمعة السابقة.
2️⃣ صندوق D-VOL (ثاني مربع) – ثابت من الفاصل اليومي فقط
يعرض هذا المربع حجم التداول اليومي حتى اللحظة،
وهو مستقل تمامًا عن الفاصل الزمني المستخدم في الشارت.
• حتى لو فتحت المؤشر على فاصل 1 دقيقة، سيعرض حجم اليوم كاملًا.
• وحتى لو كنت على الفاصل 4 ساعات أو أسبوعي، يظل صندوق D-VOL يعتمد فقط على بيانات الإطار اليومي.
ويظهر أيضًا بتأثير لوني يوضح إذا كان حجم اليوم ارتفع أو انخفض مقارنةً بيوم الأمس.
✨ لماذا هذا المؤشر مهم؟
✔ يعطيك قراءة سريعة وشاملة للسوق في شريط واحد
✔ يقلل من ازدحام الأدوات على الشاشة
✔ يحدّث كل القيم تلقائيًا في كل شمعة
✔ مناسب للمضارب اليومي، المتداول المتأرجح، والمستثمر
✔ يدعم التحكم في حجم الخط، المسافات، وألوان الخلفية
المؤشر لا يقدم توصية شراء أو بيع، لكنه يوفر أداة قوية ومباشرة تساعدك على تقييم الظروف الفنية للسوق بدقة وسرعة.

Weekly & Monthly Thresholds + Targets (final, fixed)bullish and bearish weekly and monthly range for the whole audience

Weekly & Monthly Thresholds + Targets (final, fixed)with alerts the weekly and monthly bullish and bearish ranges

AbunawafAlotabi - MTF Signals Dashboard - 22This indicator provides an intelligent dashboard that analyzes four powerful technical models across all major timeframes simultaneously, giving you clear market insight without switching charts or stacking multiple indicators.
The MTF panel tracks the following signals:
AA#1 Breakout Signal
Pattern BUY Formation
AA#2 Trend Signal
Golden Volume Activity
All signals are displayed using a clean and minimalistic lamp-style interface (● / ○), covering the most important timeframes:
1M – 5M – 15M – 30M – 1H – 4H – Daily – Weekly
Whenever a signal appears on any timeframe, the Dashboard highlights it instantly with a gentle pulse effect that helps you spot the latest activity with ease.
This tool allows traders to:
Instantly see timeframe alignment and signal confluence.
Understand trend strength through synchronized multi-TF signals.
Improve decision-making with a clear overview of current market behavior.
The indicator does not generate buy or sell recommendations—rather, it provides a refined, visual representation of key price behaviors across all timeframes.
هذا المؤشر يقدم لك لوحة ذكية تقوم بتحليل أربعة نماذج فنية وإشارات مهمة عبر جميع الفواصل الزمنية في نفس اللحظة، مما يمنحك رؤية واضحة عن حالة السوق بدون الحاجة للتنقل بين الفريمات أو إضافة مؤشرات متعددة.
تعتمد لوحة الـ MTF على مراقبة إشارات النماذج التالية:
شمعة الشراء
نموذج Pattern BUY
إشارة الترند AA#2
الحجم الذهبي Golden Volume
وتقوم بجمع نتائج كل نموذج وعرضها على شكل مصابيح (● / ○) داخل جدول جميل، يشمل جميع الفواصل الزمنية الأساسية:
1M – 5M – 15M – 30M – 1H – 4H – Daily – Weekly
عندما تظهر إشارة على أي فاصل زمني، سوف يضيء المؤشر اللمبة الخاصة بالنموذج وال timeframe، مع تأثير نبض خفيف يُظهر آخر إشارة تم تسجيلها، مما يمنحك قراءة مباشرة عن مكان قوة النموذج عبر السوق.
هذه اللوحة تساعد المتداول على:
معرفة توافق الإشارات بين الفواصل الزمنية بسرعة.
تقييم الاتجاه العام من خلال إشارات متعددة في وقت واحد.
تحسين دقة قرار الدخول والخروج عبر رؤية شاملة للحركة الحالية.
المؤشر لا يقدم توصية مباشرة، ولكنه يوفر أداة قوية وبصرية لفهم سلوك السعر عبر جميع الفواصل الزمنية في ثوانٍ.

ACD STRATEGYACD Opening Range Strategy based off of the strategy of Mark Fischer. It trades off the MGC opening range of all 3 sessions (LDN, ASN, NY)

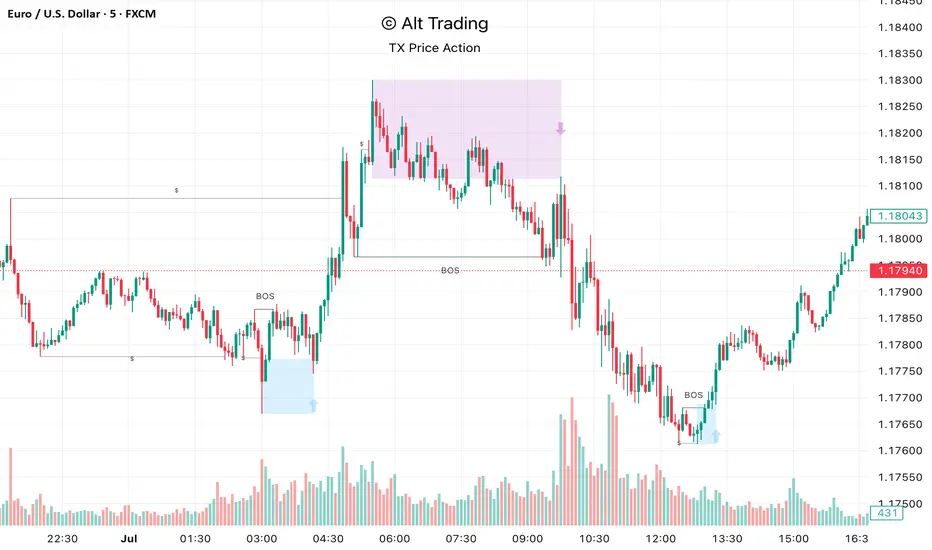
Alt Trading: TX Price Action
The Alt Trading: TX Price Action Indicator is a multi-layered market-structure and liquidity engine built for intraday and swing traders who want a clean, rules-based map of how price is actually moving through liquidity. It runs a fractal-based swing engine in the background to define objective structure, then derives Break-of-Structure (BOS) legs, inducement sweeps, and execution zones from that single model so nothing on the chart is contradictory or “bolted on.” Asian-session profiling builds a dynamic liquidity range that anchors the QuickStrikes filter, allowing you to require BOS and/or entry zones to sit in specific relation to session highs/lows before a setup is even allowed to print. Displacement legs are converted into Fibonacci- and POI-based retracement zones with configurable frequency (High/Medium/Low), automatically projecting forward in time with transparent, non-intrusive boxes for both long and short scenarios. A tiered inducement engine tracks minor (current day), medium (previous day), and major (weekly) highs and lows, promoting levels to permanent lines once they’ve been meaningfully swept, and labeling them directly on the chart for instant context. As sweeps form and BOS confirms, the indicator constructs entry zones, optional risk/reward panels, and live-updating TP/SL visualization boxes that track active long or short scenarios until completion. All elements—zones, BOS lines, inducement levels, fractal structure, arrows, and risk blocks—are fully style-able so the tool can be tuned to any chart theme without losing clarity. TX Price Action doesn’t attempt to “predict” price; instead, it translates complex liquidity behavior into a consistent, visual playbook that makes it easier to systematize premium/discount entries and manage trades with discipline.
Bottom X Candle A script that plots a “Bottom X” label at significant price lows when certain structural conditions are met, with an optional alert.
مؤشر يعرض إشارة Bottom X بشكل لابل أعلى القاع عند ظهور نمط محدد، مع إمكانية تفعيل تنبيه عند تحقق الإشارة.

Percent Change Histogram + MACandle Percent Move Columns with Optional Moving Average
Description:
This indicator calculates the percentage move of each candle over a specified number of bars and displays it as upward-facing columns, regardless of the candle direction. Each column is color-coded based on the candle’s direction—green for bullish, red for bearish. An optional moving average can be overlaid on the percentage values to help visualize trends and smooth out volatility.
Features:
Shows each candle’s percentage move as a column facing upward.
Columns are colored according to candle direction.
Adjustable input for the number of bars used in calculation.
Optional moving average overlay that can be added or removed.
Helps quickly assess volatility and trend strength in percentage terms.
Use Case:
Ideal for traders who want a clear visual representation of individual candle movements in percentage terms, making it easier to spot trends, pullbacks, and volatility patterns across different timeframes.

Bli-Rik : Trend + HTF 34 + HTF RSI Rel + Stoch Filtersprovides you accurate buy and sell signals on 5 mins and 15 mins chart, mainly foe sensex

Golden Volume CandleThis script marks a golden candle when unusual volume activity is detected, offering a distinct visual highlight and alert.
مؤشر يُظهر شمعة ذهبية عند حدوث حركة حجم غير اعتيادية، مع إشارة بصرية واضحة وتنبيه اختياري.

Green Candle - BuyA script that highlights a light green candle whenever specific breakout-based criteria are triggered, including an optional alert.
مؤشر يحدد شمعة بلون أخضر فاتح تظهر عند شروط معينة مرتبطة باختراق سعري، مع تنبيه تلقائي عند ظهور الإشارة.

Pink Trend Candle This script displays a pink candle when a notable trend-related price action condition occurs, providing a clear visual signal and alert.
مؤشر يُظهر شمعة وردية عند حدوث حركة سعرية مميزة مرتبطة بالاتجاه، ويقدم إشارة مرئية وتنبيه فور تحققها.

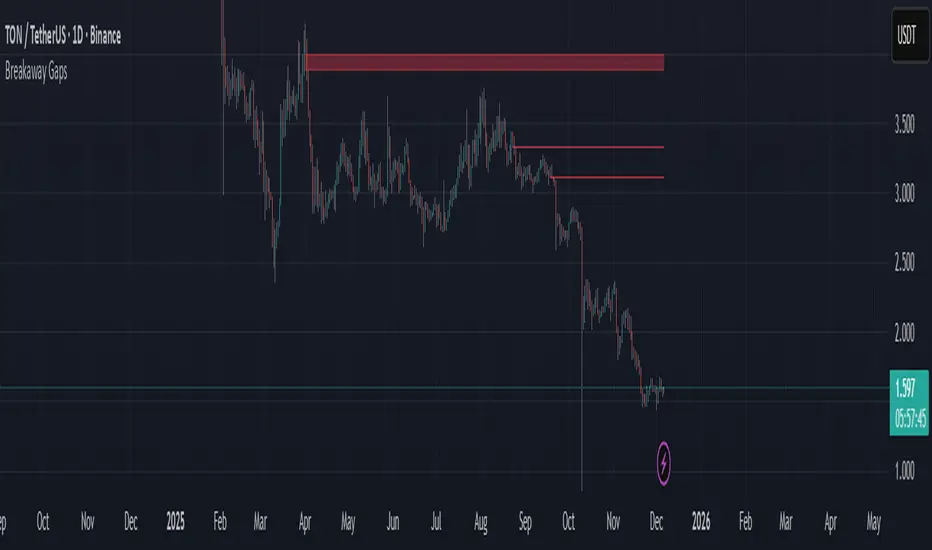
Breakaway Gaps## Breakaway Gaps — Multi-Method Gap & Imbalance Mapping Tool
**Overview**
Breakaway Gaps is a gap-mapping tool designed to highlight areas where price has displaced rapidly and left potential imbalance zones on the chart. It blends multiple detection techniques into one framework, allowing traders to monitor different styles of “breakaway” behavior without clutter or manual drawing.
---
### What the script provides
- **Gap & imbalance zone detection** — identifies areas where price has moved quickly and may have left inefficiencies behind.
- **Breakaway zones** — highlights areas created by strong directional movement or structural shifts in price.
- **Automatic zone management** — highlighted areas extend forward and are removed once price interacts with them, keeping the chart clean.
- **Adjustable behavior** — all major parameters can be tuned: sensitivity, lookback length, displacement thresholds, color themes, and the number of displayed zones.
---
### Why this tool is useful
- Captures different forms of breakaway conditions in a single indicator.
- Helps traders visualize zones that may act as future reaction points, liquidity magnets, or reference areas.
- Designed to keep the chart clean by automatically maintaining and updating all zones.
- Flexible enough to support both discretionary and systematic styles.
---
### What it does *not* do
- Does **not** generate trade signals, entries, exits, stop levels, or position direction.
- Does not predict outcomes or guarantee that any highlighted zone will be respected or filled.
- Should be used as a contextual tool alongside your own analysis and risk management.
---
### Suggested applications
- Identifying potential retracement targets after strong moves
- Marking areas where liquidity may rest or where price may rebalance
- Supporting market structure, breakout, or liquidity-based trading frameworks
- Higher-timeframe context zones combined with lower-timeframe execution
---
### Customization
The tool offers full user control over sensitivity, zoning behavior, highlight style, and display limits, so traders can adapt it to different markets and timeframes.
---
**Disclaimer**
This tool is for chart visualization only. It does not provide financial advice or guaranteed outcomes. Always use proper risk management and your own judgment when trading.
Blue Pattern Candle A simple script that highlights a blue candle when specific technical conditions are met, providing a clean visual BUY signal on the chart.
مؤشر بسيط يعرض شمعة بلون أزرق عند تحقق شروط فنية محددة، مع تنبيه وإشارة شراء واضحة على الرسم البياني.
