QuantMotions - TPR SentinelQuantMotions – TPR Sentinel
The TPR Sentinel Band is a full trade-assistant for discretionary traders.
It combines an adaptive trend engine, directional TPR logic, volume intelligence, ATR-based risk management, a brute-force parameter optimizer, and a modern on-chart UI (entries/TP/SL panel + stats). The goal: fewer fake flips, clearer trend shifts, and visually guided trade management.
1. Core Concept
The Sentinel Line is built from a blend of:
- SMA + EMA
- Midline of highest/lowest high/low (Kijun-style)
- Donchian-style mid close
On top of that, the script calculates a Directional TPR (Time-Price-Ratio):
- Short / medium / long slopes of price
- Normalized by ATR
- Converted into a trend state:
+1 = Uptrend
-1 = Downtrend
0 = Neutral / transition
Hysteresis (Flux) controls how easily the trend flips:
- Higher hysteresis → harder to reverse → fewer fake-outs in chop.
2. Signals, Filters & Volume Intelligence
Signals
- Trend Flip Long: TrendState changes from −1/0 → +1.
- Trend Flip Short: TrendState changes from +1/0 → −1.
Filters
- ADX Filter (optional):
- Only allows trades if ADX is above a chosen threshold.
- Avoids trading in flat, low-energy markets.
R:R Filter:
- Before any signal is accepted, the script checks whether the distance to TP1 is at least the configured Risk:Reward ratio relative to the distance to SL.
- Only if that minimum R:R is reached, a signal becomes valid.
Volume Intelligence & Clouds
- Aggregates up/down volume (optionally across multiple tickers you define).
- Builds Volume Clouds around the Sentinel Line:
a) Positive intensity → buying pressure (bullish cloud).
b) Negative intensity → selling pressure (bearish cloud).
Optional Volume Direction Filter:
- Long only when volume intensity ≥ 0.
- Short only when volume intensity ≤ 0.
3. Risk, Exits & Trailing Stop
The indicator includes a complete exit framework (for visual/manual trading):
Stop Loss Modes
- ATR Fixed: SL placed at a fixed ATR multiple from the entry.
- Trend Line (Dynamic): SL placed directly on the Sentinel Band (structural stop).
Take Profits
- TP1 – “safe target”:
a) Based on ATR distance.
b) Closes a configurable percentage of the position (e.g., 50%).
- TP2 (optional):
Second fixed target used only when Trailing Stop is OFF.
- Trend Runner Mode (Use TP = OFF):
Ignores fixed TP levels and rides the trend until the trend state flips.
Trailing Stop
- Activates after TP1 is hit (if enabled).
- Moves with price at a configurable ATR distance:
a) Long: trail creeps up under price.
b) Short: trail creeps down above price.
- Visually plotted as a purple trail line, dynamically replacing the original SL as the effective exit point.
Each trade is tracked internally and drawn as a green/red box with PnL labels between entry and exit.
4. UI & Stats
Candle Coloring (TRON Theme)
- Cyan = active uptrend & valid environment.
- Orange = active downtrend & valid environment.
Modern Trade Panel (on last bar)
- Live overlay of:
a) Entry
b) TP1
c) TP2
d) SL or active Trail (with dynamic label text: “SL (ATR)”, “SL (Struct)”, “TRAIL”)
Info label shows:
- Historical win rate in the current direction (Long/Short).
- Distance to SL, TP1, TP2 from current price.
- Box color blends from red → green depending on whether price is closer to SL or TP.
Stats Table (Bottom Right)
- Separate stats for Long and Short trades:
a) Win rate (%)
b) Cumulative PnL
Alerts
- Generates JSON alerts on signals, for example: {"side":"buy","ticker":"XYZ","price":123.45}
Perfect for webhooks, bots, or external automation.
5. Brute Force Optimizer (TPR Lab) – Important Limitations
The built-in Optimizer is a numerical helper, not a full strategy optimizer.
What it does:
- Runs brute-force simulations over a sliding window of historical data.
- Scans user-defined ranges for:
- Best Period (“Best Cycle”)
- Best Hysteresis (“Best Flux”)
Uses an efficiency score (average profit per trade) to rank combinations.
Displays results in the bottom-left TRON panel:
- Best Cycle
- Best Hysteresis
- Efficiency Score
What it does NOT optimize or take into account:
- It does not include your actual minimum R:R filter.
- It does not simulate or optimize your Stop Loss modes.
- It does not simulate Trailing Stops.
- It does not use the ADX filter.
- It does not use the Volume filters or Volume Clouds.
Because of this, the suggested “best” Period and Hysteresis are purely computational recommendations based on a simplified internal model.
In real trading, with your full setup (R:R filter, SL mode, Trailing, ADX, Volume confirmation, personal style), other parameter combinations can be superior to what the Optimizer suggests.
You should treat the Optimizer as:
A starting point or a research tool, not the final truth.
Always validate its suggestions visually, in the context of your full system and risk management.
6. Practical Usage
- Works on FX, indices, crypto, commodities – anything with decent liquidity.
- Scalping → use lower Period values, higher responsiveness.
- Swing → use higher Period values, more stability.
Recommended:
- Keep ADX filter ON to avoid dead markets.
- Use Volume Clouds as directional bias.
- Use the Info Panel and Stats to align with your own R:R and risk rules.
Disclaimer
This script is for educational/analytical purposes only and does not constitute financial advice. It does not execute trades or manage your risk automatically. Always combine it with your own strategy, money management, and independent decision-making.
Use the Info Panel and Stats to align with your own R:R and risk rules.
Indicateurs et stratégies

Fair Value Gap Clever ModeThe Pine Script indicator named "Fair Value Gap Clever Mode" is a market structure and supply/demand analysis tool built around concepts popular in the ICT (Inner Circle Trader) methodology, specifically Fair Value Gaps (FVGs) and Order Blocks (OBs).
It automatically identifies, plots, and manages these institutional trading zones on your chart, dynamically removing them once they have been "filled" or mitigated by price action.
Core Functionality and Concepts
The indicator uses classic smart money concepts (SMC) to highlight potential areas of interest for institutional flow:
Fair Value Gaps (FVGs): This is the primary feature. An FVG is an inefficiency in the market where the price moved rapidly in one direction, leaving a gap between the wick of the first candle and the wick of the third candle. The script colors these areas:
Bullish FVGs (potential support/buy zones) are marked with lime green boxes.
Bearish FVGs (potential resistance/sell zones) are marked with red boxes.
Crucially, these boxes are deleted from the chart if the price returns to fill the gap, indicating that the inefficiency has been mitigated.
Order Blocks (OBs): The script also identifies single-candle order blocks that occur within an FVG structure. These represent specific areas where large institutional orders may have been placed.
Bullish OBs (buy zones) are marked with teal boxes.
Bearish OBs (sell zones) are marked with orange boxes.
Unlike FVGs, Order Blocks persist on the chart for a fixed duration (obExtendBars = 15 bars) and are used as more precise entry points within the broader FVG zone.
Market Structure Shifts (BoS and ChoCH): The script tracks swing highs and lows and plots lines to indicate shifts in market structure:
Break of Structure (BoS): When the price confidently breaches a previous swing high (in an uptrend) or swing low (in a downtrend), it confirms the continuation of the current trend direction. These are marked with dotted lines.
Change of Character (ChoCH): When the price breaks a swing point that runs counter to the prevailing immediate structural bias, it signals a potential reversal or significant shift in trend. These are marked with solid lines.
How to Use It
This indicator is a powerful visualization tool for traders using SMC principles:
Identify Trade Setups: Look for price action to return into the marked FVG or OB zones. These zones act as magnets for price and often serve as precise entry points for trades in the direction of the overall market structure.
OANDA:BTCUSD OANDA:EURCHF OANDA:AUDJPY TVC:USOIL CITYINDEX:GBPMXN OANDA:XAUUSD
Confirm Mitigation: The automatic deletion of FVGs is a key feature. An unfilled FVG indicates an imbalance that the market is likely to revisit; a filled gap is a 'used' zone that is less likely to hold subsequent moves.
Gauge Trend Strength: Use the BoS (Break of Structure) lines to confirm trend health and the ChoCH (Change of Character) lines to watch for potential reversals.

Clever Tendency Prognosticate V2.0This Pine Script indicator, named "Clever Tendency Prognosticate V2.0", is a comprehensive trend analysis tool that uses a system of four Exponential Moving Averages (EMAs) to identify and visualize market trends across multiple timeframes. It is designed to be highly visual, providing a clear indication of trend direction directly on the price chart.
Core Functionality
The indicator's primary mechanism for trend detection is the relative position of four key EMAs:
Fast EMA (9-period by default)
Medium EMA (21-period by default)
Slow EMA (50-period by default)
Long EMA (200-period by default)
It determines a clear uptrend when all EMAs are stacked in ascending order (Fast > Med > Slow > Long), and a clear downtrend when they are in descending order (Fast < Med < Slow < Long).
Any other configuration is considered a sideways trend.
Key Visual Features and Outputs
Colored EMAs: The four moving average lines change color based on the detected trend. By default, they appear lime in an uptrend, red in a downtrend, and yellow when sideways.
Colored Price Bars: The background of the price bars can optionally be colored based on the current trend (lime/red/yellow).
Buy/Sell Signals: The indicator plots "BUY" (triangle-up) and "SELL" (triangle-down) signals on the chart precisely when the trend changes from sideways/down to up, or sideways/up to down, respectively.
Sideways Start Indicators: It marks the point where a strong up or down trend transitions into a sideways market with small "SIDE" arrows.
Volume Analysis: It plots standard volume bars with an optional trend-colored background.
Multi-Timeframe (MTF) Analysis: The script requests and displays the trend status of the asset on multiple timeframes (Daily, 4-Hour, 1-Hour, and 15-Minute) using request.security(). The remaining part of the code likely renders these as labels on the chart.
Alerts: Users can set up real-time alerts for the generated "Trend Buy Signal" and "Trend Sell Signal" directly within their TradingView account.
How to Use It
This indicator is best used as a confluence tool for trend trading.
Confirmation: Look for trade entries that align with the overall multi-timeframe trend indicated by the various colored labels.
Entry Signals: The "BUY" and "SELL" plots suggest potential points where a new strong trend is beginning.
Risk Management: The 200-period EMA (Long MA) often serves as a key support/resistance level and a potential stop-loss area.
OANDA:XAUUSD OANDA:USDCNH OANDA:BTCUSD CITYINDEX:GBPMXN OANDA:EURUSD TVC:USOIL OANDA:AUDJPY OANDA:EURCHF

3 EMA TRONG 1-NTT CAPITALThe 3 EMA in 1 NTT CAPITAL indicator provides an overview of the market trend with three EMAs of different periods, helping to identify entry and exit points more accurately, thus supporting traders in making quick and effective decisions.

Sector Monitor✅ Custom Index Strength
Key Features:
Custom Indices: It mathematically combines stocks (like HDFC + ICICI + Kotak) to create a synthetic "Private Bank Index" that you can't find anywhere else. (Note all the stocks are Equal weighted)
Performance Tracking: Shows how much a sector has moved over 1 Day, 1 Week, 1 Month, etc.
RRG (Relative Rotation): A smart algorithm that tells you if a sector is leading the market or falling behind.
Understanding the "RRG" (Relative Rotation Graph)
This is the most powerful column in the table. It compares the sector against a benchmark (usually Nifty 500 EW) to tell you the "Health" of the trend.
It classifies every sector into one of four phases , similar to a clock cycle:
💚 Leading (Strong Trend): The sector is outperforming Nifty and momentum is strong. This is where the bulls are.
💛 Weakening (Taking a Breath): The sector is still strong, but it is starting to slow down. It might be time to book profits or wait.
❤️ Lagging (Weak Trend): The sector is underperforming. It is weak and losing money compared to the market. Avoid these.
💙 Improving (Waking Up): The sector was weak, but momentum is coming back. This is often where new trends start.
✅ RRG explained
Relative Strength (RS): how the sector is doing versus the benchmark today. RS = sector price divided by benchmark price.
Strength (X-axis): compare today’s RS with RS from (default 20) days ago . If today’s RS is higher than 20 days ago → Positive strength; lower → Negative.
Momentum (Y-axis): compare today’s RS with RS from (default 5) days ago . If today’s RS is higher than 5 days ago → Improving; lower → Worsening.
Numeric walk-through
Assume benchmark = 100 today, 95 (5D ago), 90 (20D ago).
Assume sector = 110 today, 100 (5D ago), 95 (20D ago).
RS today = 110 ÷ 100 = 1.10.
RS 5D ago = 100 ÷ 95 = 1.0526.
RS 20D ago = 95 ÷ 90 = 1.0556.
Strength (today vs 20D ago): RS moved from 1.0556 to 1.10 → about +4.2% → Positive.
Momentum (today vs 5D ago): RS moved from 1.0526 to 1.10 → about +4.5% → Improving.
Label: Positive + Improving = Leading.
Quick examples for each quadrant
(numbers are RS values; you can imagine each came from “sector ÷ benchmark”)
Leading (Positive & Improving)
RS(20D) 1.00 → RS(today) 1.10 ⇒ Strength +10% (Positive)
RS(5D) 1.05 → RS(today) 1.10 ⇒ Momentum +4.8% (Improving)
Weakening (Positive & Worsening)
RS(20D) 1.00 → RS(today) 1.08 ⇒ Strength +8% (Positive)
RS(5D) 1.12 → RS(today) 1.08 ⇒ Momentum −3.6% (Worsening)
Improving (Negative & Improving)
RS(20D) 1.05 → RS(today) 0.98 ⇒ Strength −6.7% (Negative)
RS(5D) 0.95 → RS(today) 0.98 ⇒ Momentum +3.2% (Improving)
Lagging (Negative & Worsening)
RS(20D) 1.00 → RS(today) 0.90 ⇒ Strength −10% (Negative)
RS(5D) 0.95 → RS(today) 0.90 ⇒ Momentum −5.3% (Worsening)
✅ 3. How to Use the Settings (Inputs)
When you open the settings menu, here is what each section controls:
Theme / Colors
Dark Mode: Check this if you use a dark background on Trading View.
Light Mode Theme: Choose between "Blue & Purple" or standard "Green & Red" for Up/Down colors.
RRG Settings
RRG Benchmark: What are we comparing our sectors to? usually, this is NIFTY 500 EW.
If Nifty is up 1% and your sector is up 2%, your sector is "Leading."
RS Period (Score): How far back do we look to check strength? (Default: 20). Lower numbers make it react faster; higher numbers make it smoother.
Momentum Lookback: How fast is the trend changing? (Default: 5).
Table Settings
Show Col 1 / 2 / 3: You can choose to see up to 3 timeframes plus the RRG column.
Timeframes (1D, 1W, 1M...): Set these to match your trading style.
Day Trader: Set Col 1 to 1D (1 Day) and Col 2 to 1W (1 Week).
Investor: Set Col 1 to 1M (1 Month) and Col 2 to 6M (6 Months).
Sort By: This is crucial. You can sort the table by "RRG" (to put the strongest sectors at the top) or by "Column 1" (to see today's biggest gainers).
Rows Shown: Limit the table to the "Top 10" or "Top 20" if the table is too big for your screen.
Symbol Selection
This is where the magic happens. The script comes pre-loaded with groups like "NBFC," "Housing Finance," etc.
Checkbox: Turn a specific sector ON or OFF in the table.
Input Box: You can actually edit the stocks!
Example: The input might look like NSE:TCS+NSE:INFY.
If you want to add Tech Mahindra, you simply add +NSE:TECHM to the text. The indicator will instantly recalculate the sector based on your new list.
✅ 4. Adjusting Inputs for Your Time Horizon
The logic is simple:
Lower Numbers: Make the indicator faster and more sensitive. It reacts quickly to price jumps but creates more "noise" (false signals).
Higher Numbers: Make the indicator slower and smoother. It filters out small corrections but reacts late to new trends.
Short-Term (Intraday / Fast Swing)
Recommended Inputs: Strength 10 | Momentum 3
Why: You need speed. By lowering the Strength to 10 days and Momentum to 3 days, the RRG will react instantly to sudden bursts of buying.
Best For: Catching "Micro-Rotations" (e.g., a sector suddenly waking up for a 2-3 day rally).
Trade-off: You will see sectors jump between "Leading" and "Weakening" very frequently.
Medium-Term (Standard Swing Trading)
Recommended Inputs: Strength 20 | Momentum 5 (Default)
Why: This is the "Goldilocks" zone. It ignores the daily noise but is fast enough to catch a trend that lasts for a few weeks.
Best For: Identifying the main theme of the current month.
Trade-off: Balanced. It might be slightly too slow for scalpers and slightly too fast for multi-year investors.
Long-Term (Position Investing)
Recommended Inputs: Strength 60 | Momentum 15
Why: A strength lookback of 60 (approx. 1 quarter) ensures you are only looking at major structural trends. A momentum of 15 ensures that a 2-day drop doesn't scare you out of a "Leading" sector.
Best For: Building a portfolio to hold for 6–12 months. If a sector is "Leading" here, it is in a massive bull run.
Trade-off: Very slow. By the time a sector turns "Leading," the trend has already been established for a while.
✅ 5. The "Secret" Tooltip Feature
Don't forget to hover your mouse cursor over the RRG Status text in the table (e.g., over the word "Leading").
A detailed box will appear showing:
Math: Exact Strength and Momentum scores.
Strategy: A text advice (e.g., "Trend is strong. Look for breakouts").
Constituents: The exact list of stocks used to calculate that sector's performance. This saves you from having to guess which stocks belong to that group.

Dual MA Crossover with Profit Targets + Stop-LossChatGPT script and is a dual moving average crossover script with profit targets and stop loss

LS_mas_V1Itsy Bitsy Spider:
The itsy bitsy spider
Climbed up the water spout.
Down came the rain
And washed the spider out.
Out came the sun
And dried up all the rain.
And the itsy bitsy spider
Climbed up the spout again.
2
Wheels on the Bus:
The wheels on the bus go round and round,
All through the town,
The front wheels go round and

Master Indicator (Sessões + DWM + Lookback)Developed to track sessions in Asia, London, and New York.
With it, you can track the highs and lows of the sessions, as well as their captures.
You will also be able to view the highs and lows of days, weeks, and months in as many periods as you want.
All functions can be viewed in specific timeframes; adjust as needed for your trading strategy.
Finally, you will also have the option to configure midnight open and true day open.

Trade Setup A+ Full System [XAUUSD]🚀 Trade Setup A+: Liquidity Hunter System
This indicator is designed for XAUUSD (Gold) scalping and swing trading, combining Smart Money Concepts (SMC) with Price Action. The system focuses on high-probability setups by identifying where major liquidity resides.
💎 Key Features:
Auto Order Blocks: Automatically draws Bullish (Green) and Bearish (Red) Order Blocks from 4H/1H timeframes.
Liquidity Levels: Displays Previous Day High (Old High) and Previous Day Low (Old Low) to identify liquidity sweeps.
Trend Filter: Includes a color-coded EMA 14 for 5m momentum confirmation.
Macro Time Zones: Highlights high-volume trading sessions (Asia, London, NY) directly on the chart background.
📈 How to Trade:
SELL: Wait for price to reject a Bearish Order Block or sweep the Old High. Confirm with a break below EMA 14 (5m).
BUY: Wait for price to reject a Bullish Order Block or sweep the Old Low. Confirm with a break above EMA 14 (5m).
Best Times: Focus on highlighted Macro Times (colored background) for better volatility.
⚠️ Disclaimer: This tool is for educational purposes only. Always use proper risk management.
ระบบเทรด "Setup A+" ที่ออกแบบมาเพื่อการเก็งกำไรในทองคำ (XAUUSD) โดยเฉพาะ โดยเน้นความแม่นยำสูง (High Probability) และ Risk Reward Ratio (RR) ที่คุ้มค่าค่ะ
ระบบนี้ผสมผสานระหว่าง Smart Money Concepts (SMC) และ Price Action เพื่อหาจุดที่รายใหญ่เข้าตลาด โดยมีหลักการสำคัญคือ "ตามรอยสภาพคล่อง (Liquidity)" ค่ะ
💎 ทำไมต้องระบบนี้? (Key Concepts)
ตลาดไม่ได้เคลื่อนที่แบบสุ่ม แต่เคลื่อนที่เพื่อไปหา Liquidity (สภาพคล่อง) เสมอค่ะ
ล่า Stop Loss: ก่อนกราฟจะกลับตัวจริง มักจะวิ่งไปกิน Stop Loss ของรายย่อยที่ Old High หรือ Old Low เสมอ
Order Block: เราจะเข้าเทรดในจุดที่ "เจ้ามือ" วางเงินก้อนใหญ่ไว้
Macro Time: เทรดเฉพาะช่วงเวลาที่มี Volume จริงเท่านั้น เพื่อลดการติดดอยและรอราคานาน
🛠️ เครื่องมือที่ใช้ (System Tools)
Auto Order Block: กล่องโซนซื้อขาย (Supply & Demand) จาก Timeframe 4H/1H
Old High / Old Low: เส้นราคา High/Low ของวันก่อนหน้า (จุดดักกิน SL)
EMA 14: เส้นแบ่งทิศทาง Momentum ระยะสั้น (ใช้ใน TF 5m)
Macro Time Zones: แถบสีบอกช่วงเวลาเทรด (Killzones)
📋 กฎการเทรด (Trading Rules)
คู่เงิน: XAUUSD (Gold) Timeframe วิเคราะห์: 4H, 1H Timeframe เข้าออเดอร์: 5m, 15m Winrate คาดหวัง: 80-90% (เมื่อรอ Setup ที่สมบูรณ์)
⏰ ช่วงเวลาเทรด (Macro Time - GMT+7)
เน้นเทรดช่วงที่กราฟวิ่งแรง (Expansion) เพื่อจบงานไวค่ะ:
07:00 - 09:00 (Asia)
14:00 - 15:30 (London Open)
17:00 - 19:00 (London/NY Overlap - แรงสุด)
23:00 - 00:30 (NY PM)
⚠️ เลี่ยงช่วง 20:30 - 22:00 (NY Open) เพราะกราฟมักสบัดหลอกค่ะ

Universal_Position Size Calculator_by PaulinusFTMO Position Size Calculator - Professional Risk Management Tool
The ultimate position sizing calculator designed specifically for FTMO traders and professional risk managers.
🎯 What Does This Indicator Do?
This powerful calculator automatically determines the exact lot size you should trade based on your account size, risk tolerance, and stop loss distance. No more manual calculations or guesswork - just enter your trade parameters and get instant, accurate position sizing.
✨ Key Features
📈 Two Calculation Methods:
Entry/Stop Price Method: Enter your exact entry and stop loss prices - perfect for planned trades
Stop Loss Pips Method: Simply enter your stop loss distance in pips - ideal for quick calculations
💰 Complete Risk Management:
Calculates precise position size in lots
Shows actual dollar risk amount
Displays potential profit based on your risk:reward ratio
Automatic risk percentage calculation
Real-time updates as you adjust parameters
🌍 Multi-Asset Support:
Cryptocurrencies: BTC, ETH, XRP, LTC, BCH, BNB, ADA
Forex Pairs: All major and cross pairs (EUR/USD, GBP/USD, USD/JPY, etc.)
Commodities: Gold (XAU/USD), Oil (USOIL)
Indices: US30, US100, SPX500
🎨 Professional Interface:
Clean, easy-to-read table display
Customizable position (9 locations on chart)
Adjustable text size (Tiny, Small, Normal, Large)
Toggle detailed breakdown on/off for simplified view
Visual entry, stop loss, and take profit lines on chart
🔧 FTMO-Optimized:
Pre-configured with accurate FTMO contract specifications
Built-in contract sizes for all supported instruments
Minimum lot size requirements automatically applied
Perfect for FTMO Challenge and Verification phases
📋 How To Use
Method 1: Entry/Stop Price
Select your trading pair
Enter your account balance
Set your risk percentage (typically 1-2% for FTMO)
Choose your risk:reward ratio (e.g., 1:2, 1:3)
Enter your planned entry price
Enter your stop loss price
Get instant position size in lots!
Method 2: Stop Loss Pips
Select your trading pair
Enter your account balance
Set your risk percentage
Choose your risk:reward ratio
Enter your stop loss distance in pips
Get instant position size in lots!
📊 What You'll See
Essential Information (Always Visible):
Trading Pair
Account Balance
Risk Percentage
Risk Amount in Dollars
Target Profit Ratio
POSITION SIZE IN LOTS ⬅️ Your main result
Detailed Breakdown (Optional):
Entry Price / Stop Loss / Take Profit
Stop Loss Distance in pips
Contract Size
Actual Risk Amount
Potential Profit in Dollars
🎓 Perfect For:
✅ FTMO Challenge traders
✅ Prop firm traders
✅ Professional risk managers
✅ Swing and day traders
✅ Anyone who wants consistent position sizing
✅ Traders working on passing funded accounts
💡 Why Use This Calculator?
Eliminate Calculation Errors: No more spreadsheets or manual math - get accurate results instantly.
Stay Consistent: Maintain proper risk management on every single trade.
Save Time: Calculate position sizes in seconds, not minutes.
Protect Your Capital: Never risk more than your intended percentage.
Maximize Efficiency: Focus on trading, not calculating.
⚠️ Important Notes
This calculator uses standard FTMO contract specifications
Always verify lot sizes with your broker before placing trades
Recommended risk per trade: 1-2% for FTMO accounts
The calculator rounds to minimum lot sizes automatically
Visual lines only appear when using Entry/Stop Price method
🔒 Professional Tool
This is a protected indicator with clean, optimized code designed for serious traders who value accuracy and efficiency.
📝 Settings Guide
Table Position: Choose where the calculator appears on your chart
Table Text Size: Adjust for your screen and preference
Calculation Method: Switch between price-based or pip-based calculations
Account Balance: Your total account size
Risk Per Trade: Percentage you're willing to risk (0.1% - 5%)
TP Risk:Reward Ratio: Your target profit ratio (e.g., 2 = 1:2 RR)
Show Detailed Breakdown: Toggle extra information on/off
🚀 Start Trading With Confidence
Stop guessing your position sizes. Start using professional risk management today.
⭐ If this indicator helps your trading, please leave a review and share it with fellow traders!
By Paulinus © 2025

ICT Power Of Clever V2.0 | CLEVER“ICT Power Of Clever V2.0 | CLEVER”**
This script is a full PO3 (Accumulation → Manipulation → Distribution) engine based on ICT concepts, but implemented in a highly automated, state-machine style. It actively scans for PO3 cycles, validates them with ATR-based volatility thresholds, and then auto-generates entries, exits, alerts, and visual zones.
CITYINDEX:GBPMXN CITYINDEX:GBPMXN OANDA:BTCUSD OANDA:USDCNH OANDA:XAUUSD
Let’s break it down in an intuitive way.
What the Indicator Is Built to Detect
The indicator tracks the classic ICT “Power of Three” cycle:
Accumulation
A range-bound price compression phase.
Manipulation
A breakout above or below that range, large enough to qualify as a “stop hunt”.
Distribution / Return to Value (Entry)
After manipulation is confirmed, the script enters in the opposite direction, assuming price will correct back inside the range.
snapshot
EURUSD
USOIL
BTCUSD
🎯 1. Accumulation Phase
The indicator constantly checks the last X bars for tight price compression using:
Highest high of the range
Lowest low of the range
ATR × custom multiplier to qualify the range as “small enough”
The accumulation parameters change automatically based on Algorithm Mode:
Mode Accumulation Length Accumulation Size
Small Manipulation High (40 bars) Large ATR limit
Short Accumulation Low (11 bars) Small ATR limit
Big Manipulation Low (11 bars) Large ATR limit
When a valid accumulation forms, the script:
✔ marks start and end indexes
✔ expands the top/bottom by a small ATR amount
✔ draws a visual accumulation box (if enabled)
⚡ 2. Manipulation Phase
Once price breaks out past the accumulation box, the script checks if the breakout is:
A wick breakout
Or a candle-close breakout (based on user setting)
Then the code verifies:
Was the breakout large enough?
It checks if the breakout exceeded the accumulation boundary by:
➡ ATR × manipulationATRMult
If yes, manipulation direction becomes either:
Bullish manipulation → expect a short entry
Bearish manipulation → expect a long entry
Then a manipulation box is drawn.

Target Trend Stoploss✅ How To Trade — Step-By-Step
📌 1️⃣ First decide the market condition
Before taking any trade, check:
Market Type How to identify Your Action
🟢 Trending Price above EMA200 (uptrend) / below for downtrend Trade with trend direction only
🔵 Range EMAs flat & price swinging both sides Skip trading or switch to range strategy
If price is near EMA200 → Avoid (because reversal or whipsaw likely).
📌 2️⃣ Mark your Entry Setup
Wait for:
1️⃣ Trend Direction confirmed
2️⃣ A pullback into support/resistance
3️⃣ Signal from your indicator (arrow / breakout)
Example Long Setup:
✔ Price above EMA200
✔ Pullback to EMA80 or trendline
✔ Bullish candle closes strong
✔ Indicator gives UP signal
Example Short Setup:
✔ Price below EMA200
✔ Pullback up to resistance
✔ Bearish confirmation
✔ Indicator gives DOWN signal
👉 NO SIGNAL = NO TRADE
(Do not try to guess the market)
📌 3️⃣ Calculate Risk & Position Size
Always risk 1–2% maximum per trade.
SL goes:
Below swing low (in uptrend)
Above swing high (in downtrend)
🎯 Your script already gives:
Entry (close price)
SL line
TP1, TP2, TP3 targets
📌 4️⃣ Take Profit Strategy
Follow this rule:
Target Action
TP1 Book 50% profits, move SL to breakeven
TP2 Book 30–40%
TP3 Let runner trail with trend
This way:
Even if trend reverses after TP1 → no loss trade
📌 5️⃣ Exit When Opposite Signal Comes
❌ Incorrect: Holding hoping it will return
✔ Correct: Exit when:
SL hit ❌
Trend changes & opposite arrow appears 🔁
Price closes beyond EMA200
📈 Trade Checklist (Use Before Entering)
✔ What is trend? (Up/Down/Flat?)
✔ Is there a clear swing point?
✔ Did indicator give a valid signal?
✔ Is reward > risk? (Min 1:2 RR)
✔ Not near major news event?
✔ Position size correct?
If any ❌ → Skip the trade

DS Gurukul round up Bank 75Roundup (Support & Resistance Indicator) For Bank Nifty
By DS Gurukul
Version : 2.0
To be used only for Bank Nifty.
Indicator Overview
The Round Figure Indicator identifies key psychological support and resistance levels based on round numbers. These levels often act as strong turning points in price action due to trader psychology and institutional order placement.
How It Works
Key Levels:
Mid Band (Black Solid Line): Major round number
Upper Band (Green Solid Line): Mid Band (resistance)
Lower Band (Red Solid Line): Mid Band (support)
Sub-Bands (Dotted Lines): ±0.10 levels for tighter zones
Alerts: Triggers when price touches any band, signaling potential reversals or breakouts.
Trading Strategy
✅ Bounce Trades:
Buy near Lower Band or Mid Sub-Lower with bullish confirmation (e.g., hammer candle).
Sell near Upper Band or Mid Sub-Upper with bearish rejection (e.g., shooting star).
✅ Breakout Trades:
Enter long on a close above Upper Band with volume.
Enter short on a close below Lower Band with momentum.
⚠️ Risk Management:
Place stops just beyond the opposite sub-band.
Avoid trading if price is stuck between mid/sub-bands (choppy market).
Why It Works
Round numbers attract limit orders (support/resistance).
Institutions use these levels for stop placements and profit targets.
Works across all timeframes (scalping to swing trading).
🔔 Tip: Combine with RSI/MACD for higher-probability trades!

range calculation and targetsrange calculation and targets for everyone with targets both bullish and bearish

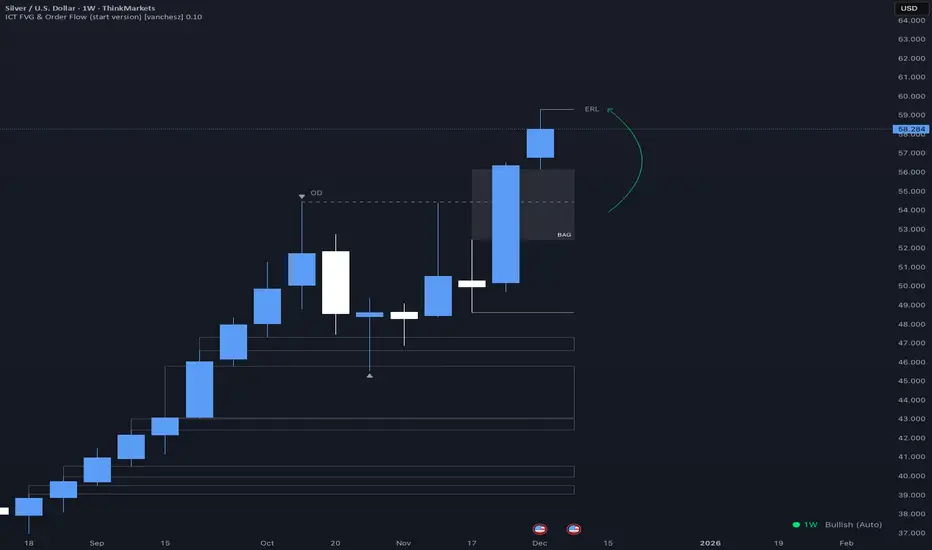
ICT FVG & Order Flow (start version) [vanchesz]Overview
Master liquidity with precision. This indicator brings the iCT trading concept to life by automatically detecting liquidity pools, fair value gaps, and key swing points. It shows you exactly where price is likely to move next — from Internal Range Liquidity (IRL) to External Range Liquidity (ERL). With built-in multi-timeframe validation, it helps you stay one step ahead of the market.
Concept
Markets move where liquidity is. According to iCT theory, price usually sweeps internal liquidity (IRL) first and then hunts for external liquidity (ERL). By mapping this process in real time, the indicator provides a clear framework for understanding market structure, liquidity grabs, and directional bias.
High Probability Leg
Context States
Key Features
Detects the High-Probability Leg (HPL) — the leg containing a fair value gap (FVG)
Highlights unmitigated FVGs within the current context.
Marks swing points (SP), IRL levels, and ERL targets automatically.
Identifies IRL rejections when liquidity is taken inside the leg
Multi-timeframe sweep check – if a single candle takes both IRL and ERL, the indicator zooms into a lower timeframe to confirm which liquidity was swept first
Flexible settings for swing points, look back bar count, depth, colors, and style
How to use
Start from the monthly chart to define the macro trend.
Analyze the latest order flow leg:
Bullish FVG = bullish context, Bearish FVG = bearish context
Step down to the daily timeframe and repeat the analysis.
Wait for price to reject from IRL (the indicator highlights it automatically).
Drop to a lower timeframe for entries — use timeframe alignment to select the right LTF.
Enter with the FVG model, targeting liquidity within the leg.
Place take profit inside the context — e.g., never above ERL(in a bullish setup).
Pro version gives you
Alerts for all context events (New context, New FVG, IRL rejection, Context failing by 2CR, ERL/SP sweep
Check of context failing by 2CR (two candle rejection)
Suggestions for every context state
This indicator is provided solely for educational and informational purposes.
It does not constitute financial advice, trading signals, or a recommendation to buy or sell any instrument.
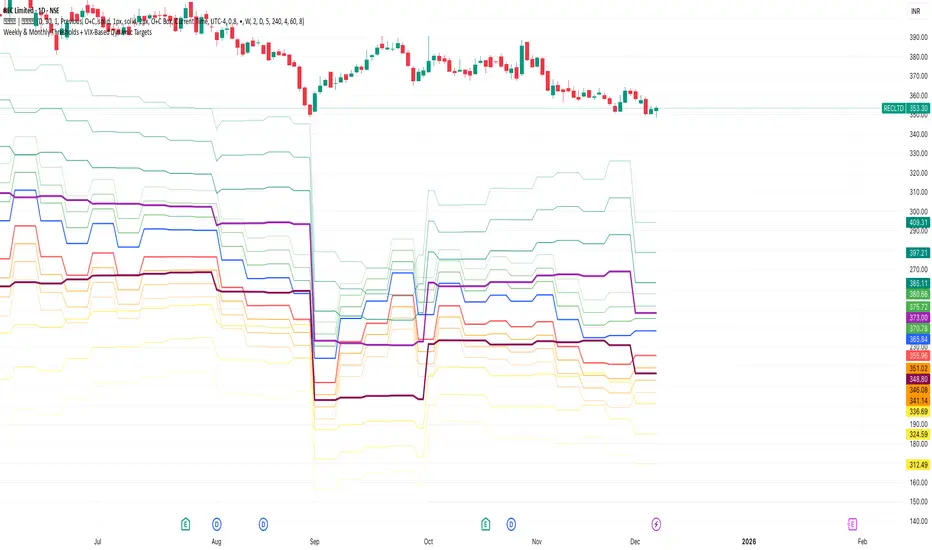
Weekly & Monthly Thresholds + VIX-Based Dynamic TargetsWeekly & Monthly Thresholds + VIX-Based Dynamic Targets
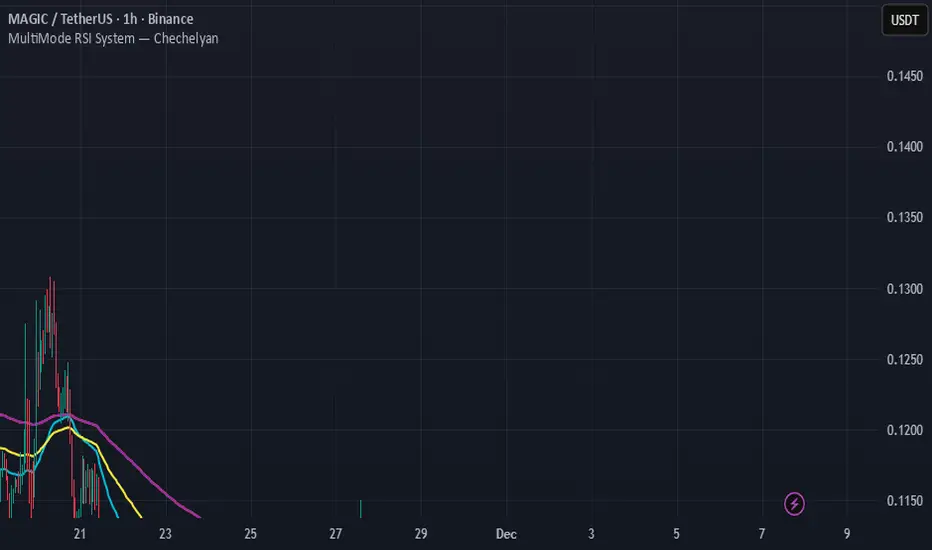
MultiMode RSI System — ChechelyanMultiMode RSI System is an advanced market analysis tool built on the classic RSI indicator.
The system includes multiple calculation modes, additional filters, and extended signal logic designed to help users evaluate market conditions in different phases of price movement.
The indicator provides:
several RSI calculation modes;
dynamic levels;
on-chart signal markers;
trend and range filters;
customizable visual settings.
This tool is intended solely for analytical and visual market assessment.
It is not a trading or financial advice.
EMA SMA Rhythmic Lite Public V1.0 by SRT📌 EMA SMA Rhythmic Lite Public V1.0 by SRT
A clean, fast, non-repainting trend-rhythm indicator designed for swing traders, reversal reads, and structure-based entries. Built on fixed EMAs + SMAs, it offers Engulfing Bars (EB), Long-Tail Body (LTB) signals, rhythmic Flush Dots, and a real-time Bias Table.
Perfect for traders who want clear directional guidance without clutter or over-optimization.
🔶 Key Features
1. Fixed MA Rhythm Engine
MA1: EMA
MA2: EMA
MA3: SMA
MA4: SMA
Stacking forms the core “trend rhythm” for quick bias reading.
2. Engulfing Bars (EB) — Non-Repainting
Detects previous bar only, filters weak signals using ATR size and minimum body %. Outputs EBull and EBear with 20-label cap.
3. Long-Tail Body (LTB)
Identifies exhaustion/reversal areas with tail % thresholds, body position filters, optional body size filter, and ATR thresholds. Produces LTB Bull and LTB Bear.
4. MA Flush Dots
Rhythmic compression markers: bullish at the bottom, bearish at the top — ideal for spotting MA squeezes and momentum resets.
5. Bias Table (Top-Right)
Compact real-time sentiment showing:
MA Bias (Bullish / Bearish / Neutral)
LTB presence (Yes / No)
🔶 Alerts Included
Signal Bar Formed
Bullish Combo
Bearish Combo
All non-repainting (previous bar logic).
🔶 Ideal For
Swing traders
Trend continuation setups
Reversal exhaustion reads
Structure-based entries
Clean, non-spammy signals
🔶 Premium Version Intro
For traders seeking the full rhythm engine, consider the EMA SMA Rhythmic Trend Premium V1.0 by SRT.
It includes advanced rhythm alerts, enhanced LTB logic, optional EMA/SMA dynamic switching, extra visualization features, and customizable MA stacking, providing a comprehensive toolset for serious trend and reversal strategies.
🔶 Notes
Fully non-repainting
Flush markers, labels, and MA visibility are fully user-controlled
Code is locked to preserve original logic and prevent redistribution
Enjoy the rhythm.
- SRT

XAUMO MegaBar VSA by Mohamed Mahmoud XAUMO MegaBar VSA — Smart Money Breakout & Reversal Engine for XAUUSD
(Educational Use Only)
1) WHAT THIS INDICATOR DOES
XAUMO MegaBar VSA is an institutional-style smart money engine for XAUUSD designed to show you what professional money is doing, not just where price is moving.
It combines:
- MegaBar detection on 1H and 15m
- VSA (Volume Spread Analysis) events
- VPOC / WVPOC and volume clusters
- Liquidity sweeps, CHoCH, order blocks, FVGs
- Full Fibonacci leg mapping (retracements + extensions)
- Pre-built execution ladders (Entry, SL, TP1–TP4, Reverse Fib trades)
All in one dashboard with:
- Color-coded candles
- Clean, ATR-offset labels
- Optional tables and debug panels
So traders can quickly decide:
“Is this move driven by smart money, or is it just noise?”
2) CORE MODULES & FEATURES
A) SESSION + ACCUMULATION / DISTRIBUTION CONTEXT
- Session filter: London, New York, Overlap, or custom.
- Accumulation / distribution zones shaded on chart with adjustable colors/opacity.
- Quick legend so you always know if the market is in “smart money accumulation” or “distribution”.
HOW TRADERS USE IT:
Focus only on your trading session and instantly see if volume is building (accumulation), unloading (distribution), or flat. This helps you avoid trading in dead liquidity.
--------------------------------------------------
B) MEGABAR ENGINE + FIB MAP
- Automatically detects “MegaBars” (institutional candles) on 15m and 1H.
- Uses body size, range, and volume to pick only meaningful bars.
- Builds a full Fibonacci map from each active MegaBar:
• Retracements: 0, 13, 23.6, 38.2, 50, 61.8, 78.6, 86.2, 100, and -33.
• Extensions: 125% up to 600%+ (configurable ladder).
- Per-level style controls:
• Color, width, line style (solid/dotted/dashed).
• Optional price labels with ATR-based offsets.
- Main Fib legend that explains shallow / normal / deep reload zones.
HOW TRADERS USE IT:
You stop guessing where to buy or sell. You trade around the institutional leg:
- Buy dips into defined reload zones after bullish MegaBars.
- Sell rallies into extension zones after bearish MegaBars.
- Use clean, pre-mapped structure for both scalps and swings.
--------------------------------------------------
C) VSA ENGINE + CANDLE LABELING
- Detects a full set of VSA events such as:
• No Demand / No Supply
• Stopping Volume
• Absorption
• Springs / Upthrusts
• Buying Climax / Selling Climax
• Bullish / Bearish EVR
• Tests and confirmed VSA signals at S/R
- Enhances with:
• Body vs total range analysis
• Wick dominance for exhaustion vs aggression
• Momentum and volume confirmation filters
HOW TRADERS USE IT:
Each label becomes a “comment” from smart money on the chart:
- “No Demand” near resistance + weak RVOL = skip long entries.
- “Stopping Volume” + spring at Fib reload zone + VPOC cluster = potential high-quality long.
- Combine VSA with the MegaBar Fib map and volume profile for structured decisions.
--------------------------------------------------
D) SUPERSONIC BREAKOUT ENGINE
- Calculates a breakout strength score using:
• RVOL and volume expansion
• Spread expansion vs recent bars
• Body quality (body vs range)
• Bar progress (how much of the candle’s time has elapsed)
- Differentiates:
• Potential vs confirmed breakouts
• Strong, volume-backed moves vs weak spikes
- Optional debug label explaining:
• Momentum score
• Volume ratio and RVOL
• Spread behaviour
• Body quality
• Bar elapsed %
HOW TRADERS USE IT:
You avoid chasing every big candle.
You only act when:
- Breakout strength is high,
- Volume confirms the move,
- Structure (Fib / VPOC / CHoCH) is aligned.
--------------------------------------------------
E) VPOC / WVPOC CLUSTERS & DYNAMIC ZONES
- Tracks real-time VPOC and WVPOC.
- Identifies VPOC/WVPOC clusters as powerful S/R zones.
- Confirms bullish or bearish breaks when price clears these levels with volume.
- Provides dynamic SL and TP logic:
• SL near/behind VPOC with ATR buffer.
• TP ladders aligned with volume structure.
HOW TRADERS USE IT:
You anchor your risk to where the most volume traded, not random price points:
- Use VPOC as a rational stop placement.
- Treat VPOC/WVPOC clusters as “coiled springs” – zones where large moves often start.
--------------------------------------------------
F) SMART MONEY ENTRY ENGINE (1H + 15M MEGABARS)
- Uses MTF `request.security` logic to bring 1H MegaBars into lower timeframes.
- Identifies:
• 1H + 15m confluence entries (A-grade setups).
• Single-TF entries (B-grade setups).
- Pre-calculates for each scenario:
• Entry level (Fib-based within the MegaBar range).
• Stop loss (beyond range or leg-based).
• TP1–TP4 along Fib extensions / structure.
- Labels show:
• “Entry = …”
• “SL = …”
• “TP1 = … / TP2 = … / TP3 = … / TP4 = …”
with adjustable font size and ATR-based offsets.
- Optional “show only latest” mode to keep your chart clean.
- Alert-ready so you can receive notifications when conditions are met.
HOW TRADERS USE IT:
You get a fully defined execution ladder:
- The engine tells you where a logical entry is,
- Where a logical SL should be,
- And how to scale out with multiple targets.
You can use:
- Confluence setups for main trades,
- Single-TF setups for more frequent but lower conviction trades.
--------------------------------------------------
G) REVERSE FIB TRADING MODULE
- Triggers after extended moves when key TPs are hit.
- Looks for:
• Rejection candles at or beyond major extensions.
• Exhaustion + VSA confirmation.
- Builds a reverse (counter-trend) Fib plan:
• Counter-trend entry from extension extremes.
• TP ladder based on 0.618, 0.786, 1.236, 1.382, 1.5, 1.618, 2.0, etc.
• SL and TSL based on ATR and Fib distance.
- ATR timeframe adapts to chart timeframe.
HOW TRADERS USE IT:
You can fade overextended moves once structure and P/A agree:
- Trend traders can use it to tighten or exit.
- Counter-trend traders can structure “fade” setups with defined risk.
--------------------------------------------------
H) LIQUIDITY SWEEPS, CHoCH, ORDER BLOCKS, FVGs
- Detects sweeps above highs and below lows (liquidity grabs).
- Marks CHoCH (Change of Character) when structure flips with volume.
- Basic smart money order block detection (bullish / bearish).
- FVGs (Fair Value Gaps) shaded on chart, removed when filled.
HOW TRADERS USE IT:
Combine sweeps + CHoCH + MegaBar + VSA + VPOC:
- Join clean, volume-backed continuations.
- Fade obvious stop hunts when they reject into strong zones.
--------------------------------------------------
I) VSA + BREAKOUT DASHBOARD TABLE (OPTIONAL)
- Compact table with:
• VSA context
• Breakout score
• RVOL / volume status
• Spread and candle quality
• ATR regime
• Close position within the bar
• VPOC and elapsed bar percentage
HOW TRADERS USE IT:
Before pressing the button, glance at the table:
- Is volatility supportive?
- Is volume confirming?
- Is this a clean breakout or a tired move?
This pushes you toward rule-based execution and away from impulse.
--------------------------------------------------
3) TYPICAL TRADING WORKFLOW WITH XAUMO MEGABAR VSA
A) Pick timeframe and session
- Use 15m or 1H on XAUUSD.
- Align the indicator’s session inputs with your actual trading hours.
B) Read context first
- Check accumulation / distribution zones.
- Look at VSA events and the breakout engine.
- Note where VPOC / WVPOC are relative to price.
C) Find the active MegaBar and its Fib structure
- Identify the most recent bull/bear MegaBar.
- See if price is:
• Pulling back into reload zones,
• Breaking out of them,
• Or extending into high-risk zones.
D) Wait for smart money confirmation
- Look for:
• Confluence setups (1H + 15m MegaBars),
• Strong breakout score,
• Valid VSA signals,
• Helpful structure: CHoCH, FVG, sweeps.
E) Execute using the printed ladders
- Use the on-chart Entry / SL / TP labels as your execution framework.
- Adjust lot size and risk % according to your own plan.
F) Manage and exit
- Use ATR / VPOC logic to trail or lock profits.
- Rotate to reverse Fib setups if extensions look exhausted.
4) WHO THIS INDICATOR IS FOR
- Gold traders (XAUUSD CFD or spot) on 15m and 1H.
- Traders who prefer institutional structure (volume, VPOC, SMC, Fib) over simple indicators.
- Traders who want pre-structured entries, SL, and TP ladders without losing flexibility.
- Advanced students of VSA and smart money concepts who want everything in one tool.
5) FULL EDUCATIONAL DISCLAIMER (READ CAREFULLY)
- This indicator and all descriptions are for EDUCATIONAL PURPOSES ONLY.
- NOTHING in this script, its labels, tables, alerts, outputs, or documentation is:
• Investment advice
• Trading advice
• A recommendation to buy or sell any asset
• A signal service or portfolio management tool
- Markets are risky. Trading leveraged instruments such as CFDs, futures, or margin products involves a HIGH RISK of loss, including the possible loss of ALL invested capital.
- Past performance, backtests, or hypothetical examples DO NOT guarantee future results.
- Any probabilities, scores, or “quality levels” shown by the indicator are purely algorithmic and DO NOT represent guarantees or promises of profit.
- You are solely responsible for:
• Your position sizing
• Your leverage
• Your entries, exits, and risk management
• Compliance with local regulations and tax rules
- Before trading live with real money, you should:
• Thoroughly backtest and forward-test the indicator.
• Use a demo account to understand how signals behave in real time.
• Consult a licensed financial professional if you need personalised investment or trading advice.
- By using this indicator:
• You accept that the author and any associated entities or brands (including XAUMO, XAUMO indicators, and any promotional text) bear NO LIABILITY for any financial losses, missed gains, or decisions you make based on this tool.
• You agree that you are acting entirely at your own risk and that all outputs are informational and educational, not prescriptive trading instructions.
In short:
Use XAUMO MegaBar VSA as a powerful educational and analytical companion,
NOT as a substitute for your own independent judgment, testing, and risk control.
=====================================================
XAUMO MegaBar VSA — محرّك البريك آوت و الريفرسال بتاع السمارت ماني للدهب
( استخدام تعليمي بس)
1) المؤشّر ده بيعمل إيه؟
XAUMO MegaBar VSA معمول مخصوص للـ XAUUSD عشان يورّيك "الفلوس الكبيرة" بتتحرك إزاي،
مش بس السِعر رايح فين.
بيجمع في حتّة واحدة:
- رصد MegaBar على الساعة والربع ساعة
- VSA (Volume Spread Analysis) – سلوك الفوليوم جوّه الشمعة
- VPOC / WVPOC و تجمّعات الفوليوم المهمّة
- سويپس لليكويديتي + CHoCH + Order Blocks + FVGs
- خريطة فيبوناتشي كاملة (Retrace + Extensions)
- سلالم تنفيذ جاهزة (Entry, SL, TP1–TP4 + صفقات Reverse Fib)
وكل ده:
- بألوان واضحة على الشموع
- لِيبلات متظبّطة بـ ATR Offset
- Tables و Panels اختيارية
عشان المتداول يسأل نفسه:
"الحركة دي بتاعة سمارت ماني؟ ولا مجرد دوشة ملوش لازمة؟"
2) أهم الموديولات اللي جوّه المؤشّر
A) الكونتكست بتاع السيشن + تجميع/توزيع
- فلتر جلسات: لندن – نيو يورك – overlap – أو وقت تحطّه انت.
- مناطق Accumulation / Distribution متظلّلة بألوان أنت بتختارها.
- لچند بسيط يوضّح لك السوق دلوقتي: تجميع؟ توزيع؟ ولا نايم.
المتداول يستخدمه إزاي؟
تركّز بس في الجلسة اللي انت شغّال فيها، وتشوف فورًا:
فيه بناء مراكز؟ فيه تصريف؟ ولا مفيش فوليوم أصلاً؟
ده يقلّل دخولك في أوقات السوق فيها “ميت”.
--------------------------------------------
B) محرّك الـ MegaBar + خريطة الفيبوناتشي
- المؤشّر يلقط لوحده الـ MegaBars (شموع مؤسّسات) على 15m و 1h.
- بيعتمد على: حجم الجسم، مدى الشمعة، الفوليوم.
- يرسم خريطة فيبوناتشي كاملة من الرجل الأساسية:
• Retrace: 0, 13, 23.6, 38.2, 50, 61.8, 78.6, 86.2, 100, -33
• Extensions: من 125% لحد 600%+ (سلم قابل للتعديل)
- لكل مستوى:
• لون / سماكة / ستايل (سوليد – دوتيد – داشد)
• ليبل سِعر مع Offset بـ ATR
- لچند يشرح لك Reload Zones: ضحلة / عادية / عميقة.
المتداول يستخدمه إزاي؟
بدل ما “تخمّن” فين تشتري وتبيع:
- تشتري الدِپ جوّه مناطق Reload بعد MegaBar صاعد.
- تبيع الريبوند جوّه Extensions بعد MegaBar هابط.
- عندك هيكل واضح للسوينج والسكالب من غير فوضى.
--------------------------------------------
C) VSA + لِيبلات على الشموع
- يكتشف أحداث VSA زي:
• No Demand / No Supply
• Stopping Volume
• Absorption
• Spring / Upthrust
• Buying / Selling Climax
• EVR (شموع مجنونة فوليومًا)
• Tests و Confirmed Signals عند الدعوم/المقاومات
- مع تحسينات:
• تحليل Body vs Range
• مين اللي غالب؟ جسم الشمعة ولا الذيول؟
• فلتر Momentum + Volume
المتداول يستخدمه إزاي؟
كل ليبل على الشمعة = كومنت من السمارت ماني:
- No Demand عند مقاومة + RVOL ضعيف → بلاش تشتري.
- Stopping Volume + Spring جوّه Reload Zone + VPOC → فرصة قوية للشراء.
- توصل بين VSA + Fib + VPOC فتفهم “مين بيكسب المعركة”.
--------------------------------------------
D) محرّك البريك آوت Supersonic
- بيحسب Score للقوة بتاعة البريك آوت من:
• RVOL + Volume Expansion
• توسّع السبريد مقارنة بالشموع السابقة
• جودة جسم الشمعة (جسم ولا ذيل)
• نسبة الوقت اللي عدّى من الشمعة الحالية
- يفرّق بين:
• بريك آوت محتمل vs مؤكد
• حركة قوية مدعومة بفوليوم vs “شمعة شو”
- يقدر يطلع ليبل Debug يشرح:
• Momentum Score
• Volume Ratio / RVOL
• Spread Behaviour
• Body Quality
• % الوقت اللي فات من عمر الشمعة
المتداول يستخدمه إزاي؟
ماتجريش ورا كل شمعة كبيرة:
- استنَى لما يكون الـ Score عالي،
- والفوليوم مصدّق الحركة،
- والهيكل (Fib / VPOC / CHoCH) موافق.
ساعتها بس البريك آوت يستاهل المخاطرة.
--------------------------------------------
E) VPOC / WVPOC + مناطق الفوليوم
- يرقب VPOC و WVPOC في الوقت الحقيقي.
- يحدّد Clusters مهمة تتحوّل لـ Support / Resistance محترم.
- يراقب كسر المناطق دي بفوليوم واضح (بداية موجة جديدة).
- SL و TP ديناميك:
• SL حوالين VPOC مع Buffer من ATR.
• TP متوزع على مستويات فيبوناتشي و زونات فوليوم.
المتداول يستخدمه إزاي؟
بتربط مخاطرتك بأين اشتغل الفوليوم التقيل:
- VPOC = منطق منطقي للستوب.
- Clusters = زون ضغط ينفع يبدأ منها ترند قوي.
--------------------------------------------
F) محرّك الدخول بتاع السمارت ماني (1h + 15m MegaBars)
- يجيب MegaBars بتاعة الساعة جوّه فريمات أقل بالـ `request.security`.
- يميّز:
• Confluence بين MegaBar الساعة + MegaBar الربع ساعة (صفقة A-Grade).
• MegaBar على فريم واحد بس (B-Grade).
- يجهّز تلقائيًا:
• Entry
• SL
• TP1–TP4 على Extensions و مستويات هيكلية.
- اللّيبلات تكتب:
• Entry = …
• SL = …
• TP1 = … / TP2 = … / TP3 = … / TP4 = …
مع تحكّم في حجم الخط و ATR Offset.
- فيه اختيار “أظهر آخر سيناريو بس” عشان الشارت يفضل نضيف.
- جاهز للـ Alerts لما الشروط تكمّل.
المتداول يستخدمه إزاي؟
يبقى عندك Execution Ladder كامل:
- فين تدخل،
- فين تحط الستوب،
- إزاي تقسم الخروج على أكتر من هدف.
--------------------------------------------
G) موديل الـ Reverse Fib (صفقات عكس الاتجاه)
- بيشتغل بعد ما السعر يبالغ في الحركة و يوصل Extensions معيّنة.
- يدور على:
• شموع رفض عند/بعد Extensions.
• Exhaustion + إشارة VSA.
- يرسم خطة عكسية:
• Entry عكسي من Extension Extreme.
• TP سلم مبني على 0.618, 0.786, 1.236, 1.382, 1.5, 1.618, 2.0, … إلخ
• SL و TSL مبنيين على ATR و مسافة الفيبوناتشي.
المتداول يستخدمه إزاي؟
لو انت ترند تريدر:
- تستخدمه عشان تقفل/تخفف عند تمدّد مبالغ فيه.
لو انت Counter-Trend:
- يديك سيناريو “فِيد” منطقي بمخاطرة محسوبة.
--------------------------------------------
H) سويپس لليكويديتي + CHoCH + Order Blocks + FVGs
- يوسم مناطق ضرب الستوبات فوق الهاي وتحت اللو (Liquidity Grabs).
- يحدد CHoCH لما الاتجاه يغيّر شخصيته مع فوليوم.
- يرصد Order Blocks أساسية (Bullish / Bearish).
- يظلّل الـ FVGs و يشيلها لما تتعبّى.
المتداول يستخدمه إزاي؟
تجمع بين:
MegaBar + VSA + Fib + VPOC + Liquidity:
- يا إمّا تلحق موجة نظيفة،
- يا إمّا تفِيد Stop Hunt غبي اتكشف على الشارت.
--------------------------------------------
I) داشبورد VSA + Breakout (Table اختياري)
- Table صغيرة فيها:
• حالة VSA
• قوة البريك آوت
• RVOL / Volume
• Spread & Candle Quality
• حالة ATR
• مكان الإغلاق جوّه الشمعة
• وضع VPOC
• نسبة الوقت اللي عدّى من الشمعة
المتداول يستخدمه إزاي؟
قبل ما تدوس Buy / Sell:
- تبص على التابل ثانيتين:
الدنيا شغّالة ولا لأ؟
فيه فوليوم؟ فيه ترند؟ ولا حركة ميتة؟
ده يقلل قرارات “من غير plan”.
3) سيناريو شغل متداول على XAUMO MegaBar VSA
1) اختار الفريم + الجلسة
- 15m أو 1h على XAUUSD.
- ظبّط سيشن لندن/نيويورك زي وقت شغلك الحقيقي.
2) اقرأ الكونتكست
- السوق بيبنِي مراكز؟ بيصفّي؟ ولا نايم؟
- إيه إشارات الـ VSA و Score البريك آوت؟
- فين VPOC / WVPOC من السعر؟
3) دور على MegaBar النشط و خريطة الفيبوناتشي بتاعته
- السعر:
• بيرجّع جوّه Reload Zone؟
• بيكسر البرنچ؟
• ولا داخل على Overextension؟
4) استنَى تأكيد السمارت ماني
- Confluence بين MegaBar الساعة والربع ساعة.
- Breakout Score محترم.
- VSA منطقي (No Demand, Stopping Volume, Spring, …).
- Structure: CHoCH / FVG / Liquidity Sweep في اتجاه الصفقة.
5) نفّذ باستخدام السلم المطبوع على الشارت
- استخدم Entry / SL / TP1–TP4 كـ هيكل أساسي.
- عدّل اللوت / الريسك حسب خطتك انت.
6) الإدارة والخروج
- استعمل ATR + VPOC في Trailing/Lock.
- لما Extensions تبان مبالغ فيها → ركّز على Reverse Fib.
4) المؤشّر ده مناسب لمين؟
- اللي بيتاجر دهب XAUUSD (CFD أو Spot) على 15m و 1h.
- اللي بيحب شغل مؤسّسات: Volume, VPOC, SMC, Fib مش مؤشرات بسيطة.
- اللي عايز Execution Plan جاهز (Entry/SL/TP) بس لسه عنده حريّة تعديل.
- اللي عايز يتعلّم VSA و Smart Money Concepts بشكل تطبيقي على شارت واحد.
5) إخلاء مسؤولية كامل (مهم تقراه)
- المؤشّر ده وكل الكلام اللي حواليه للتعليم بس.
- مش:
• نصيحة استثمارية،
• ولا توصية شراء/بيع،
• ولا خدمة إدارة محافظ،
• ولا سيجنال سيرڤس.
- التداول في الأسواق (خصوصًا المشتقات، الـ CFD، الفيوتشر) فيه مخاطرة عالية جدًا،
وممكن تخسر جزء كبير أو كل رأس مالك.
- أي أداء سابق، باك تست، أو مثال افتراضي → مش ضمان لنتيجة مستقبلية.
- أي نسبة احتمالات، Scores، أو “Quality” بيطلعها المؤشّر:
• دي حسابات كود، مش ضمان ربح،
• مش وعد ولا تعهّد بأي نتيجة.
- انت المسؤول 100% عن:
• حجم العقود اللي بتدخلها،
• الرافعة اللي بتستخدمها،
• أماكن الدخول والخروج،
• وإدارة المخاطرة بتاعتك،
• والتزامك بالقوانين والضرائب في بلدك.
- قبل ما تستخدم المؤشّر على حساب حقيقي:
• جرّب كويس على باك تست و فورورد تست،
• اشتغل فترة على Demo،
• لو محتاج نصيحة مالية شخصية → ارجع لمستشار مالي مرخَّص.
باختصار:
XAUMO MegaBar VSA ده أداة تعليمية وتحليلية قوية تساعدك تفهم حركة الذهب،
مش زرار “اطبع فلوس”.
انت صاحب القرار، وانت صاحب المسؤولية، وانت اللي بتتحمّل أي ربح أو خسارة.

Anup Algo + For Full Version Contact on Whatsapp +918123456805Best indicator For Algo Trading Auto Buys & Sells, Auto Tp & Sl Works for All pairs forex commodities crypto
Contact on Whatsapp +918123456805 for full version

TH-SixPair Engine v6.3ระบบ Multi-pair EMA + ATR x1.5 สำหรับ XAUUSD, GBPUSD, EURUSD, USDJPY, USDCAD, AUDUSD
– ใช้ EMA 8/21 + EMA เทรนด์ 50 + RSI filter + Session filter
– มีโหมด Pending + Extra Entry (EMA pullback / Swing HL retest / FVG retest)
– จัดการ TP1/TP2 แบบ partial + BE อัตโนมัติ
– มีตารางแสดง SL/TP1/TP2 เป็น USD สำหรับ lot 0.01 และสถิติย้อนหลัง 10 ออเดอร์
แนะนำใช้ TF 1H เป็นหลัก

ROMAN INDIThis script creates an on-chart information panel / watermark that summarizes the most important technical and contextual data for the current symbol in one place. It’s designed as a compact trading dashboard overlay, fully configurable from the Inputs menu.
1. General instrument info
The table shows:
Company name + market cap
Market cap is calculated from shares_outstanding_total * close and formatted in M / B / T.
Ticker + timeframe (e.g. AAPL, 1D, AAPL, 1H, etc.).
Sector & industry (when available from syminfo).
You can choose the panel position (Top/Middle/Bottom & Left/Center/Right) and text size/color from the inputs.
2. Volatility & stop-loss (ATR block)
Calculates ATR(14) and the ATR as % of price.
Colors ATR with an emoji:
🔴 = high volatility (above red threshold)
🟡 = medium
🟢 = low
Computes a dynamic stop loss:
Source price can be: Today / Yesterday / 2 Days Ago.
Stop = base price − ATR × user-defined multiplier.
Also calculates the distance from close to stop in percent and marks it:
🟢 if distance > 5%
🟡 if distance > 2%
🔴 otherwise
When price crosses the stop level (or if the stop is very tight and marked 🔴), a label is plotted just ahead of the current bar:
Shows either “SELL” (if close ≤ stop) or the stop price.
3. Moving averages distance row
Calculates SMA 50 / 150 / 200.
Shows a single row:
MA50: +X.XX% | MA150: +Y.YY% | MA200: +Z.ZZ%
Values are the percentage distance between close and each MA (positive/negative).
This row can be toggled on/off via the inputs.
4. Volume analysis
Uses a 20-period average volume as baseline.
Computes:
Absolute volume difference vs. 20-SMA (in K/M units).
Percent difference vs. average.
Adds:
🔴 if current volume < average
🟡 if up to +10% above average
🟢 if more than +10% above average
Detects streaks of rising or falling volume (last 3 bars):
⬆️ / ⬆️⬆️ / ⬆️⬆️⬆️ for 1–3 bars of increasing volume
⬇️ / ⬇️⬇️ / ⬇️⬇️⬇️ for 1–3 bars of decreasing volume
Final row example:
ΔVol: 1.25M (15.32%) 🟢 ⬆️⬆️
5. Earnings countdown
Uses earnings.future_time to detect the next earnings date.
Shows:
Earnings: X days remaining
(only if there is a future earnings date and the option is enabled).
6. RSI (momentum)
Calculates RSI(14).
Displays:
Current RSI value.
Trend arrow vs. previous bar: ⬆️ / ⬇️ / (no arrow).
Emoji color:
🔴 when RSI > 70 (overbought)
🔴 when RSI < 30 (oversold)
🟢 otherwise
Example:
RSI (14): 63.25 🟢 ⬆️
7. CCI (trend strength & short-term swings)
Calculates CCI(14) on hlc3.
Tracks the direction of CCI (up / down / flat) and interprets it:
If CCI is falling:
100 → “Overbought 🔴”
0 to 100 → “Negative Momentum 🟡”
−100 to 0 → “2-4 Days Down 🟠”
< −100 → “Oversold 🔴”
If CCI is rising:
100 → “Overbought 🔴”
0 to 100 → “2-4 Days Up 🟢”
−100 to 0 → “Building Momentum 🟡”
< −100 → “Oversold 🔴”
The row shows value, direction arrow and text interpretation.
Example:
CCI (14): -45.32 🟡 ⬆️ Building Momentum 🟡
8. Market context: VIX & Bitcoin row
Tracks:
VIX (CBOE:VIX)
Bitcoin (BINANCE:BTCUSDT)
If the current chart is directly on one of these symbols, it uses the live close; otherwise it pulls the data via request.security.
Shows last price of VIX and BTC plus trend arrows based on the last 3 closes (up/down streak).
Example:
VIX: 15.23 ⬆️ | BTC: 113,000 ⬇️⬇️
Summary
In short, ROMAN INDICATOR is an overlay info-panel that combines:
Instrument fundamentals (name, sector, industry, market cap)
Volatility & ATR-based stop-loss engine
Distance from major moving averages (50/150/200)
Volume vs. average with streak detection
RSI & CCI with clear emoji-based interpretation
Earnings countdown (days to next report)
Global context via VIX + Bitcoin row
Everything is configurable in the Inputs, making it a convenient single-glance trading dashboard on top of your chart.

SOFR - IORB Spread (pct pts & bps)Tracks short-term funding conditions by measuring the spread between the Secured Overnight Financing Rate (SOFR) and the Fed’s Interest on Reserve Balances (IORB). When SOFR persistently trades above IORB, it signals cash scarcity and stress in overnight funding markets. This indicator is best used as a risk-regime and plumbing health check, not as a directional trading signal. Calm readings allow trends to persist; sustained spikes often precede periods of volatility and forced deleveraging.
