Index SniperTrade smart, trade sharp! Index Sniper Strategy targets the strongest market moves with surgical entries and strict risk control — designed for traders who want speed, confidence, and consistency in index trading.
Indicateurs et stratégies
Solace EVO HUDThe Solace EVO HUD (Heads-Up Display) is a cutting-edge, all-in-one TradingView indicator that transforms your chart into a professional trading dashboard. As the pinnacle of the Solace Cipher EVO series, it combines momentum signals, trend filters, volatility bands, and multiple oscillators into a cohesive "HUD" for real-time decision-making. Designed for crypto, forex, stocks, and futures traders, it provides at-a-glance insights to spot high-probability setups without cluttering your screen. Whether you're scalping on 1-minute charts or swinging on daily, the EVO HUD delivers actionable intelligence with precision and style

Solace Evo 50 & 200 EMAOverview
The Solace Evo 50 & 200 EMA is a premium TradingView indicator designed for trend-following traders, combining the timeless simplicity of Exponential Moving Averages (EMAs) with advanced visual aids to identify market trends, crossovers, and potential entry/exit points. Built as an evolution of the Solace Cipher EVO series, this tool focuses on the 50-period and 200-period EMAs – often called the "Golden Cross" and "Death Cross" setup – to provide clear, actionable insights for stocks, crypto, forex, and more. It's ideal for beginners and pros alike, helping you stay on the right side of the market without overcomplicating your charts.
Key Features
50 & 200 EMA Lines: Plots the 50 EMA (short-term trend) and 200 EMA (long-term trend) with customizable colors and thickness. Easily toggle each line on/off for clutter-free analysis.
Golden/Death Cross Alerts & Labels: Automatically detects and labels "Golden Cross" (50 EMA crosses above 200 EMA – bullish) and "Death Cross" (50 EMA crosses below 200 EMA – bearish) with on-chart labels and built-in alerts for real-time notifications.
Background Tint for Trend Bias: Colors the chart background green when 50 EMA > 200 EMA (bullish) or red when 50 EMA < 200 EMA (bearish), giving you an instant visual cue on market direction. Toggleable for clean charts.
High Customization: Adjust EMA lengths (default 50/200), line styles, colors, and alert settings to fit your strategy. Works on any timeframe from 1-minute scalping to daily swings.
Lightweight & Efficient: No lag or repainting – uses TradingView's native ta.ema() for fast calculations. Compatible with mobile and desktop.
How It Works
This indicator leverages the classic EMA crossover strategy:
Bullish Trend: When the 50 EMA is above the 200 EMA, the market is in an uptrend. Look for buys on pullbacks.
Bearish Trend: When the 50 EMA is below the 200 EMA, the market is in a downtrend. Favor shorts.
Crossovers: The Golden Cross signals potential trend reversals to the upside (strong buy), while the Death Cross warns of downside shifts (strong sell).
Integrated with Solace EVO's core logic, it pairs perfectly with momentum oscillators for confluence trades.

HVTC 2HVTC – SMC Market Structure & Trend Indicator
HVTC is a Smart Money Concepts–based tool that helps traders visualize market structure and trend direction with clarity.
Features:
CHoCH & BOS Detection
Automatically identifies structural shifts using true SMC logic and labels them directly on the chart.
Trend Filter
Confirms bullish or bearish conditions using an internal trend system to keep trades aligned with the major direction.
EMA 25 Guide
EMA 25 acts as dynamic support/resistance, helping define momentum and bias.
Alerts (Optional)
Notify traders when CHoCH/BOS or key retests occur—ideal for those who don’t monitor charts continuously.
Use Cases:
Works for Crypto, Forex, Gold, Indices, and Stocks across all timeframes. Helps improve entries, exits, and overall market understanding based on institutional structure.
Not financial advice. Use with proper risk management.

FluxMA ProFluxMA – Mechanical Moving Average Strategy with Risk Control
FluxMA is a backtesting strategy based on price breaking through a configurable moving average. Its purpose is to provide a simple, transparent, and flexible framework to study a trend-following system with clear entries, predefined Stop Loss and Take Profit levels, and no martingale, no grid, and no hidden logic.
This strategy is intended for traders who want to analyze data objectively, test risk management ideas, and explore different moving average, time, and weekday configurations within the TradingView environment.
Core Strategy Logic
The core logic of FluxMA is driven by the relationship between the close price and a configurable moving average:
A moving average is calculated on the close price (SMA, EMA, WMA, or RMA).
When a bar closes above the moving average, a long (buy) signal is generated.
When a bar closes below the moving average, a short (sell) signal is generated.
Trades are simulated at the open of the next bar, avoiding any repainting of signals on the current bar.
At all times, the strategy keeps at most one open position (no pyramiding).
There are no complex patterns or hidden conditions: everything is centered on the clean break of price relative to the moving average.
Main Parameters
FluxMA includes several parameters so you can adapt the behavior of the strategy to the instrument and your preferred style:
Moving Average
Moving average type: SMA, EMA, WMA, or RMA.
Moving average period: fully configurable, so you can make it faster or slower depending on timeframe and instrument.
Basic SL/TP Management
Stop Loss (SL) set at a fixed price distance.
Take Profit (TP) set at a fixed price distance.
The risk–reward ratio is defined by the combination of SL and TP settings.
Trading Filters
Time filter: define a start time and end time for trading to limit the strategy to specific intraday sessions.
Day-of-week filter: choose which days (Monday–Sunday) are allowed to trade.
Direction filter:
Longs only.
Shorts only.
Both directions.
“One trade per day” option: after the first trade of the day, all further signals for that day are ignored.
Suggested Use and Best Practices
FluxMA is meant to be a prototyping and analysis tool, not a ready-made “plug-and-play” system. Some ideas for how to use it:
Test different timeframes (e.g., M5, M15, H1) and see how performance changes as you adjust the moving average speed and the time horizon.
Tune the moving average type and period to study smoother vs. more aggressive trend behavior.
Analyze the impact of the time filter: only European session, only US session, or narrower windows.
Turn specific weekdays on/off to identify which days tend to behave better for each instrument.
Use this strategy as a base layer and later add your own filters (higher timeframe trend, volatility filters, etc.) within TradingView’s testing environment.
It’s a good idea to combine backtest results with manual chart review, especially in highly volatile periods and around major trend reversals.
Disclaimer and Limitations
FluxMA does not use martingale, grid, averaging down, or any aggressive position sizing. Each trade is opened with a clear logic and closed by SL or TP according to fixed rules.
This strategy runs only inside TradingView for historical simulation and analysis purposes. It is not investment advice or financial guidance.
Backtest and historical results do not guarantee future performance in live markets.
Any decision to use similar logic in live accounts or other trading environments is entirely the user’s responsibility, including risk management, position sizing, and instrument selection.
In summary, FluxMA is a simple and transparent foundation to study how a mechanical moving average breakout system behaves under different parameter, session, and weekday configurations, within a controlled testing environment like TradingView.

Kuytrade - Super Scalping Pro V1.0📘 Strategy "Kuytrade - Super Scalping Pro"
What is this strategy?
This is a scalping trading that helps you catch quick profits from short-term price movements. It's perfect for traders who want to make multiple small wins throughout the day.
How does it work?
The strategy uses a 3-level filter system to find high-quality trading signals:
Level 1: CORE Indicators (Must Pass)
- EMA (Moving Averages): Checks if the trend is going up or down
- MACD: Confirms momentum is building in the right direction
Level 2: MOMENTUM Indicators
- RSI: Looks for oversold (ready to bounce up) or overbought (ready to drop) conditions
- Stochastic: Finds reversal points where price might change direction
Level 3: BOOST Indicators
- RSI Divergence: Spots hidden opportunities when price and momentum disagree
- Strong Candles: Identifies powerful price movements
- ATR Filter: Makes sure the market is active enough to trade
Trading Setup
Each Signal Opens 3 Orders:
Order 1: Closes at TP1 (quick small profit)
Order 2: Closes at TP2 (medium profit)
Order 3: Closes at TP3 (big profit target)
Default Settings:
TP1: 1,000 points
TP2: 1,500 points
TP3: 2,500 points
Stop Loss: 1,200 points
Lot Size: 0.01 per order (3 orders total)
Smart Features
- Trailing Stop Loss
- When TP1 hits, the Stop Loss for TP3 automatically moves to breakeven + 150 points, protecting your profit!
- Auto Asset Detection
The strategy automatically recognizes what you're trading:
- Forex pairs (EURUSD, GBPUSD, etc.)
- Gold, Silver, Platinum
- Crypto (Bitcoin, Ethereum)
- Stock Indices (US30, NASDAQ, S&P500)
Indicators:
You can enable/disable each indicator level
Mix and match to find what works for your style
Visuals:
Show/Hide TP/SL lines
Show/Hide entry boxes
Mobile view for smaller screens
When to Use This Strategy?
✅ Best for:
Active markets (London/NY sessions)
Lower timeframes (1m, 5m, 15m)
Volatile pairs with clear trends
❌ Avoid during:
Major news releases
Very quiet markets
Weekends/holidays
----------------------------------------
กลยุทธ์นี้คืออะไร?
Scalping ที่ออกแบบมาให้ช่วยทำกำไรเล็กๆ จากการเคลื่อนไหวของราคาระยะสั้น เหมาะสำหรับเทรดเดอร์ที่ต้องการทำกำไรเล็กน้อยบ่อยๆ ตลอดทั้งวัน
ทำงานยังไง?
กลยุทธ์ใช้ระบบกรองสัญญาณ 3 ระดับ เพื่อหาจุดเข้าที่มีคุณภาพสูง
Level 1: ตัวบ่งชี้หลัก (ต้องผ่าน)
- EMA (เส้นค่าเฉลี่ย): เช็คว่าเทรนด์กำลังขึ้นหรือลง
- MACD: ยืนยันว่าแรงซื้อ/ขายกำลังมาถูกทาง
Level 2: ตัวบ่งชี้โมเมนตัม
- RSI: หาจุด Oversold (ราคาถูกเกินไป พร้อมกลับตัว) หรือ Overbought (ราคาแพงเกิน พร้อมลง)
- Stochastic: หาจุดกลับตัวที่ราคาอาจจะเปลี่ยนทิศ
Level 3: ตัวบ่งชี้เสริม
- RSI Divergence: เจอโอกาสแอบแฝงเมื่อราคาและโมเมนตัมไม่สอดคล้องกัน
- Strong Candles: จับแท่งเทียนที่แรงมาก
- ATR Filter: ตรวจว่าตลาดมีความผันผวนพอจะเทรดไหม
การตั้งค่าการเทรด
แต่ละสัญญาณเปิด 3 ออเดอร์:
ออเดอร์ 1: ปิดที่ TP1 (กำไรเล็กเร็ว)
ออเดอร์ 2: ปิดที่ TP2 (กำไรกลางๆ)
ออเดอร์ 3: ปิดที่ TP3 (กำไรใหญ่)
ค่าเริ่มต้น:
TP1: 800 จุด
TP2: 1,500 จุด
TP3: 2,500 จุด
Stop Loss: 1,200 จุด
ขนาดล็อต: 0.01 ต่อออเดอร์ (รวม 3 ออเดอร์)
ฟีเจอร์พิเศษ
- Trailing Stop Loss (ขยับ SL ตาม)
- เมื่อ TP1 โดน SL ของ TP3 จะเลื่อนมาที่ราคาเข้า + 150 จุด ทำให้คุณไม่ขาดทุน!
- ตรวจจับสินทรัพย์อัตโนมัติ
กลยุทธ์จะจำคู่เงินที่คุณเทรดได้เอง:
คู่เงิน Forex (EURUSD, GBPUSD ฯลฯ)
- ทองคำ, เงิน, แพลตตินั่ม
- คริปโต (Bitcoin, Ethereum)
- ดัชนีหุ้น (US30, NASDAQ, S&P500)
แดชบอร์ดผลงาน (ล่างซ้าย)
- แสดง Win Rate แต่ละ TP
- ติดตามกำไร/ขาดทุนรวม
- แสดงสถิติทั้งหมด
แดชบอร์ดสถานะ Level (บนขวา)
สถานะตัวบ่งชี้แบบเรียลไทม์
เขียว = สัญญาณพร้อม
แดง = รอเงื่อนไข
ตั้งค่าที่ปรับได้
คุณภาพสัญญาณ:
เปิด "Strict Filter" = สัญญาณน้อยแต่คุณภาพสูง
ปิด "Strict Filter" = สัญญาณเยอะแต่อาจเสี่ยงขึ้น
ตัวบ่งชี้:
- เปิด/ปิดแต่ละ Level ได้
- ผสมผสานหาสูตรที่เหมาะกับคุณ
การแสดงผล:
- แสดง/ซ่อนเส้น TP/SL
- แสดง/ซ่อนกล่องข้อมูล Entry
- โหมดมือถือสำหรับจอเล็ก
เมื่อไหร่ควรใช้กลยุทธ์นี้?
✅ เหมาะกับ:
- ตลาดที่คึกคัก (เซสชั่นลอนดอน/นิวยอร์ก)
- ไทม์เฟรมเล็ก (1m, 5m, 15m)
- คู่เงินที่มีความผันผวนและเทรนด์ชัด
❌ หลีกเลี่ยง:
- ช่วงมีข่าวเศรษฐกิจสำคัญ
- ตลาดเงียบมาก
- วันหยุดสุดสัปดาห์

Demand & Supply (3 MTF) + SMC & Alerts by StockFusion 3.2Demand & Supply (3 MTF) + SMC & Alerts by StockFusion 3.2
**Overview**
Demand & Supply (3 MTF) + SMC & Alerts by StockFusion 3.2 is a multi–timeframe institutional-style trading tool that automatically detects high-quality Demand & Supply zones (3 TF), Smart Money Concepts (CHoCH & BOS), institutional volume footprints, Fair Value Gaps (FVG), and structural Premium/Discount levels. It is designed to give traders a clear HTF–MTF–LTF view, with smart alerts and a compact trend meter, so that execution can be done with more clarity and discipline.
**Description**
This indicator combines three core engines in one:
* **3× MTF Demand & Supply Zones**
* Auto-detection of RBR/DBR (DZ) and DBD/RBD (SZ) across TF-1 / TF-2 / TF-3.
* Manual / Normal / Conservative / Analysis modes for zone quality control (explosive/body ratios, ATR multipliers, volume filters).
* Dynamic zone removal on retest/mitigation (first & second-leg logic) with optional historical label retention.
* Multi-TF visibility controls (show HTF zones on LTF, LTF on HTF, etc.) and live “Nearest Zone Table” with Proximal/Distal & proximity %.
* **SMC (CHoCH, BOS, FVG, Premium/Discount)**
* Automatic CHoCH & BOS mapping with swing-based detection, visual lines and labels.
* FVG detection (bullish & bearish) with mitigation tracking, optional opacity reduction and mitigation alerts.
* Auto structure engine (HH/LL, BOS/CHoCH) with configurable lookback and line styles.
* Premium/Discount auto-fib levels (1.0/0.78/0.71/0.5/0.0) + optional “P / D” labels and 0.71 touch alerts when aligned with FVG & volume.
* **Institutional Volume, Trend Meter & Extras**
* Institutional “I/X” footprint detection with volume multipliers, significant & extreme volume spike markers + optional alerts.
* Trend Meter table for 3 higher timeframes using 50-period MAs (D/W/M by default) with quick visual up/down bias.
* 3-in-1 colored SMA/EMA pack, inside-bar detector with optional coloring and high/low lines for price action traders.
All key components are modular: you can toggle zones, SMC, institutional activity, FVG, fib structure, alerts, trend meter, and inside candles as per your trading style (intraday, swing, positional, or pure analysis).
**Disclaimer**
This indicator is for **educational and analytical purposes only** and does **not** constitute financial, investment, or trading advice. No buy/sell/hold recommendations are given, and no profitability or performance is guaranteed. Markets are risky; always do your own research, test on demo first, and consult your financial advisor if needed. By using this script, you accept that you are fully responsible for your own trading decisions and results.

Session Breakout StrategyThis is simple Session Breakout Strategy with Toggles provided to enable different Sessions based on the requirement..
ADX and Volume Filters provided to cut down the Whipsaws..
For BTC in 5 mins works good with the default setting.
For Gold Change ATR TP - 2.5 and ATR SL -1.5 in 5m TF.

VLB Entry TOOL — Dynamic Key Levels & Continuation Behavior ModThe VLB Entry Tool is a behavior-driven analysis system built specifically for XAUUSD.
It focuses on two structural elements that consistently influence gold’s movement:
1. Key Levels
2. Continuation thresholds after expansion
The indicator automatically identifies and displays key levels on the chart—levels that gold frequently reacts to through rejections, breaks, or pullbacks.
Since these levels form the foundation of most intraday movement, the tool removes the need to manually update them each session.
A core observation behind this model is that gold often breaks through a major level, retraces, and then gains continuation strength once price expands beyond the level by a predefined threshold.
This “break → pullback → continuation” behavior is used to plot objective price zones where continuation has historically shown a higher probability of developing.
Dynamic Adaptive Levels
The VLB Entry Tool continuously adjusts its key levels and continuation thresholds as market structure evolves.
As price forms new highs/lows or shifts intraday behavior, the tool automatically recalibrates to the new environment—helping traders stay aligned with real-time market structure without redrawing levels manually.
What the indicator provides:
-Automatically mapped key levels based on gold’s structural behavior
-Highlighted continuation zones after price expansion
-Real-time adaptive recalculation as market conditions change
-Objective, rules-based entry zones
-A consistent framework that reduces guesswork around “where” to enter
-A focus on price behavior rather than predictions
The VLB Entry Tool does not provide guaranteed outcomes or financial advice.
It organizes XAUUSD structure into predefined reference points using historical behavior, volatility characteristics, and a rules-based approach.
Traders remain responsible for their own timing, confirmation, fundamental context, and risk management.
This tool is designed for traders who want a structured, adaptive, and behavior-focused framework for interpreting XAUUSD movement—centered on the key levels that matter most.

SPY Flow + ORBSPY Flow is an intraday overlay indicator combining:
9/21 EMA ribbon calculated on Heikin-Ashi candles
5-minute opening range high/ low with persistent box and breakout detection
Daily VWAP (Heikin-Ashi based)
Unique behavior: master signals fire only on concurrent ORB breakout and EMA ribbon direction alignment. All other conditions are suppressed. Result is extremely low signal frequency with high alignment probability on SPY.

Alpha-Vector Unconstrained [GG_DOGE]
Alpha-Vector: Variance-Weighted Trend Capture Protocol
Authored by: GG_DOGE
Executive Summary
This algorithm represents the culmination of an exhaustive quantitative regression analysis, designed to exploit fat-tail distribution events in the SOL/USD cryptographic pair. By leveraging recursive historical data modeling on the 8-Hour timeframe, the strategy identifies high-probability momentum asymmetry—specifically isolating periods where directional volatility aligns with institutional order flow.
Unlike static heuristic models, this protocol utilizes a Dynamic Variance-Weighted Allocation Engine. This ensures that capital exposure is inversely correlated to market noise (entropy) while maximizing geometric compounding during high-conviction momentum phases. It essentially acts as a volatility filter, capitalizing on the statistical skew of the asset's return profile while enforcing rigorous drawdown mitigation via adaptive liquidity exits.
Key Algorithmic Features
Asymmetric Risk Architecture: The strategy deploys decoupled risk profiles for Long and Short vectors. Through backtest optimization, we have mathematically determined that bullish drift requires aggressive variance targeting, while bearish mean-reversion requires strictly constrained capital exposure to mitigate "short-squeeze" tail risks.
Volatility-Adjusted Position Sizing: Trade depth is not static. The algorithm calculates the instantaneous Average True Range (ATR) to normalize position size based on current market turbulence. This maintains a constant Risk-of-Ruin probability, regardless of price velocity.
Quantitatively Optimized Trend Filter: The entry signal is governed by a proprietary lookback period derived from computational brute-forcing of historical pivot points, designed to filter out Gaussian noise and only execute during significant structural market shifts.
Operational Guide (Strict Adherence Required)
This script comes pre-loaded with the statistically optimal parameters for the analyzed asset. No manual calibration is required.
Deployment Target:
Asset: CRYPTO:SOLUSD (Solana / US Dollar)
Timeframe: 8h (8-Hour Candle)
Exchange: Any major liquidity venue (Binance, Coinbase, Kraken, etc.)
Configuration:
Strategy Mode: Select "Long & Short" for the fully optimized protocol (captures upside momentum and hedges downside crashes).
Risk Parameters: The default values are mathematically tuned for maximum geometric growth (Highest PnL). Do not alter these unless you wish to artificially suppress the algorithm's volatility targeting.
Execution:
Capital Allocation: The logic is designed for compounding growth. It will automatically calculate the maximum lot size allowed based on your account equity, ensuring 100% capital efficiency without crossing into margin-call territory

Alpha Simple Supply/Demand
Alpha Simple Supply/Demand
This indicator's primary function is to plot potential Supply (Resistance) and Demand (Support) zones on the chart by referencing the High and Low price points.
How It Functions
Supply Zones (Red): These are drawn around the Daily Highs and represent areas where selling pressure (resistance) is anticipated.
Demand Zones (Green): These are drawn around the Daily Lows and represent areas where buying pressure (support) is anticipated.
Application on a 30-Minute Chart
This setup helps you see how the current intra-day price action is interacting with the significant daily structural levels established over the past few sessions.

Void Ribbon ProVoid Ribbon Pro is a custom, private TradingView indicator designed to simplify market decision-making by providing clear buy and sell signals based on trend strength, volatility conditions, and price interaction with liquidity “voids.”
Instead of overwhelming traders with dozens of variables, Void Ribbon Pro condenses market structure into a single ribbon-based model that visually shows when the market is shifting into a favorable long or exit condition.
How It Works
Void Ribbon Pro uses a dynamic ribbon composed of multiple adaptive moving averages that expand and contract based on volatility and trend momentum. This ribbon acts as both a trend filter and a signal engine:
BUY signal when price regains strength above the ribbon, momentum flips positive, and the model detects a filled or forming liquidity void beneath price.
SELL signal (or exit signal) when price closes back below the ribbon, trend strength weakens, or momentum reverses.
Key Features
Automatic Buy & Sell Signals
Removes emotional bias by highlighting high-probability entries and exits.
Void Detection
Identifies gaps, inefficiencies, and liquidity voids that often lead to strong continuation or reversal moves.
Adaptive Trend Ribbon
The ribbon thickens during high-volatility expansions and tightens during consolidation, making trend phases visually obvious.
Auto-Filtering for Choppy Markets
Helps avoid false signals by tightening thresholds during sideways conditions.
No Short Signals (Long-Bias Model)
Designed for simplicity — focuses only on high-quality long setups and exit conditions.
Clean, easy-to-read visuals
Perfect for newer traders who need clarity and for experienced traders who want one tool that quickly shows trend + momentum + inefficiencies at a glance.
What Problem It Solves
Most retail traders struggle with:
Information overload
Conflicting indicators
Not knowing when a trend is strong enough to enter
Panic-exiting too early or too late
Void Ribbon Pro solves this by giving a single unified signal system, showing:
When the market is strong, building momentum → Buy
When the push is weakening or reversing → Sell / Exit
When a liquidity void is forming or being filled → Extra confluence
Ideal For
Order flow traders
Trend traders
Momentum traders
Beginners who want simple, clear signals
Traders who can’t afford expensive order-flow tools like Bookmap or Exocharts

AQR Momentum AQR Momentum – Short Description
Uses the slopes of 20/55/200-day moving averages to measure short-, mid-, and long-term trend direction.
Green = rising trend; Red = falling trend.
55-day slope is the primary momentum signal; 200-day shows the market regime.

FVG PilotWhat it does
Automatically detects and draws Fair Value Gaps (FVGs) on the chart.
Removes an FVG as soon as it’s invalidated (bullish FVG invalid if price closes below its lower bound; bearish FVG invalid if price closes above its upper bound).
Triggers alerts only during Silver Bullet (SB) sessions in Europe/Berlin time when a new FVG is created.
Optionally draws two thin vertical lines at the start and end of each SB session so you can see the windows at a glance.
Runs on confirmed bars to avoid repainting.
How FVGs are detected
Wick mode (default):
Bullish FVG when low > high → gap [high , low]
Bearish FVG when high < low → gap [high, low ]
Body mode (optional): uses candle bodies instead of wicks:
Bullish FVG when current body low > prior body high
Bearish FVG when current body high < prior body low
Silver Bullet sessions (Europe/Berlin)
Three configurable session windows (default examples):
SB1: 10:00–11:00
SB2: 02:00–03:00
SB3: 07:00–08:00
Alerts for new FVGs fire only inside these windows.
Session lines: a thin vertical line is drawn on the first bar inside a session (start) and on the first bar after a session (end).
Inputs
Show Bullish / Bearish FVGs
Use Bodies (instead of wicks)
Minimum FVG size (in ticks)
Box opacity
SB sessions: enable/disable each window and set times (Europe/Berlin)
Session line toggle + color/width
Alerts included
SB (Berlin): Bullish FVG created – fires only during SB sessions
SB (Berlin): Bearish FVG created – fires only during SB sessions
Bullish FVG invalidated – fires when a bullish FVG is invalidated (no time filter)
Bearish FVG invalidated – fires when a bearish FVG is invalidated (no time filter)
How to set alerts (TradingView)
Click Create Alert.
Condition: choose this indicator, then pick one of the alert conditions above.
Select your alert options (once per bar close is recommended), then Create.
Tips
If you don’t see boxes, reduce Minimum FVG size or lower opacity (e.g., 70–85).
Body mode is stricter; start with wicks if you want more signals.
SB windows use Europe/Berlin and automatically account for DST.
The script respects platform limits for drawings; if your chart is cluttered, zoom in or reduce active sessions.

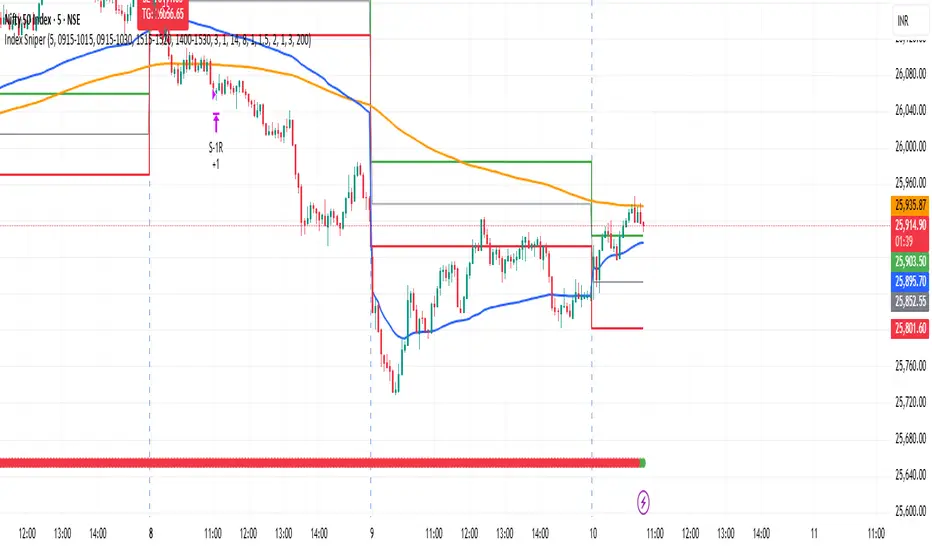
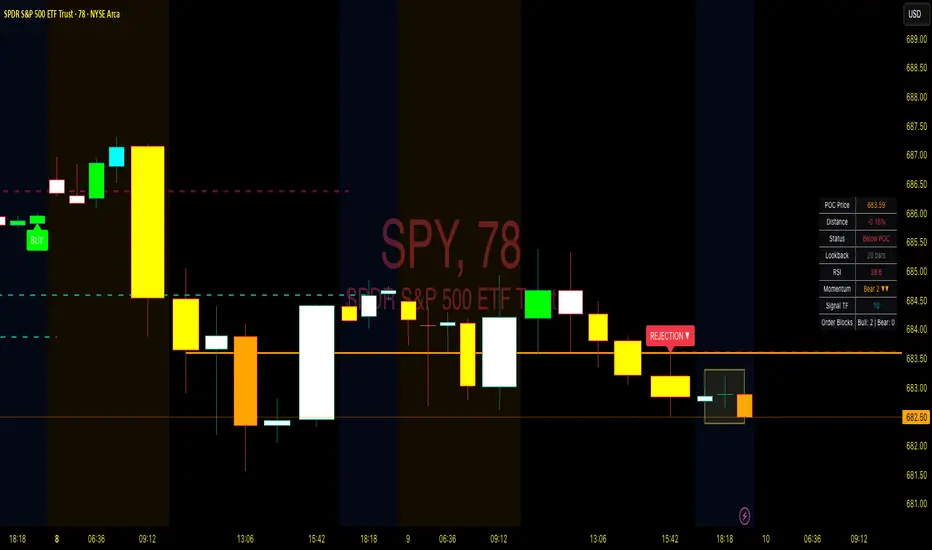
Point of Control + Momentum CandlesPOINT OF CONTROL + MOMENTUM CANDLES
A multi-feature indicator combining volume-based POC detection, 6-level momentum candle coloring, higher timeframe buy/sell signals, and order block identification.
FEATURES
Point of Control (POC)
Calculates the price level with highest traded volume over a customizable lookback period. Includes break and rejection detection with visual signals.
Momentum Candle Coloring
Colors candles based on EMA positioning and RSI values across 6 momentum levels:
- Bull 3/2/1: Strong to weak bullish momentum (Blue/Cyan/Green)
- Bear 1/2/3: Weak to strong bearish momentum (Yellow/Orange/Red)
- Neutral: No clear momentum (White)
Buy/Sell Signals
Generates signals from a user-selectable timeframe using EMA crossovers and RSI conditions. Signals appear on your current chart for multi-timeframe analysis.
Order Blocks
Detects potential institutional entry zones:
- Bullish OB: Last bearish candle before bullish impulse
- Bearish OB: Last bullish candle before bearish impulse
Blocks extend forward and optionally delete when mitigated.
Dashboard
Displays POC price, distance, RSI, momentum level, signal timeframe, and active order block count.
ALERTS
10 conditions available: POC breaks, rejections, buy/sell signals, and order block formations.
HOW TO USE
- Trade POC breaks for trend continuation
- Trade POC rejections for reversals
- Use candle colors to gauge momentum strength
- Confirm entries with higher timeframe signals
- Watch for price returning to order blocks
SETTINGS
All parameters are fully customizable including lookback periods, thresholds, timeframes, colors, and visual styles.
DISCLAIMER
For educational purposes only. Not financial advice. Trading involves risk. Always conduct your own analysis before making trading decisions.
Williams %R + Bollinger %B📊 Williams %R + Bollinger %B Indicator
This indicator blends two complementary oscillators to provide a clearer view of market momentum, volatility, and extreme zones:
🔹 Williams %R (W%R):
Measures the price’s position within its recent range, helping identify overbought/oversold conditions and potential reversal points. It reacts quickly to market shifts, making it useful for spotting short-term exhaustion.
🔹 Bollinger %B (BB%):
Shows where the price sits relative to the Bollinger Bands, highlighting volatility expansions, contractions, and pressure around the bands. It helps confirm breakouts, squeezes, and volatility-driven moves.
🎯 What This Combined Indicator Offers
Dual insight: Momentum (W%R) + volatility (BB%).
Higher precision: Identifies areas where both range extremes and volatility extremes align.
Better timing: Provides clearer entry/exit confirmation based on price behavior relative to range and volatility.
🧠 Suggested Use
Look for confluences, such as W%R showing oversold while BB% signals a lower-band rejection or squeeze.
Spot true breakouts when BB% expands while W%R exits extreme zones.
Filter out noise by analyzing the relationship between both oscillators.

Point of Control + Momentum CandlesPOINT OF CONTROL + MOMENTUM CANDLES
A comprehensive technical analysis indicator combining volume-based Point of Control detection, momentum-graded candle coloring, higher timeframe buy/sell signals, and order block identification.
━━━━━━━━━━━━━━━━━━━━━━━━━━━━━━━━━━━━━━━━━━━━━━━━━━━━━━━━━━━━━━━━━━
WHAT THIS INDICATOR DOES
This indicator identifies key price levels where the most trading activity has occurred (Point of Control), colors candles based on momentum strength, generates buy/sell signals from a user-selected timeframe, and detects order blocks that may act as future support/resistance zones.
━━━━━━━━━━━━━━━━━━━━━━━━━━━━━━━━━━━━━━━━━━━━━━━━━━━━━━━━━━━━━━━━━━
FEATURES
1. POINT OF CONTROL (POC)
The POC represents the price level with the highest traded volume over a lookback period. This indicator calculates a volume profile by distributing volume across price levels and identifying where the most activity occurred.
- Orange horizontal line shows the current POC level
- Yellow box highlights the candles used in the POC calculation
- Break detection identifies when price closes decisively beyond the POC
- Rejection detection identifies when price tests but fails to break the POC
2. MOMENTUM CANDLE COLORING
Candles are colored based on a 6-level momentum system using EMA positioning and RSI values:
Bullish Levels (price above both EMAs):
- Bull Level 3 (Royal Blue): Strong momentum, RSI above 70
- Bull Level 2 (Cyan): Medium momentum, RSI above 60
- Bull Level 1 (Green): Weak momentum, above EMAs
Bearish Levels (price below both EMAs):
- Bear Level 1 (Yellow): Weak momentum, below EMAs
- Bear Level 2 (Orange): Medium momentum, RSI below 40
- Bear Level 3 (Red): Strong momentum, RSI below 30
Neutral (White): No clear directional momentum
3. BUY/SELL SIGNALS
Signals are generated from a user-selectable timeframe (default: 10 minutes) and appear on your current chart. This allows you to see higher timeframe signals while trading on lower timeframes.
Buy Signal Conditions:
- EMA crossover (fast crosses above slow) OR RSI exits oversold
- Bullish candle on the signal timeframe
- Close above both EMAs
Sell Signal Conditions:
- EMA crossunder (fast crosses below slow) OR RSI exits overbought
- Bearish candle on the signal timeframe
- Close below both EMAs
4. ORDER BLOCKS
Order blocks identify potential institutional entry zones that may act as future support or resistance.
- Bullish Order Block (Green zone): The last bearish candle before a bullish impulse move
- Bearish Order Block (Red zone): The last bullish candle before a bearish impulse move
- Blocks automatically extend forward and can be set to delete when mitigated (price closes through the zone)
5. DASHBOARD
A customizable info panel displays:
- Current POC price
- Distance from POC (percentage)
- Position relative to POC (Above/Below/At)
- Lookback period
- Current RSI value
- Current momentum level
- Signal timeframe
- Active order block count
━━━━━━━━━━━━━━━━━━━━━━━━━━━━━━━━━━━━━━━━━━━━━━━━━━━━━━━━━━━━━━━━━━
HOW TO USE
POC Trading:
- Watch for breaks above POC for potential long entries
- Watch for breaks below POC for potential short entries
- Rejections at POC can indicate reversal opportunities
Momentum Reading:
- Use candle colors to gauge trend strength at a glance
- Level 3 colors indicate strong momentum (potential continuation)
- Level 1 colors indicate weakening momentum (potential reversal)
- Neutral/white candles suggest consolidation or indecision
Signal Confirmation:
- Use buy/sell signals from a higher timeframe to confirm entries on your trading timeframe
- Combine signals with POC breaks/rejections for higher probability setups
Order Block Strategy:
- Look for price to return to bullish order blocks for potential long entries
- Look for price to return to bearish order blocks for potential short entries
- Mitigated blocks (price closes through) lose their significance
━━━━━━━━━━━━━━━━━━━━━━━━━━━━━━━━━━━━━━━━━━━━━━━━━━━━━━━━━━━━━━━━━━
SETTINGS OVERVIEW
POC Settings:
- Lookback Period: Number of bars for POC calculation (default: 20)
- Volume Resolution: Price level granularity (default: 50)
- Recalculation Frequency: How often POC updates (default: every 3 bars)
Break/Rejection Detection:
- Break Threshold: Minimum percentage move to confirm a break (default: 0.3%)
- Rejection Wick Ratio: Minimum wick-to-body ratio for rejections (default: 0.5)
Momentum Settings:
- Fast/Slow EMA lengths for trend determination
- RSI length and threshold levels for momentum grading
Buy/Sell Signals:
- Signal Timeframe: The timeframe used for signal calculation
- Separate EMA and RSI parameters for signal generation
Order Blocks:
- Order Block Timeframe: Timeframe for OB detection
- Max Blocks Per Side: Limits displayed order blocks
- Delete Mitigated: Automatically removes invalidated blocks
All visual elements (colors, sizes, line styles) are fully customizable.
━━━━━━━━━━━━━━━━━━━━━━━━━━━━━━━━━━━━━━━━━━━━━━━━━━━━━━━━━━━━━━━━━━
ALERTS
10 alert conditions are available:
- Bullish/Bearish POC Break
- Bullish/Bearish POC Rejection
- Any POC Break
- Any POC Rejection
- Buy Signal
- Sell Signal
- Bullish Order Block Formed
- Bearish Order Block Formed
━━━━━━━━━━━━━━━━━━━━━━━━━━━━━━━━━━━━━━━━━━━━━━━━━━━━━━━━━━━━━━━━━━
NOTES
- The indicator uses request.security() to fetch data from the signal and order block timeframes. This is designed to work when viewing charts at timeframes equal to or lower than your selected signal/OB timeframes.
- POC calculations are based on the visible volume data. Assets with limited volume data may produce less reliable POC levels.
- Order blocks are detected using a simplified algorithm based on candle patterns and displacement. They represent potential zones of interest, not guaranteed support/resistance levels.
━━━━━━━━━━━━━━━━━━━━━━━━━━━━━━━━━━━━━━━━━━━━━━━━━━━━━━━━━━━━━━━━━━
DISCLAIMER
This indicator is provided for educational and informational purposes only. It does not constitute financial advice or a recommendation to buy or sell any security. Trading involves substantial risk of loss. Past performance is not indicative of future results. Always conduct your own analysis and consider your risk tolerance before making trading decisions. Use this tool as part of a comprehensive trading strategy, not as a standalone signal generator.

microwave weeeingThis algorithmic indicator finds trading opportunities. Its principle is simple: it identifies inflection points where trading volume explodes, groups together multiple inflection points near those points, and then retains only those that actually function as support and resistance. It's recommended to monitor the indicator over at least a 15-minute chart.
매물대를 찾아주는 알고리즘 지표. 원리는 간단하게 거래량이 폭발했던 변곡 구간을 찾고, 그 근처에 여러 번 쌓인 변곡구간만 묶어서 박스로 만들고, 그 박스가 실제로 지지·저항 역할을 한 것만 남기는 지표. 최소 15분봉 이상에서 보는걸 추천합니다.

PD Array Matrix [NINE Θ]PD Array Matrix
A comprehensive ICT-based indicator that combines multiple Premium/Discount Array concepts into a single, unified tool for Smart Money analysis.
Overview
PD Array Matrix provides traders with institutional-grade market structure analysis by integrating key ICT (Inner Circle Trader) concepts. This indicator automatically identifies and displays critical price levels, imbalances, and divergences that smart money uses to execute trades.
Key Features
Change in State of Delivery (CISD)
Automatically detects shifts in market delivery, signaling potential reversals or continuation setups.
Bullish and Bearish detection with directional filtering
Confirmation arrows for visual clarity
Wick-based invalidation for precise risk management
Customizable line styles, colors, and label formats
Order Blocks
Identifies institutional order flow zones where significant buying or selling occurred.
Box or Line display styles
Filter by direction: Both, Bullish, Bearish, or CISD Direction
CISD Direction mode only shows Order Blocks that align with the current market bias
Automatic invalidation when price mitigates the zone
Market Structure Levels
Tracks key liquidity levels that institutional traders target.
Minor Levels: Intermediate swing highs/lows (Buyside/Sellside)
Major Levels: Significant swing points with higher timeframe relevance
Automatic fill detection with optional historical display
Customizable display modes: Label Only, Price Only, Both, or Minimalistic
Fair Value Gaps (FVGs)
Detects price imbalances created by aggressive market moves.
Three display styles: Normal, Minimalist, and Classic
Optional Volume Imbalance detection (body-to-body gaps)
50% Consequent Encroachment line
Proximity-based display showing FVGs closest to current price
Inversion Fair Value Gaps (IFVGs)
Identifies when price inverts through an existing FVG, flipping its directional bias.
Automatic conversion from FVG to IFVG on body close
Configurable lookback period to filter old inversions
Independent display controls from regular FVGs
Invalidation tracking when price closes through the zone
Higher Timeframe FVGs
Displays Fair Value Gaps from higher timeframes on your current chart.
Auto Timeframe selection based on your chart
Manual timeframe override option
Seamless integration with lower timeframe analysis
SMT Divergences
Detects Smart Money Tool divergences between correlated instruments.
Auto SMT Mode: Automatically selects correlated pairs for:
Index Futures (NQ, ES, YM, RTY)
Metals (GC, SI, PL)
Energy (CL, RB, NG)
Forex Majors
Crypto (BTC, ETH)
Manual symbol selection for custom pairs
Dual symbol comparison for confluence
Automatic invalidation tracking
Session Filters
Limit all setups to specific trading sessions.
Two configurable session windows
Multiple timezone support
Applies to: FVGs, IFVGs, CISDs, Order Blocks, and SMTs
Active on timeframes ≤ 1 hour
Customization
Every component offers extensive customization:
Individual toggle controls for each feature
Color settings for bullish/bearish elements
Multiple line styles (Solid, Dashed, Dotted)
Label size and position options
Transparency controls
Historical display limits
This indicator is for educational and informational purposes only. It does not constitute financial advice. Past performance is not indicative of future results. Always conduct your own analysis and manage risk appropriately.

ALT Risk Metric StrategyHere's a professional write-up for your ALT Risk Strategy script:
ALT/BTC Risk Strategy - Multi-Crypto DCA with Bitcoin Correlation Analysis
Overview
This strategy uses Bitcoin correlation as a risk indicator to time entries and exits for altcoins. By analyzing how your chosen altcoin performs relative to Bitcoin, the strategy identifies optimal accumulation periods (when alt/BTC is oversold) and profit-taking opportunities (when alt/BTC is overbought). Perfect for traders who want to outperform Bitcoin by strategically timing altcoin positions.
Key Innovation: Why Alt/BTC Matters
Most traders focus solely on USD price, but Alt/BTC ratios reveal true altcoin strength:
When Alt/BTC is low → Altcoin is undervalued relative to Bitcoin (buy opportunity)
When Alt/BTC is high → Altcoin has outperformed Bitcoin (take profits)
This approach captures the rotation between BTC and alts that drives crypto cycles
Key Features
📊 Advanced Technical Analysis
RSI (60% weight): Primary momentum indicator on weekly timeframe
Long-term MA Deviation (35% weight): Measures distance from 150-period baseline
MACD (5% weight): Minor confirmation signal
EMA Smoothing: Filters noise while maintaining responsiveness
All calculations performed on Alt/BTC pairs for superior market timing
💰 3-Tier DCA System
Level 1 (Risk ≤ 70): Conservative entry, base allocation
Level 2 (Risk ≤ 50): Increased allocation, strong opportunity
Level 3 (Risk ≤ 30): Maximum allocation, extreme undervaluation
Continuous buying: Executes every bar while below threshold for true DCA behavior
Cumulative sizing: L3 triggers = L1 + L2 + L3 amounts combined
📈 Smart Profit Management
Sequential selling: Must complete L1 before L2, L2 before L3
Percentage-based exits: Sell portions of position, not fixed amounts
Auto-reset on re-entry: New buy signals reset sell progression
Prevents premature full exits during volatile conditions
🤖 3Commas Automation
Pre-configured JSON webhooks for Custom Signal Bots
Multi-exchange support: Binance, Coinbase, Kraken, Bitfinex, Bybit
Flexible quote currency: USD, USDT, or BUSD
Dynamic order sizing: Automatically adjusts to your tier thresholds
Full webhook documentation compliance
🎨 Multi-Asset Support
Pre-configured for popular altcoins:
ETH (Ethereum)
SOL (Solana)
ADA (Cardano)
LINK (Chainlink)
UNI (Uniswap)
XRP (Ripple)
DOGE
RENDER
Custom option for any other crypto
How It Works
Risk Metric Calculation (0-100 scale):
Fetches weekly Alt/BTC price data for stability
Calculates RSI, MACD, and deviation from 150-period MA
Normalizes MACD to 0-100 range using 500-bar lookback
Combines weighted components: (MACD × 0.05) + (RSI × 0.60) + (Deviation × 0.35)
Applies 5-period EMA smoothing for cleaner signals
Color-Coded Risk Zones:
Green (0-30): Extreme buying opportunity - Alt heavily oversold vs BTC
Lime/Yellow (30-70): Accumulation range - favorable risk/reward
Orange (70-85): Caution zone - consider taking initial profits
Red/Maroon (85-100+): Euphoria zone - aggressive profit-taking
Entry Logic:
Buys execute every candle when risk is below threshold
As risk decreases, position sizing automatically scales up
Example: If risk drops from 60→25, you'll be buying at L1 rate until it hits 50, then L2 rate, then L3 rate
Exit Logic:
Sells only trigger when in profit AND risk exceeds thresholds
Sequential execution ensures partial profit-taking
If new buy signal occurs before all sells complete, sell levels reset to L1
Configuration Guide
Choosing Your Altcoin:
Select crypto from dropdown (or use CUSTOM for unlisted coins)
Pick your exchange
Choose quote currency (USD, USDT, BUSD)
Risk Metric Tuning:
Long Term MA (default 150): Higher = more extreme signals, Lower = more frequent
RSI Length (default 10): Lower = more volatile, Higher = smoother
Smoothing (default 5): Increase for less noise, decrease for faster reaction
Buy Settings (Aggressive DCA Example):
L1 Threshold: 70 | Amount: $5
L2 Threshold: 50 | Amount: $6
L3 Threshold: 30 | Amount: $7
Total L3 buy = $18 per candle when deeply oversold
Sell Settings (Balanced Exit Example):
L1: 70 threshold, 25% position
L2: 85 threshold, 35% position
L3: 100 threshold, 40% position (final exit)
3Commas Setup
Bot Configuration:
Create Custom Signal Bot in 3Commas
Set trading pair to your altcoin/USD (e.g., ETH/USD, SOL/USDT)
Order size: Select "Send in webhook, quote" to use strategy's dollar amounts
Copy Bot UUID and Secret Token
Script Configuration:
Paste credentials into 3Commas section inputs
Check "Enable 3Commas Alerts"
Save and apply to chart
TradingView Alert:
Create Alert → Condition: "alert() function calls only"
Webhook URL: api.3commas.io
Enable "Webhook URL" checkbox
Expiration: Open-ended
Strategy Advantages
✅ Outperform Bitcoin: Designed specifically to beat BTC by timing alt rotations
✅ Capture Alt Seasons: Automatically accumulates when alts lag, sells when they pump
✅ Risk-Adjusted Sizing: Buys more when cheaper (better risk/reward)
✅ Emotional Discipline: Systematic approach removes fear and FOMO
✅ Multi-Asset: Run same strategy across multiple altcoins simultaneously
✅ Proven Indicators: Combines RSI, MACD, and MA deviation - battle-tested tools
Backtesting Insights
Optimal Timeframes:
Daily chart: Best for backtesting and signal generation
Weekly data is fetched internally regardless of display timeframe
Historical Performance Characteristics:
Accumulates heavily during bear markets and BTC dominance periods
Captures explosive altcoin rallies when BTC stagnates
Sequential selling preserves capital during extended downtrends
Works best on established altcoins with multi-year history
Risk Considerations:
Requires capital reserves for extended accumulation periods
Some altcoins may never recover if fundamentals deteriorate
Past correlation patterns may not predict future performance
Always size positions according to personal risk tolerance
Visual Interface
Indicator Panel Displays:
Dynamic color line: Green→Lime→Yellow→Orange→Red as risk increases
Horizontal threshold lines: Dashed lines mark your buy/sell levels
Entry/Exit labels: Green labels for buys, Orange/Red/Maroon for sells
Real-time risk value: Numerical display on price scale
Customization:
All threshold lines are adjustable via inputs
Color scheme clearly differentiates buy zones (green spectrum) from sell zones (red spectrum)
Line weights emphasize most extreme thresholds (L3 buy and L3 sell)
Strategy Philosophy
This strategy is built on the principle that altcoins move in cycles relative to Bitcoin. During Bitcoin rallies, alts often bleed against BTC (high sell, accumulate). When Bitcoin consolidates, alts pump (take profits). By measuring risk on the Alt/BTC chart instead of USD price, we time these rotations with precision.
The 3-tier system ensures you're always averaging in at better prices and scaling out at better prices, maximizing your Bitcoin-denominated returns.
Advanced Tips
Multi-Bot Strategy:
Run this on 5-10 different altcoins simultaneously to:
Diversify correlation risk
Capture whichever alt is pumping
Smooth equity curve through rotation
Pairing with BTC Strategy:
Use alongside the BTC DCA Risk Strategy for complete portfolio coverage:
BTC strategy for core holdings
ALT strategies for alpha generation
Rebalance between them based on BTC dominance
Threshold Calibration:
Check 2-3 years of historical data for your chosen alt
Note where risk metric sat during major bottoms (set buy thresholds)
Note where it peaked during euphoria (set sell thresholds)
Adjust for your risk tolerance and holding period
Credits
Strategy Development & 3Commas Integration: Claude AI (Anthropic)
Technical Analysis Framework: RSI, MACD, Moving Average theory
Implementation: pommesUNDwurst
Disclaimer
This strategy is for educational purposes only. Cryptocurrency trading involves substantial risk of loss. Altcoins are especially volatile and many fail completely. The strategy assumes liquid markets and reliable Alt/BTC price data. Always do your own research, understand the fundamentals of any asset you trade, and never risk more than you can afford to lose. Past performance does not guarantee future results. The authors are not financial advisors and assume no liability for trading decisions.
Additional Warning: Using leverage or trading illiquid altcoins amplifies risk significantly. This strategy is designed for spot trading of established cryptocurrencies with deep liquidity.
Tags: Altcoin, Alt/BTC, DCA, Risk Metric, Dollar Cost Averaging, 3Commas, ETH, SOL, Crypto Rotation, Bitcoin Correlation, Automated Trading, Alt Season
Feel free to modify any sections to better match your style or add specific backtesting results you've observed! 🚀Claude is AI and can make mistakes. Please double-check responses. Sonnet 4.5

BTC DCA Risk Metric StrategyBTC DCA Risk Strategy - Automated Dollar Cost Averaging with 3Commas Integration
Overview
This strategy combines the proven Oakley Wood Risk Metric with an intelligent tiered Dollar Cost Averaging (DCA) system, designed to help traders systematically accumulate Bitcoin during periods of low risk and take profits during high-risk conditions.
Key Features
📊 Multi-Component Risk Assessment
4-Year SMA Deviation: Measures Bitcoin's distance from its long-term mean
20-Week MA Analysis: Tracks medium-term momentum shifts
50-Day/50-Week MA Ratio: Captures short-to-medium term trend strength
All metrics are normalized by time to account for Bitcoin's maturing market dynamics
💰 3-Tier DCA Buy System
Level 1 (Low Risk): Conservative entry with base allocation
Level 2 (Lower Risk): Increased allocation as opportunity improves
Level 3 (Extreme Low Risk): Maximum allocation during rare buying opportunities
Buys execute every bar while risk remains below thresholds, enabling true DCA accumulation
📈 Progressive Profit Taking
Sell Level 1: Take initial profits as risk increases
Sell Level 2: Scale out further positions during elevated risk
Sell Level 3: Final exit during extreme market conditions
Sell levels automatically reset when new buy signals occur, allowing flexible re-entry
🤖 3Commas Integration
Fully automated webhook alerts for Custom Signal Bots
JSON payloads formatted per 3Commas API specifications
Supports multiple exchanges (Binance, Coinbase, Kraken, Gemini, Bybit)
Configurable quote currency (USD, USDT, BUSD)
How It Works
The strategy calculates a composite risk metric (0-1 scale):
0.0-0.2: Extreme buying opportunity (green zone)
0.2-0.5: Favorable accumulation range (yellow zone)
0.5-0.8: Neutral to cautious territory (orange zone)
0.8-1.0+: High risk, profit-taking zone (red zone)
Buy Logic: As risk decreases, position sizes increase automatically. If risk drops from L1 to L3 threshold, the strategy combines all three tier allocations for maximum exposure.
Sell Logic: Sequential profit-taking ensures you capture gains progressively. The system won't advance to Sell L2 until L1 completes, preventing premature full exits.
Configuration
Risk Metric Parameters:
All calculations use Bitcoin price data (any BTC chart works)
Time-normalized formulas adapt to market maturity
No manual parameter tuning required
Buy Settings:
Set risk thresholds for each tier (default: 0.20, 0.10, 0.00)
Define dollar amounts per tier (default: $10, $15, $20)
Fully customizable to your risk tolerance and capital
Sell Settings:
Configure risk thresholds for profit-taking (default: 1.00, 1.50, 2.00)
Set percentage of position to sell at each level (default: 25%, 35%, 40%)
3Commas Setup:
Create a Custom Signal Bot in 3Commas
Copy Bot UUID and Secret Token into strategy inputs
Enable 3Commas Alerts checkbox
Create TradingView alert: Condition → "alert() function calls only", Webhook → api.3commas.io
Backtesting Results
Strengths:
Systematically buys dips without emotion
Averages down during extended bear markets
Captures explosive bull run profits through tiered exits
Pyramiding (1000 max orders) allows true DCA behavior
Considerations:
Requires sufficient capital for multiple buys during prolonged downtrends
Backtest on Daily timeframe for most reliable signals
Past performance does not guarantee future results
Visual Design
The indicator pane displays:
Color-coded risk metric line: Changes from white→red→orange→yellow→green as risk decreases
Background zones: Green (buy), yellow (hold), red (sell) areas
Dashed threshold lines: Clear visual markers for each buy/sell level
Entry/Exit labels: Green buy labels and orange/red sell labels mark all trades
Credits
Original Risk Metric: Oakley Wood
Strategy Development & 3Commas Integration: Claude AI (Anthropic)
Modifications: pommesUNDwurst
Disclaimer
This strategy is for educational and informational purposes only. Cryptocurrency trading carries substantial risk of loss. Always conduct your own research and never invest more than you can afford to lose. The authors are not financial advisors and assume no responsibility for trading decisions made using this tool.

Kriptano Short IndicatorИндикатор "KRIPTANO SHORT INDICATOR" 🚀 объединяет мощные инструменты для трейдинга: детектирование резких движений (пампов) 🔥 и построение уровней сопротивления с возможностью ручного выбора диапазона 📏.
Он анализирует рост цены выдавая сигнал SHORT⚠️. Уровни сопротивления строятся по таймфреймам от 5 минут до недели, с возможностью настройки цвета и отображения пробитых уровней 🎨. Встроен объёмный профиль с ручным выбором диапазона, который позволяет визуализировать распределение объёма по ценам💹.
Индикатор удобен для поиска точек входа и анализа рыночных структур на различных таймфреймах 📊
The "KRIPTANO SHORT INDICATOR" 🚀 combines powerful tools for trading: detecting sharp moves (pumps) 🔥 and building resistance levels with the ability to manually select the range 📏.
It analyzes price growth and generates a SHORT signal ⚠️. Resistance levels are built on timeframes from 5 minutes up to 1 week, with flexible color settings and the option to display broken levels 🎨. A built‑in volume profile with manual range selection allows you to visualize volume distribution by price 💹.
The indicator is convenient for finding entry points and analyzing market structure across different timeframes 📊.
