01 TMA Centered BandsA dynamic, adaptive volatility channel used to identify trend direction, overbought/oversold zones, and precise reversal points.
Features:
Real-time centered TMA calculation
Market volatility detection
Reversal zones with high-probability signals
Works on all timeframes and assets
Benefits:
Helps you catch early trend shifts
Filters out market noise during ranging periods
Indicateurs et stratégies

Fibot X: LDO Hyperliquid (Katōshi) Auto StrategyFibot X v4 – Hyperliquid LDO Edition (Katōshi Connector)
This Fibot X v4 edition is specially optimized for trading LDO on the Hyperliquid DEX, with native Katōshi connector integration for fast, stable automated execution.
The system has been internally tuned to match LDO’s volatility and structural behavior on Hyperliquid while preserving the original Fibot X engine: precise entries, progressive TP management, risk control, and long-term consistency.
⚙️ Operational Requirements
• Mandatory timeframe: 30 minutes
• Fixed leverage: x1 (higher leverage reduces system consistency)
• Each bot must operate with its own dedicated initial capital
Features
• Exclusive internal optimization for LDO
• Full automation through Katōshi
• Logic adapted to decentralized environments
• Structured multi-TP risk-managed system
• Reliable backtesting with a stable performance curve
Designed for algorithmic traders seeking accuracy and consistency in a focused asset.
(For access or subscription details, check my X profile linked here.)

Vdubus MacD Divergence Trend Break Signal Generator Vdubus Divergence Wave Theory v1
System Type: Momentum Trendline Breakout & Continuation Model Platform:
1. Executive Summary
The Vdubus Divergence Wave Theory v1 is a sophisticated trend-following and reversal strategy developed over a 10-year period. Unlike standard indicators that rely on simple crossovers, this system applies Price Action geometry (Trendlines) directly to Momentum (MACD).
PREVIOUS DIVERGENCE PROJECTS FUTURE TREND BREAKS/ REVERSALS !
The core philosophy is that momentum breaks trendlines before price does. By identifying compression in the MACD oscillator and trading the breakout of that compression, the system identifies high-probability entries for both Reversals and Trend Continuations.
2. Core Logic & Methodology
The indicator operates on three specific layers of logic:
A. The Engine (Modified MACD)
It utilizes a custom-tuned MACD (Moving Average Convergence Divergence) to smooth out noise while retaining responsiveness.
Fast Length: 12
Slow Length: 34 (Smoother than the standard 26)
Signal Smoothing: 5
B. Dynamic Trendline Projection (The "Divergence" Aspect)
The script uses a Pivot-based algorithm to mathematically identify peaks and troughs in momentum.
Resistance Projection: It identifies lower highs in the MACD (momentum is fading) and projects a red resistance line forward.
Support Projection: It identifies higher lows in the MACD (momentum is building) and projects a blue support line forward.
The Trigger: A signal is generated only when the MACD line physically crosses these invisible projected barriers.
C. The Wave Theory (Signal Classification)
The system distinguishes between "Reversals" and "Continuations" based on the Zero Line.
Below Zero: Considered "Bearish Territory." A break upward here is a Reversal.
Above Zero: Considered "Bullish Territory." A break upward here is Momentum Continuation (Overbought).
3. Signal Types & Visual Guide
The indicator outputs four distinct signals, color-coded for instant decision-making.
🟢 1. LONG (Standard Reversal)
Condition: MACD breaks a Resistance Trendline while Below Zero.
Meaning: Momentum has finished causing the price to drop and is reversing upward. This is often a "Buy the Bottom" signal.
Visuals: Green Box, Green "LONG" Label.
🔵 2. OB-CONT (Overbought Continuation)
Condition: MACD breaks a Resistance Trendline while Above Zero.
Meaning: The trend is already bullish, but momentum consolidated briefly before exploding higher. This indicates a "Second Wave" or trend continuation.
Visuals: Blue Box (Thick Border), Bright Blue "OB-CONT" Label.
🔴 3. SHORT (Standard Reversal)
Condition: MACD breaks a Support Trendline while Above Zero.
Meaning: Momentum has exhausted to the upside and is rolling over. This is often a "Sell the Top" signal.
Visuals: Red Box, Red "SHORT" Label.
🟠 4. OS-CONT (Oversold Continuation)
Condition: MACD breaks a Support Trendline while Below Zero.
Meaning: The trend is already bearish, but price paused briefly before dropping further. This indicates a "Waterfall" or trend continuation downward.
Visuals: Orange Box (Thick Border), Bright Orange "OS-CONT" Label.
4. Technical Settings (Inputs)
Users can adjust the sensitivity of the "Wave" detection:
Pivot Lookback Left (Default: 20): How many bars to the left the script checks to confirm a major peak/valley. Higher numbers = fewer, more significant signals. Lower numbers = more signals, potentially more noise.
Pivot Lookback Right (Default: 20): The confirmation period. A value of 20 ensures that the pivot used for the trendline is a significant structural point, not just a small blip.
5. Best Practices for Trading
The Box Break: The coloured box drawn around the signal represents the "Breakout Candle." A strong close outside this box often confirms the move.
Zero Line Authority: Pay attention to where the cross happens.
Crosses occurring near the Zero Line are often the most explosive, as they represent a full momentum shift.
Deep Continuation Signals (e.g., an OB-CONT very high up) should be treated with caution as the move might be exhausted.
Divergence Context: This tool is designed to visualize the breaking of divergence. When you see a Price making higher highs but the MACD making lower highs (Divergence), wait for the Red Line Break (Short Signal) to confirm the trade.

Consolidation and Breakout StrategyConsolidation and Breakout Strategy
This strategy is designed to detect tight consolidation zones followed by a strong breakout, allowing traders to capture explosive moves with high precision.
It works on every instrument (indices, stocks, crypto, futures, FX) and on every timeframe, as the consolidation logic is fully dynamic and adapts automatically based on volatility.
How It Works
The strategy finds periods of low volatility using a candle-body volatility filter.
When candles remain small for several bars, the script marks a consolidation box.
A valid breakout occurs only when:
The breakout candle is significantly larger (volatility expansion), and
Price closes outside the consolidation range with strong momentum.
A position is opened immediately on the breakout (on bar close).
Predefined TP/SL levels, with optional partial exits, manage the trade.
Default Performance (NQ 1-Minute Example)
With default parameters, using NASDAQ Futures (NQ) on the 1-minute chart, the strategy historically shows:
Win Rate: ~62.75%
Profit Factor: ~1.70
These numbers vary by provider and data source, but they highlight how well this structure performs in high-volatility markets.
Fully Customizable
Every key parameter is adjustable:
Consolidation detection sensitivity
Breakout strength threshold
TP/SL multipliers or percentages
Session filters
Partial exit logic
Visuals (boxes, colors, signals)
You can fine-tune the settings for your preferred instrument and timeframe.
Recommended Markets
This breakout structure works especially well on:
Index futures (NQ, ES, YM, DAX, FTSE)
Major crypto pairs
High-volume stocks
FX pairs with clean intraday movement

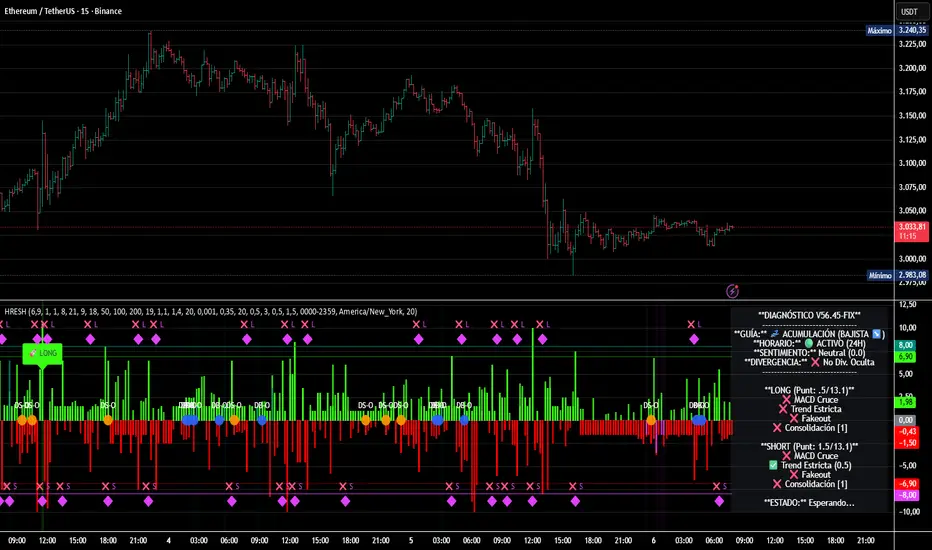
HRESH Pro Dashboard 🦅 HRESH (The Beast) — BTC Specialized System V56.45
This is the fully unlocked, 24-hour version of the HRESH System. It has been mathematically tuned and calibrated specifically for Bitcoin volatility.
🛑 CRITICAL RULES FOR USE (PLEASE READ):
1. STRICT ASSET SELECTION:
BTC (Bitcoin): This is the primary asset for this indicator.
ETH (Ethereum): Allowed ONLY on the 15-Minute timeframe.
❌ DO NOT USE on other assets (Forex, Altcoins, Stocks). The internal logic is unique to BTC/ETH structure.
2. TIMEFRAME STRATEGY:
⏱️ 1 MINUTE (Daily Operations): Use this for intraday scalping.
⏱️ 15 MINUTES (Sniper Mode): Use this for Swing Trading. Expect only 1 or 2 high-precision signals PER MONTH. This mode requires extreme patience.
❌ OTHER TIMEFRAMES: Do not operate. The calculations will be incorrect.
🌍 TRADING SESSIONS & VOLUME: While this version functions 24 hours a day, I strongly advise AGAINST trading during low-volume hours (such as late Asian session or weekends).
✅ RECOMMENDED: London & New York Sessions.
⚠️ HIGH RISK: Trading off-hours increases the risk of market manipulation and fakeouts.
🔴🔴🔴 RISK DISCLAIMER & WARNING 🔴🔴🔴
YOU ARE RESPONSIBLE FOR YOUR CAPITAL. This indicator is a powerful analytical tool, but it does not guarantee profits.
MARKET RISK: Trading cryptocurrency involves substantial risk of loss and is not suitable for every investor.
NO FINANCIAL ADVICE: Always manage your risk properly. If you trade outside the recommended hours or assets, you accept 100% of the risk.
Trade wisely and respect the algorithm.
By Lendrush Margaryan
Fibot X: YGG Hyperliquid (Katōshi) Auto StrategyFibot X – Hyperliquid YGG Edition (Katōshi Connector)
This Fibot X v4 edition is specially optimized for trading YGG on the Hyperliquid DEX, with native Katōshi connector integration for fast, stable automated execution.
The system has been internally tuned to match YGG’s volatility and structural behavior on Hyperliquid while preserving the original Fibot X engine: precise entries, progressive TP management, risk control, and long-term consistency.
⚙️ Operational Requirements
• Mandatory timeframe: 30 minutes
• Fixed leverage: x1 (higher leverage reduces system consistency)
• Each bot must operate with its own dedicated initial capital
Features
• Exclusive internal optimization for YGG
• Full automation through Katōshi
• Logic adapted to decentralized environments
• Structured multi-TP risk-managed system
• Reliable backtesting with a stable performance curve
Designed for algorithmic traders seeking accuracy and consistency in a focused asset.
(For access or subscription details, check my X profile linked here.)

SwgMFI
⸻
🧭 Description (for TradingView)
Swing Filter MFI + Divergence + Exhaustion
This indicator is designed to identify swing phases, momentum shifts, and exhaustion points using a refined version of the Money Flow Index (MFI).
It combines multi-layer filters to help traders visualize when momentum is building, fading, or reversing.
⸻
⚙️ Core Logic
• MFI Momentum Wave
Displays normalized money flow pressure (–60 to +60).
Gray zone = neutral.
Red/Green extensions = strong momentum bursts beyond upper/lower bands.
• Exhaustion Detection
Highlights orange (bull exhaustion) and blue (bear exhaustion) zones when momentum starts to fade after an extended move.
• Divergence Recognition
Plots circles when price makes new highs/lows but MFI fails to confirm — signaling potential turning points.
• Swing Confirmation Signals
Buy/Sell triangles appear when a recent exhaustion or divergence is followed by a re-entry into normal momentum range, confirming a likely swing reversal.
Frequency is automatically throttled to avoid multiple signals during one move.
⸻
💡 How to Use
1. Use red/green blocks to identify strong momentum zones.
2. Watch for orange/blue exhaustions — they often mark late-trend fatigue.
3. A BUY▲ signal suggests bearish exhaustion followed by recovery momentum.
4. A SELL▼ signal suggests bullish exhaustion followed by declining momentum.
5. Combine with your trend filter (EMA/Bollinger) for confirmation.
⸻
🧩 Best Settings
• MFI length: 14
• Upper / Lower bands: ±40
• Slope sensitivity: 1.5
• Signal lookback: 5
• Minimum gap between signals: 10 bars
⸻
📊 Built For
Swing traders, momentum scalpers, and algorithmic strategists who need early exhaustion cues rather than lagging trend indicators.
Can be used on any asset or timeframe (works exceptionally well on 4H and Daily charts).
⸻
✍️ Credits
Concept & logic refinement by @kkbst88
Based on original MFI/RSI work by LazyBear & SeiglerJ (open-source community).

CPR AB
Pivots are extremely powerful price based support and resistance levels that are calculated using a prior period's high, low and close. Camarilla Pivots are a set of 8 intraday support/resistance levels developed by Nick Scott (1989). They help traders forecast intraday reversals, breakouts, and trend continuation with high accuracy.
Levels Defined
• S1, S2, S3, S4 → Support levels
• R1, R2, R3, R4 → Resistance levels
Most important levels for trading:
• S3 – Buy zone (supports reversal)
• R3 – Sell zone (resistance reversal)
• S4 – Breakdown zone
• R4 – Breakout zone
CPR TREND CONTINUATION PATTERN
Bullish Continuation:
1. Yesterday closed above CPR
2. Today CPR shifts upward
3. S3 also rises above previous value
4. Price holds above CPR
5. R3 breaks → R4 likely
This is a multi-day institutional trend signal.
Bearish Continuation: Opposite logic.
In this Indicator you have the following:
1. CPR with traditional support and resistance levels (S1-S4 & R1-R4).
2. Developing camarilla CPR for next trading day, week, and month.
3. Customizable lookback period, line width.
4. Option to show/hide labels, prices, SR levels, developing CPR
5. Previous period High, Close and Open Levels

ZY Target TerminatorThe indicator follows trends and generates short and long signals. Furthermore, when it generates a signal, it displays the maximum profit margins for the last three signals it generated in the same direction. It also clearly indicates the number of candles for which no signal has been generated for the pair. Avoid trading pairs whose profit margins do not align with your trading strategy.

Fibot X: CAKE Hyperliquid (Katōshi) Auto StrategyFibot X – Hyperliquid CAKE Edition (Katōshi Connector)
This Fibot X v4 edition is specially optimized for trading CAKE on the Hyperliquid DEX, with native Katōshi connector integration for fast, stable automated execution.
The system has been internally tuned to match CAKE’s volatility and structural behavior on Hyperliquid while preserving the original Fibot X engine: precise entries, progressive TP management, risk control, and long-term consistency.
⚙️ Operational Requirements
• Mandatory timeframe: 30 minutes
• Fixed leverage: x1 (higher leverage reduces system consistency)
• Each bot must operate with its own dedicated initial capital
Features
• Exclusive internal optimization for CAKE
• Full automation through Katōshi
• Logic adapted to decentralized environments
• Structured multi-TP risk-managed system
• Reliable backtesting with a stable performance curve
Designed for algorithmic traders seeking accuracy and consistency in a focused asset.
(For access or subscription details, check my X profile linked here.)

Volume Trend Analysis Pro📘 How to Use – Volume Blast Analyzer Pro (VBA Pro)
High-Accuracy Volume Blast • Breakout Model • Wyckoff Spring/Upthrust • Trend-Volume Matrix • SIVA Volume Analyzer
🧩 1. Overview
VBA Pro is a complete volume-based trading system that detects:
🔥 Volume Blasts (Bull/Bear/Neutral)
📈 True & False Breakouts
🟦 Wyckoff Springs & Upthrusts
📊 Trend–Volume Matrix (11×11 system)
🟪 SIVA Volume Analyzer states
🟧 Volume Spike events
🔍 Multi-filter confirmation
This tool identifies both momentum continuation and manipulation-based reversals, making it ideal for intraday, swing, and SMC/Wyckoff traders.
🟦 2. Core Components:
A. Volume Blast Detector
Triggered when any of these filters activate:
RVOL Blast (Relative Volume explosion)
Range Blast (Large candle body + large volume)
Volume × ATR Blast (Volatility-weighted volume surge)
Color System (by direction):
🟢 Bullish Blast
🔴 Bearish Blast
⚪ Neutral Blast
B. Wyckoff Model (Spring & Upthrust)
Automatically identifies:
Spring → Bullish liquidity sweep + reversal context
Upthrust → Bearish liquidity sweep + reversal context
Tooltip includes:
✔ Liquidity sweep
✔ Support/Resistance test
✔ Exhaustion or aggressive absorption
✔ Reversal probability
C. Breakout Detector (True/False)
True Breakout when:
Volume strong
Candle closes beyond levels
Trend aligned
No rejection wick
False Breakout when:
Wick rejection
Low confirmation volume
Immediate rejection back inside range
Plot:
TrBu → True Bull Breakout
TrBe → True Bear Breakout
❌ False Breakouts (Bull/Bear)
D. Trend–Volume Matrix (TVM 11×11)
Plots real-time market structure using:
Trend Value (–10 → +10)
Volume Value (–10 → +10)
Quadrants show:
Trend Continuation (Top-Right)
Volume Divergence (Top-Left)
Weakening Trend (Bottom-Right)
Distribution / Manipulation (Bottom-Left)
A 🔵 dot marks current market position.
Volume Trend Matrix shows where the market is sitting:
Top Right (green): Trend ↑ and Volume ↑ → strong confirmed up trend.
Top Left (red): Trend ↓ but Volume ↑ → strong sell momentum.
Bottom Right (blue): Trend ↑ but Volume ↓ → uptrend losing steam.
Bottom Left (yellow): Trend ↓ and Volume ↓ → weak bearish drift.
Dynamic Candle Coloring: Candles are colored by trend only: green for uptrends, red for downtrends, and orange near reversals.
Threshold Fills: The oscillator region is shaded green above +10 (healthy uptrend) and red
below -10 (strong downtrend) for instant confidence.
E. SIVA Volume Analyzer
Color-coded volume states:
🔥 Volume Spike
🟢 Higher Volume
🔴 Lower Volume
🟣 Extremely Low Volume
⚪ Neutral
🟩/🟥 Trend-confirming Volume
📈 3. Trading Examples
🔵 Bullish Setup:
Spring detected
Bullish Blast
Trend Value > 0
True Bull Breakout (optional)
Liquidity confirmation
🔴 Bearish Setup:
Upthrust detected
Bearish Blast
Trend Value < 0
True Bear Breakout
Weak volume pullback
🔔 4. Alerts
Alerts trigger for:
Volume Blast
Spring / Upthrust
Volume Spike
True & False Breakouts
Liquidity engagement
Trend–Volume quadrant changes
🛠 5. Settings Guide
All modules can be toggled independently:
Volume Blast Detector
Wyckoff Model
Breakout Model
Volume Spike Detector
Trend–Volume Matrix
Candle Colors
Label Shapes
🧠 6. Best Practices
Combine Trend–Volume Matrix + Blast for best confirmation
Avoid trading during neutral/grayed volume states
Springs/Upthrusts are strongest after consolidation
Use Breakout Model to avoid fakeouts

天然氣季節性策略 (假日順延修正版)Strategy Overview:
Period A (Early Injection Season Strategy):
Action: Establishes a long position on April 25 and exits on May 10 by default.
Logic: This captures the price support zone driven by the end of winter, depleted inventories, and rigid restocking demand.
Period B (Winter Premium Strategy):
Action: Establishes a long position on September 1 and exits on October 15 by default.
Logic: This capitalizes on the major uptrend fueled by the peak hurricane season compounded by the winter contract premium.
Trading Parameters:
Initial Capital: 100,000 USD
Position Size per Trade: 1 Contract
Commission per Trade: 2 USD

Yon Smart Money Step-In IndicatorDetects potential institutional buying when price is above VWAPmoney flow is positive, and volume spikes occur simultaneously.OBV is rising,

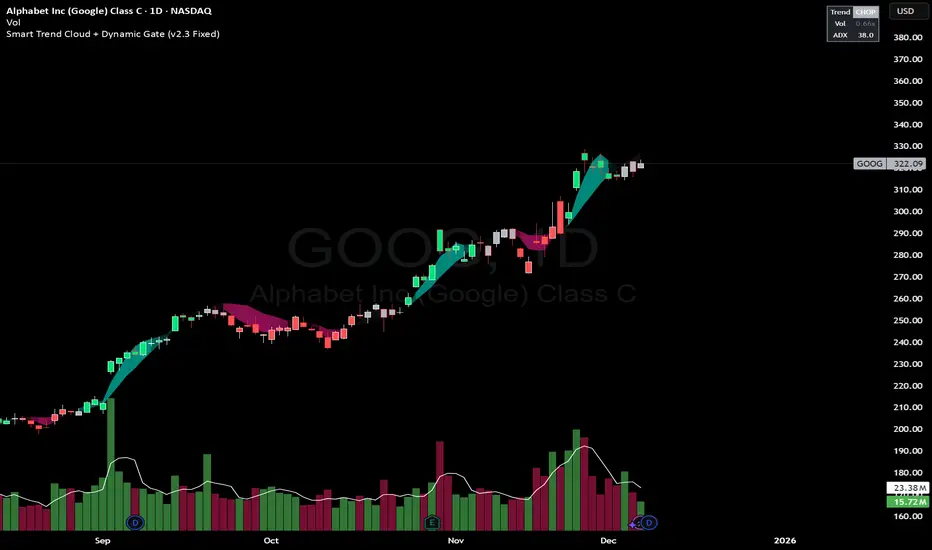
Smart Trend Cloud + Dynamic Gate (V 2.3)Smart Trend Cloud + Dynamic Gate
The Smart Trend Cloud + Dynamic Gate is a comprehensive trend-following system designed to filter out market noise and identify high-probability trend entries. Unlike simple Moving Average crossovers which often fail in ranging markets, this indicator employs a multi-stage validation system (The "Gate") combining Volume, Momentum, and Volatility filters to ensure you only trade when the market has conviction.
Key Features:
> Multi-Type Trend Cloud: Choose between HMA (Hull Moving Average), EMA, or ZeroLag EMA to define the trend baseline.
> The "Dynamic Gate" Filter: A crossover alone does not trigger a signal. The move must be validated by Relative Volume or MACD Histogram momentum within a specific window.
> Choppiness Suppression: Integrated ADX filter turns the candles gray during low-volatility consolidation zones to prevent over-trading.
> Stretch Bands: Optional ATR-based bands to highlight when price is over-extended from the mean.
> Live Dashboard: A table on the chart displaying current Trend State, Relative Volume strength, and ADX values.
How logic Works
1. Trend Definition & The Cloud The core trend is defined by the relationship between a Fast and Slow Moving Average.
Visuals: The space between these MA's forms the "Cloud". The cloud color transparency adjusts dynamically based on the strength of the trend (the spread between the MAs).
MA Options:
HMA: Best for scalping (1m/5m) due to low lag.
ZeroLag EMA: Custom calculation to reduce latency while retaining smoothness.
EMA: Standard trend following.
2. The Entry Gate (Validation) To avoid false signals during "whipsaw" price action, this script uses a logic gate. When a MA crossover occurs, it enters a "Pending" state. It only confirms a BULL or BEAR state if one of the following conditions is met within Gate Window bars:
Volume Spike: Relative Volume (Current Vol / Avg Vol) is greater than the defined threshold (default 1.2x).
Momentum Shift: The MACD Histogram confirms the direction of the trend.
3. Consolidation Filter The script calculates the ADX (Average Directional Index). If the ADX is below the Min ADX Strength threshold (default 20), the market is considered "Choppy."
Visual: Bars turn Gray.
Logic: Trend signals are suppressed until volatility expands.
4. Visual Dashboard A panel is located in the top-right corner providing real-time data:
Trend: Current State (Bull, Bear, or Chop).
Vol: Current Relative Volume (Green if > 1.0).
ADX: Current Trend Strength value.
Settings:
Trend Settings:
Adjust MA types and lengths to fit your timeframe.
Entry Gate: Toggle the Volume/Price gate on/off and adjust the Relative Volume requirement.
Consolidation: Enable/Disable the ADX filter to see all signals or only high-strength ones.
Visuals: Toggle the Cloud, Dashboard, or "Stretch Bands" (ATR bands) to declutter your chart.
Recommended Settings by Timeframe
Since different timeframes require different sensitivities to noise, here are the optimized settings for the Smart Trend Cloud:
⚡ 5 Minute Chart (Scalping)
Best for: Catching quick intraday momentum bursts while filtering chop.
MA Type: HMA (Hull Moving Average for speed)
Fast Length: 9
Slow Length: 21
Min Relative Volume: 1.3 (Requires higher volume to confirm entry)
Min ADX: 25 (Stricter chop filter)
⏱️ 15 Minute Chart (Intraday Swing)
Best for: Day trading with a balance of speed and stability.
MA Type: ZeroLag EMA (Reduces noise better than HMA)
Fast Length: 10
Slow Length: 30
Min Relative Volume: 1.2
Min ADX: 20
hrs 1 Hour Chart (Short-Term Swing)
Best for: Capturing the trend of the week.
MA Type: EMA or ZeroLag EMA
Fast Length: 12
Slow Length: 26 (Classic MACD correlation)
Min Relative Volume: 1.1
Min ADX: 20
📅 1 Day Chart (Position Trading)
Best for: Long-term trends and "Golden Cross" style entries.
MA Type: EMA (Standard Institutional Moving Average)
Fast Length: 20
Slow Length: 50
Min Relative Volume: 1.2
Min ADX: 15 (Allows for earlier entries on major trend shifts)
Alerts:
The script includes built-in alertcondition events for:
Trend Start: Bull (Valid trend detected after filtering).
Trend Start: Bear (Valid trend detected after filtering).
Access & Authorization
This is an Invite-Only script.
Smart Money Scanner Suite v6 - OptimizedWHAT IT DOES (longer version in the script):
// Identifies "Smart Money Stepping Back" (SMSB) zones where institutions quietly
// build positions without moving the market. Signals appear when ALL 4 conditions align:
//
// 1. OBV DIVERGENCE → Price up/OBV down (distribution) or Price down/OBV up (accumulation)
// 2. LOW VOLUME → Below 1.5x average (stealth activity)
// 3. NEAR VWAP → Within 0.5% (institutional fair value)
// 4. HTF CONFIRMATION → Higher timeframe shows directional momentum

JP7FX Signals ProJP7FX Signals Pro
Smart session signals based on structure, liquidity shifts and volatility filters.
Designed for use on the 1 minute timeframe.
What this tool does
This indicator builds signals around three things traders track every day.
• session ranges for Asia, Frankfurt, London and New York
• Fair Value Gap behaviour
• Supertrend shifts with volatility confirmation
The script draws each session range on your chart. It tracks when price breaks a session high or low, then checks if the market is above or below the daily open. These conditions help filter trades by direction during different sessions.
It also detects bullish and bearish Fair Value Gaps. The script tracks when an FVG forms, when price enters the imbalance and when it gets mitigated. These checks create part of the signal logic.
Supertrend is used as an extra filter. A crossover above or below the Supertrend gives a directional bias. When combined with session behaviour and FVG conditions, the script can mark possible long or short signals during London or New York.
How the signals form
A signal only prints when the script has all conditions in place.
This includes:
• a session range break in the correct direction
• a price position relative to the daily open
• confirmation from Supertrend
• FVG creation or mitigation on the right side of price
• liquidity taken in previous sessions
These rules reduce noise and avoid signals that appear in weak conditions.
What the indicator is for
• understanding how sessions behave on the 1 minute chart
• tracking liquidity behaviour
• seeing when a clean break and trend shift takes place
• getting notified when the market forms the conditions you set
This is not a buy or sell system on its own
Signals do not replace analysis. You still need market structure, higher timeframe direction, orderblocks or your own trade model.
A signal is only a prompt to look at the chart, not a confirmation to enter a trade.
Price can shift quickly around sessions, so check the context before acting on any alert.
Important notes
• designed for the 1 minute timeframe
• signals do not guarantee trend continuation
• conditions can form in strong or weak market phases
• use your own risk rules and validation before entering trades
JP7FX Signals Pro helps you track session behaviour and FVG interaction more efficiently, but trading decisions still need your full chart process.

HTF Po3 Multi Range Candle (@JP7FX)HTF Po3 Multi Range Candle (@JP7FX)
This indicator gives you a clear higher timeframe candle on any lower chart.
It updates in real time so you always see the live open, high, low and close as the candle builds.
You can add a second timeframe if you want two HTF candles side by side.
What it shows
• Live HTF candle shape and colour
• High and low points as they form
• Open, high and low extended across your chart
• Pip range, midpoint and progress percentage
• Countdown for the current HTF candle
• Bar-step mode for accurate timing in replay
• Individual colour settings for each HTF candle
• Optional price labels for open, high and low
Why use it
• You see the bigger timeframe without switching charts
• You know how far the HTF candle has moved
• You can track momentum as the candle forms
• You can watch key levels from higher timeframes
• You keep your focus on the lower timeframe you trade
Best uses
• Any lower timeframe execution
• Tracking HTF highs and lows
• Understanding candle strength and movement
• Identifying important reference levels
Notes
• In replay use Bar-Step timing for correct behaviour
• Candle size, colour and position are fully adjustable

st reversal detector" Highly accurate reversal-detection algorithm that identifies market reversals before they occur, focusing on early signals at swing highs and swing lows. The tool must work seamlessly with confluences such as RSI overbought/oversold levels, bullish or bearish divergence, and other reversal confirmations to filter only A+ setups. no lag, no repainting, and clear visual signals for intraday trading. The model should work exceptionally well on the 10-minute and 5-minute timeframes and be specifically optimized for XAUUSD m10 and ETH m5 timeframe ''

SR & POI Indicator//@version=5
indicator(title='SR & POI Indicator', overlay=true, max_boxes_count=500, max_lines_count=500, max_labels_count=500)
//============================================================================
// SUPPLY/DEMAND & POI SETTINGS
//============================================================================
swing_length = input.int(10, title = 'Swing High/Low Length', group = 'Supply/Demand Settings', minval = 1, maxval = 50)
history_of_demand_to_keep = input.int(20, title = 'History To Keep', group = 'Supply/Demand Settings', minval = 5, maxval = 50)
box_width = input.float(2.5, title = 'Supply/Demand Box Width', group = 'Supply/Demand Settings', minval = 1, maxval = 10, step = 0.5)
show_price_action_labels = input.bool(false, title = 'Show Price Action Labels', group = 'Supply/Demand Visual Settings')
supply_color = input.color(color.new(#EDEDED,70), title = 'Supply', group = 'Supply/Demand Visual Settings', inline = '3')
supply_outline_color = input.color(color.new(color.white,75), title = 'Outline', group = 'Supply/Demand Visual Settings', inline = '3')
demand_color = input.color(color.new(#00FFFF,70), title = 'Demand', group = 'Supply/Demand Visual Settings', inline = '4')
demand_outline_color = input.color(color.new(color.white,75), title = 'Outline', group = 'Supply/Demand Visual Settings', inline = '4')
bos_label_color = input.color(color.white, title = 'BOS Label', group = 'Supply/Demand Visual Settings')
poi_label_color = input.color(color.white, title = 'POI Label', group = 'Supply/Demand Visual Settings')
swing_type_color = input.color(color.black, title = 'Price Action Label', group = 'Supply/Demand Visual Settings')
//============================================================================
// SR SETTINGS
//============================================================================
enableSR = input(true, "SR On/Off", group="SR Settings")
colorSup = input(#00DBFF, "Support Color", group="SR Settings")
colorRes = input(#E91E63, "Resistance Color", group="SR Settings")
strengthSR = input.int(2, "S/R Strength", 1, group="SR Settings")
lineStyle = input.string("Dotted", "Line Style", , group="SR Settings")
lineWidth = input.int(2, "S/R Line Width", 1, group="SR Settings")
useZones = input(true, "Zones On/Off", group="SR Settings")
useHLZones = input(true, "High Low Zones On/Off", group="SR Settings")
zoneWidth = input.int(2, "Zone Width %", 0, tooltip="it's calculated using % of the distance between highest/lowest in last 300 bars", group="SR Settings")
expandSR = input(true, "Expand SR", group="SR Settings")
//============================================================================
// SUPPLY/DEMAND FUNCTIONS
//============================================================================
// Function to add new and remove last in array
f_array_add_pop(array, new_value_to_add) =>
array.unshift(array, new_value_to_add)
array.pop(array)
// Function for swing H & L labels
f_sh_sl_labels(array, swing_type) =>
var string label_text = na
if swing_type == 1
if array.get(array, 0) >= array.get(array, 1)
label_text := 'HH'
else
label_text := 'LH'
label.new(bar_index - swing_length, array.get(array,0), text = label_text, style=label.style_label_down, textcolor = swing_type_color, color = color.new(swing_type_color, 100), size = size.tiny)
else if swing_type == -1
if array.get(array, 0) >= array.get(array, 1)
label_text := 'HL'
else
label_text := 'LL'
label.new(bar_index - swing_length, array.get(array,0), text = label_text, style=label.style_label_up, textcolor = swing_type_color, color = color.new(swing_type_color, 100), size = size.tiny)
// Function to check overlapping
f_check_overlapping(new_poi, box_array, atr) =>
atr_threshold = atr * 2
okay_to_draw = true
for i = 0 to array.size(box_array) - 1
top = box.get_top(array.get(box_array, i))
bottom = box.get_bottom(array.get(box_array, i))
poi = (top + bottom) / 2
upper_boundary = poi + atr_threshold
lower_boundary = poi - atr_threshold
if new_poi >= lower_boundary and new_poi <= upper_boundary
okay_to_draw := false
break
else
okay_to_draw := true
okay_to_draw
// Function to draw supply or demand zone
f_supply_demand(value_array, bn_array, box_array, label_array, box_type, atr) =>
atr_buffer = atr * (box_width / 10)
box_left = array.get(bn_array, 0)
box_right = bar_index
var float box_top = 0.00
var float box_bottom = 0.00
var float poi = 0.00
if box_type == 1
box_top := array.get(value_array, 0)
box_bottom := box_top - atr_buffer
poi := (box_top + box_bottom) / 2
else if box_type == -1
box_bottom := array.get(value_array, 0)
box_top := box_bottom + atr_buffer
poi := (box_top + box_bottom) / 2
okay_to_draw = f_check_overlapping(poi, box_array, atr)
if box_type == 1 and okay_to_draw
box.delete( array.get(box_array, array.size(box_array) - 1) )
f_array_add_pop(box_array, box.new( left = box_left, top = box_top, right = box_right, bottom = box_bottom, border_color = supply_outline_color,
bgcolor = supply_color, extend = extend.right, text = 'SUPPLY', text_halign = text.align_center, text_valign = text.align_center, text_color = poi_label_color, text_size = size.small, xloc = xloc.bar_index))
box.delete( array.get(label_array, array.size(label_array) - 1) )
f_array_add_pop(label_array, box.new( left = box_left, top = poi, right = box_right, bottom = poi, border_color = color.new(poi_label_color,90),
bgcolor = color.new(poi_label_color,90), extend = extend.right, text = 'POI', text_halign = text.align_left, text_valign = text.align_center, text_color = poi_label_color, text_size = size.small, xloc = xloc.bar_index))
else if box_type == -1 and okay_to_draw
box.delete( array.get(box_array, array.size(box_array) - 1) )
f_array_add_pop(box_array, box.new( left = box_left, top = box_top, right = box_right, bottom = box_bottom, border_color = demand_outline_color,
bgcolor = demand_color, extend = extend.right, text = 'DEMAND', text_halign = text.align_center, text_valign = text.align_center, text_color = poi_label_color, text_size = size.small, xloc = xloc.bar_index))
box.delete( array.get(label_array, array.size(label_array) - 1) )
f_array_add_pop(label_array, box.new( left = box_left, top = poi, right = box_right, bottom = poi, border_color = color.new(poi_label_color,90),
bgcolor = color.new(poi_label_color,90), extend = extend.right, text = 'POI', text_halign = text.align_left, text_valign = text.align_center, text_color = poi_label_color, text_size = size.small, xloc = xloc.bar_index))
// Function to change supply/demand to BOS if broken
f_sd_to_bos(box_array, bos_array, label_array, zone_type) =>
if zone_type == 1
for i = 0 to array.size(box_array) - 1
level_to_break = box.get_top(array.get(box_array,i))
if close >= level_to_break
copied_box = box.copy(array.get(box_array,i))
f_array_add_pop(bos_array, copied_box)
mid = (box.get_top(array.get(box_array,i)) + box.get_bottom(array.get(box_array,i))) / 2
box.set_top(array.get(bos_array,0), mid)
box.set_bottom(array.get(bos_array,0), mid)
box.set_extend( array.get(bos_array,0), extend.none)
box.set_right( array.get(bos_array,0), bar_index)
box.set_text( array.get(bos_array,0), 'BOS' )
box.set_text_color( array.get(bos_array,0), bos_label_color)
box.set_text_size( array.get(bos_array,0), size.small)
box.set_text_halign( array.get(bos_array,0), text.align_center)
box.set_text_valign( array.get(bos_array,0), text.align_center)
box.delete(array.get(box_array, i))
box.delete(array.get(label_array, i))
if zone_type == -1
for i = 0 to array.size(box_array) - 1
level_to_break = box.get_bottom(array.get(box_array,i))
if close <= level_to_break
copied_box = box.copy(array.get(box_array,i))
f_array_add_pop(bos_array, copied_box)
mid = (box.get_top(array.get(box_array,i)) + box.get_bottom(array.get(box_array,i))) / 2
box.set_top(array.get(bos_array,0), mid)
box.set_bottom(array.get(bos_array,0), mid)
box.set_extend( array.get(bos_array,0), extend.none)
box.set_right( array.get(bos_array,0), bar_index)
box.set_text( array.get(bos_array,0), 'BOS' )
box.set_text_color( array.get(bos_array,0), bos_label_color)
box.set_text_size( array.get(bos_array,0), size.small)
box.set_text_halign( array.get(bos_array,0), text.align_center)
box.set_text_valign( array.get(bos_array,0), text.align_center)
box.delete(array.get(box_array, i))
box.delete(array.get(label_array, i))
// Function to extend box endpoint
f_extend_box_endpoint(box_array) =>
for i = 0 to array.size(box_array) - 1
box.set_right(array.get(box_array, i), bar_index + 100)
//============================================================================
// SR FUNCTIONS
//============================================================================
percWidth(len, perc) => (ta.highest(len) - ta.lowest(len)) * perc / 100
//============================================================================
// SUPPLY/DEMAND CALCULATIONS
//============================================================================
atr = ta.atr(50)
swing_high = ta.pivothigh(high, swing_length, swing_length)
swing_low = ta.pivotlow(low, swing_length, swing_length)
var swing_high_values = array.new_float(5,0.00)
var swing_low_values = array.new_float(5,0.00)
var swing_high_bns = array.new_int(5,0)
var swing_low_bns = array.new_int(5,0)
var current_supply_box = array.new_box(history_of_demand_to_keep, na)
var current_demand_box = array.new_box(history_of_demand_to_keep, na)
var current_supply_poi = array.new_box(history_of_demand_to_keep, na)
var current_demand_poi = array.new_box(history_of_demand_to_keep, na)
var supply_bos = array.new_box(5, na)
var demand_bos = array.new_box(5, na)
// New swing high
if not na(swing_high)
f_array_add_pop(swing_high_values, swing_high)
f_array_add_pop(swing_high_bns, bar_index )
if show_price_action_labels
f_sh_sl_labels(swing_high_values, 1)
f_supply_demand(swing_high_values, swing_high_bns, current_supply_box, current_supply_poi, 1, atr)
// New swing low
else if not na(swing_low)
f_array_add_pop(swing_low_values, swing_low)
f_array_add_pop(swing_low_bns, bar_index )
if show_price_action_labels
f_sh_sl_labels(swing_low_values, -1)
f_supply_demand(swing_low_values, swing_low_bns, current_demand_box, current_demand_poi, -1, atr)
f_sd_to_bos(current_supply_box, supply_bos, current_supply_poi, 1)
f_sd_to_bos(current_demand_box, demand_bos, current_demand_poi, -1)
f_extend_box_endpoint(current_supply_box)
f_extend_box_endpoint(current_demand_box)
//============================================================================
// SR CALCULATIONS & PLOTTING
//============================================================================
rb = 10
prd = 284
ChannelW = 10
label_loc = 55
style = lineStyle == "Solid" ? line.style_solid : lineStyle == "Dotted" ? line.style_dotted : line.style_dashed
ph = ta.pivothigh(rb, rb)
pl = ta.pivotlow (rb, rb)
sr_levels = array.new_float(21, na)
prdhighest = ta.highest(prd)
prdlowest = ta.lowest(prd)
cwidth = percWidth(prd, ChannelW)
zonePerc = percWidth(300, zoneWidth)
aas = array.new_bool(41, true)
u1 = 0.0, u1 := nz(u1 )
d1 = 0.0, d1 := nz(d1 )
highestph = 0.0, highestph := highestph
lowestpl = 0.0, lowestpl := lowestpl
var sr_levs = array.new_float(21, na)
label hlabel = na, label.delete(hlabel )
label llabel = na, label.delete(llabel )
var sr_lines = array.new_line(21, na)
var sr_linesH = array.new_line(21, na)
var sr_linesL = array.new_line(21, na)
var sr_linesF = array.new_linefill(21, na)
var sr_labels = array.new_label(21, na)
if ph or pl
for x = 0 to array.size(sr_levels) - 1
array.set(sr_levels, x, na)
highestph := prdlowest
lowestpl := prdhighest
countpp = 0
for x = 0 to prd
if na(close )
break
if not na(ph ) or not na(pl )
highestph := math.max(highestph, nz(ph , prdlowest), nz(pl , prdlowest))
lowestpl := math.min(lowestpl, nz(ph , prdhighest), nz(pl , prdhighest))
countpp += 1
if countpp > 40
break
if array.get(aas, countpp)
upl = (ph ? high : low ) + cwidth
dnl = (ph ? high : low ) - cwidth
u1 := countpp == 1 ? upl : u1
d1 := countpp == 1 ? dnl : d1
tmp = array.new_bool(41, true)
cnt = 0
tpoint = 0
for xx = 0 to prd
if na(close )
break
if not na(ph ) or not na(pl )
chg = false
cnt += 1
if cnt > 40
break
if array.get(aas, cnt)
if not na(ph )
if high <= upl and high >= dnl
tpoint += 1
chg := true
if not na(pl )
if low <= upl and low >= dnl
tpoint += 1
chg := true
if chg and cnt < 41
array.set(tmp, cnt, false)
if tpoint >= strengthSR
for g = 0 to 40 by 1
if not array.get(tmp, g)
array.set(aas, g, false)
if ph and countpp < 21
array.set(sr_levels, countpp, high )
if pl and countpp < 21
array.set(sr_levels, countpp, low )
// Plot SR
var line highest_ = na, line.delete(highest_)
var line lowest_ = na, line.delete(lowest_)
var line highest_fill1 = na, line.delete(highest_fill1)
var line highest_fill2 = na, line.delete(highest_fill2)
var line lowest_fill1 = na, line.delete(lowest_fill1)
var line lowest_fill2 = na, line.delete(lowest_fill2)
hi_col = close >= highestph ? colorSup : colorRes
lo_col = close >= lowestpl ? colorSup : colorRes
if enableSR
highest_ := line.new(bar_index - 311, highestph, bar_index, highestph, xloc.bar_index, expandSR ? extend.both : extend.right, hi_col, style, lineWidth)
lowest_ := line.new(bar_index - 311, lowestpl , bar_index, lowestpl , xloc.bar_index, expandSR ? extend.both : extend.right, lo_col, style, lineWidth)
if useHLZones
highest_fill1 := line.new(bar_index - 311, highestph + zonePerc, bar_index, highestph + zonePerc, xloc.bar_index, expandSR ? extend.both : extend.right, na)
highest_fill2 := line.new(bar_index - 311, highestph - zonePerc, bar_index, highestph - zonePerc, xloc.bar_index, expandSR ? extend.both : extend.right, na)
lowest_fill1 := line.new(bar_index - 311, lowestpl + zonePerc , bar_index, lowestpl + zonePerc , xloc.bar_index, expandSR ? extend.both : extend.right, na)
lowest_fill2 := line.new(bar_index - 311, lowestpl - zonePerc , bar_index, lowestpl - zonePerc , xloc.bar_index, expandSR ? extend.both : extend.right, na)
linefill.new(highest_fill1, highest_fill2, color.new(hi_col, 80))
linefill.new(lowest_fill1 , lowest_fill2 , color.new(lo_col, 80))
if ph or pl
for x = 0 to array.size(sr_lines) - 1
array.set(sr_levs, x, array.get(sr_levels, x))
for x = 0 to array.size(sr_lines) - 1
line.delete(array.get(sr_lines, x))
line.delete(array.get(sr_linesH, x))
line.delete(array.get(sr_linesL, x))
linefill.delete(array.get(sr_linesF, x))
if array.get(sr_levs, x) and enableSR
line_col = close >= array.get(sr_levs, x) ? colorSup : colorRes
array.set(sr_lines, x, line.new(bar_index - 355, array.get(sr_levs, x), bar_index, array.get(sr_levs, x), xloc.bar_index, expandSR ? extend.both : extend.right, line_col, style, lineWidth))
if useZones
array.set(sr_linesH, x, line.new(bar_index - 355, array.get(sr_levs, x) + zonePerc, bar_index, array.get(sr_levs, x) + zonePerc, xloc.bar_index, expandSR ? extend.both : extend.right, na))
array.set(sr_linesL, x, line.new(bar_index - 355, array.get(sr_levs, x) - zonePerc, bar_index, array.get(sr_levs, x) - zonePerc, xloc.bar_index, expandSR ? extend.both : extend.right, na))
array.set(sr_linesF, x, linefill.new(array.get(sr_linesH, x), array.get(sr_linesL, x), color.new(line_col, 80)))
for x = 0 to array.size(sr_labels) - 1
label.delete(array.get(sr_labels, x))
if array.get(sr_levs, x) and enableSR
lab_loc = close >= array.get(sr_levs, x) ? label.style_label_up : label.style_label_down
lab_col = close >= array.get(sr_levs, x) ? colorSup : colorRes
array.set(sr_labels, x, label.new(bar_index + label_loc, array.get(sr_levs, x), str.tostring(math.round_to_mintick(array.get(sr_levs, x))), color=lab_col , textcolor=#000000, style=lab_loc))
hlabel := enableSR ? label.new(bar_index + label_loc + math.round(math.sign(label_loc)) * 20, highestph, "High Level : " + str.tostring(highestph), color=hi_col, textcolor=#000000, style=label.style_label_down) : na
llabel := enableSR ? label.new(bar_index + label_loc + math.round(math.sign(label_loc)) * 20, lowestpl , "Low Level : " + str.tostring(lowestpl) , color=lo_col, textcolor=#000000, style=label.style_label_up ) : na

XΩ — Trade Commander (Global)1. What is XΩ — Trade Commander?
XΩ — Trade Commander (Global) is a post‑entry position management system.
It does not tell you where to enter. Instead, it helps you manage a trade after you are already in:
Dynamic Trailing Stop based on volatility (ATR)
Visual Safe Zone under price
R‑Multiple targets (1R, 2R, 3R) for profit‑taking
A live Position Dashboard with PnL and suggested actions
Exit alert when price breaks the Trailing Stop
Plus a ZERO GENESIS brand signature on the chart
Think of it as a trade commander / position guardian that enforces your risk and trailing rules.
2. Basic setup (Inputs)
In the Active Position Settings group:
Position Active?
Turn ON when you have a live position you want to manage.
Turn OFF when flat (no position), to effectively disable the management logic.
Avg Entry Price
Enter your average entry price (if you scaled in, use your weighted average).
This is the reference for all PnL and R calculations.
Initial Stop Loss
Your original invalidation price (hard stop) when you planned the trade.
Used to define:
The size of 1R (initial risk unit)
The locations of 1R, 2R, 3R targets.
Position Size (Units)
Size of your current position (number of shares/coins/contracts, etc.).
Used to convert PnL into currency value.
In the Trailing Stop Engine group:
Trailing Width (xATR)
Controls how tight/loose the trailing stop is:
Smaller value → tighter, closer to price (protects faster, more likely to get stopped out early)
Larger value → looser, farther from price (lets winners run, accepts more swing)
Source
Price source for the trailing engine:
AVA → smoothed price (reduces noise and “random” stop‑outs)
Close → closing price
High/Low → mid of high & low
In the Take Profit Targets (R-Multiples) group:
Show R-Levels
Turn ON to draw 1R, 2R, 3R reference lines on the chart.
Turn OFF if you prefer a cleaner chart.
3. How to read the indicator on the chart
Once Position Active? is ON and you’ve filled Avg Entry Price / Initial Stop Loss / Position Size, you’ll see:
3.1. Trailing Stop line (“The Shield”)
A blue/gray line below price (for long trades):
It only moves up, never down (ratchet‑style trailing).
When price rises → the trailing stop is adjusted upward.
When price falls → the trailing stop stays in place, not lowered.
Color:
Blue → price is still above the trailing stop (protected, trade is “alive”).
Gray → price is below the trailing stop (trailing has been violated).
Visually, this line is your dynamic protective shield.
3.2. Safe Zone (blue fill)
Light blue fill between price (chosen source) and the Trailing Stop line.
Represents your current buffer:
Thick Safe Zone → good distance to the stop → room for normal volatility.
Thin Safe Zone → close to stop → trade is at risk of being closed.
3.3. Entry & Hard Stop lines
Horizontal lines:
Entry Price → gray dotted line
Initial Stop Loss → solid red line
Helps you always see:
Where the trade started
Where the original invalidation was (your planned “I’m wrong here” level)
3.4. R‑Multiple Targets (1R, 2R, 3R)
When Show R-Levels is ON and Initial Stop Loss is set:
1R: dashed green line, labeled 1R
2R: dashed green line, labeled 2R
3R: dashed green line, labeled 3R (Target)
Use these for:
Planning partial take‑profits
Knowing when it’s reasonable to move your stop (e.g., to breakeven at 1R)
Evaluating your trade in terms of reward vs initial risk
3.5. “POSITION GUARDIAN” Dashboard label
Near the current price, you’ll see a label like:
Title: 🛡️ POSITION GUARDIAN
Inside:
Size: your position size and entry price
PnL: current profit/loss percentage and value (auto‑formatted, e.g. 1.23M, 45K, etc.)
R-Multiple: your current R (e.g., 0.7R, 1.5R, 3.2R)
TRAILING STOP: the current trailing stop price
ACTION: a suggested action string, for example:
🚫 TRAILING HIT -> EXIT NOW!
🚀 RUNNING PROFIT (x.xR) -> Hold or Trim
✅ IN PROFIT (x.xR) -> Move SL to BE
⚠️ DRAWDOWN -> Watch Trailing Stop
🟢 BREAKEVEN -> Holding
The text color changes (red, green, yellow, orange, etc.) to match the situation, so you can read your trade status at a glance.
4. How to use it in practice
Step 1 – Right after entering a trade
Open a position using your own entry strategy (Commander does not give entries).
On the TradingView chart:
Set Position Active? = true
Fill:
Avg Entry Price = your actual entry
Initial Stop Loss = your planned hard stop
Position Size = the size of your position
Adjust:
Trailing Width (xATR):
Lower for tight, short‑term trades (scalp/intraday).
Higher for swing/position trades to avoid premature exits.
Turn Show R-Levels ON if you trade in terms of R.
Now the script will start drawing the Trailing Stop, Safe Zone, R levels, and Dashboard.
Step 2 – While the trade is running
When price moves in your favor:
Track:
Your current R-Multiple
How much Safe Zone you have
Typical logic:
Once you reach ≥ 1R, consider moving your hard stop to breakeven (BE).
Around 2R–3R, consider:
Taking partial profits
Tightening the trailing
Letting the remainder run with the Shield.
When price pulls back:
If price breaks below the Trailing Stop:
Dashboard shows the red warning: TRAILING HIT -> EXIT NOW!
The alert (if enabled) will also fire.
→ This is your disciplined exit condition according to Commander.
When price hovers near entry:
Dashboard shows BREAKEVEN or DRAWDOWN.
You can:
Give the setup more time
Or decide to scratch the trade if it no longer fits your plan
(The key is: you’re deciding based on a clear snapshot, not pure emotion.)
5. Alerts
The script contains one key alert:
XΩ EXIT SIGNAL
Triggers when price crosses under the Trailing Stop.
Message: "Price breached Trailing Stop. Exit position immediately!"
Use this alert to automate your exit discipline: you don’t need to stare at the chart to know when your trailing stop is hit.

Sk Macd TrendSk Macd Trend + Hidden Bullish MACD Divergence (Enhanced)
Original Author: Sujeetjeet1705
Enhanced by: Community Contribution (MACD-style Hidden Bullish Signal)
A powerful and widely respected WaveTrend-based oscillator with all the original premium features intact:
• Laguerre-smoothed WaveTrend (WT1 & WT2)
• Professional 4-color momentum histogram (strong/weak bull & bear)
• Filled MACD/Signal area for instant trend bias
• Built-in regular + hidden divergences (signal & histogram)
• Smart trailing stop system with ATR-based dynamic stops
• Clean buy/sell cross signals with overbought/oversold filtering
NEW POWERFUL ADDITION:
Hidden Bullish MACD-Style Divergence Detector
(Exactly like institutional MACD hidden bullish setups)
The indicator now highlights — with a bright blue histogram bar and a blue square below the price candle — when ALL three high-probability conditions are met simultaneously:
1. WaveTrend Histogram (wt3) is below zero (still in bearish territory)
2. Histogram is rising (wt3 > wt3 ) → momentum turning up
3. Price makes a higher low (low > low ) → bullish hidden divergence
This is one of the strongest early-reversal signals in technical analysis and often marks the exact bottom before explosive bounces.
Key Features:
• Blue square appears directly on the main chart (overlay)
• Histogram turns solid blue only on valid setups (very easy to spot)
• No repainting — 100% real-time reliable
• Works perfectly on all timeframes and assets
• All original features, colors, and logic preserved
Perfect for swing traders, reversal hunters, and anyone looking to catch major turns early.
Use with confidence — this is now one of the most complete and visually intuitive WaveTrend oscillators available on TradingView.
Enjoy the edge!

XΩ — T+ Sentiment Sniper
**XΩ — T+ Sentiment Sniper**
Crowd psychology helper for timing T+ reversals and managing risk
---
### 1. What is XΩ — T+ Sentiment Sniper?
XΩ — T+ Sentiment Sniper is a **crowd sentiment companion indicator**.
It estimates whether the market as a whole is currently:
- Deep in profit (euphoria, FOMO‑prone)
- Deep in loss (panic, capitulation‑prone)
- Slightly profitable / slightly losing
From that, it marks:
- Potential **supply/demand absorption** zones at panic lows and euphoric highs
- **Sentiment divergences** between price and crowd PnL
You use it as a **psychology layer on top of your main system**, especially for timing T+ style moves (the next 1–3 swings after an emotional extreme).
You do not need to understand the internal math to use it.
---
### 2. How to read the panel
The indicator runs in a **separate pane** (not on the price chart) and shows:
1. **Crowd Sentiment (Raw) – columns**
- Green/red columns represent how “good” or “bad” the crowd’s current PnL is.
- Taller columns = more emotional / more extreme conditions.
2. **Signal Line – white line**
- A smoothed line summarising the **overall direction of sentiment**.
- Helps you see whether psychology is improving or deteriorating.
3. **Horizontal levels**
- `0 (Neutral)` → sentiment is roughly balanced.
- `Euphoria` → crowd is strongly in profit (high risk of FOMO and distribution).
- `Panic` → crowd is deeply underwater (high risk of capitulation and absorption).
4. **Dashboard label on the latest bar**
- Status: `EUPHORIA (Risk)`, `PANIC (Opp.)`, `SLIGHT PROFIT`, or `SLIGHT LOSS`.
- Current **Crowd PnL (%)**.
- A short note about volume (stable vs unusually high, with a T+2 warning when needed).
At a glance, you know:
> “Is the market currently euphoric, panicking, or somewhere in between?”
---
### 3. What the signals mean
The indicator plots shapes at the top/bottom of the pane:
- **ABS (Absorption – Buy)**
- Small green circle near the bottom.
- Suggests **demand absorption**: sentiment is bad (panic), but strong buying appears against the selling.
- Use as a **potential bottom area** to watch, not an automatic “buy now”.
- **DST (Distribution – Sell)**
- Small red circle near the top.
- Suggests **distribution**: sentiment is very positive (euphoria), but strong selling appears into that optimism.
- Use as a **potential top area** to watch for taking profits or avoiding FOMO entries.
- **DIV triangle up (Bullish Div – Buy)**
- Yellow triangle pointing up near the bottom.
- Price makes new lows while sentiment stops getting worse and starts to improve.
- Suggests selling pressure is fading; potential for an upward reversal.
- **DIV triangle down (Bearish Div – Sell)**
- Orange triangle pointing down near the top.
- Price makes new highs while sentiment stops getting better and starts to weaken.
- Suggests buying pressure is fading; potential for a downward reversal.
Think of these as **context signals / alerts**, not as “must‑take” entries on their own.
---
### 4. Suggested ways to use it
#### 4.1. As a context filter before entering trades
Use Sentiment Sniper to avoid trading directly into emotional extremes:
- Avoid opening **new longs** when:
- The indicator is in the **Euphoria** zone and you see **DST or Bearish DIV** near resistance.
- Avoid opening **new shorts** when:
- The indicator is in the **Panic** zone and you see **ABS or Bullish DIV** near support.
In other words, use it as a **“do not chase” filter** for tops and bottoms.
---
#### 4.2. To spot potential T+ reversal zones
Example workflow:
1. Use your normal tools to mark **key zones** (support/resistance, liquidity areas, higher‑timeframe levels).
2. When price reaches those zones, look at T+ Sentiment Sniper:
- Near **Panic** with **ABS or Bullish DIV** → watch for potential long opportunities.
- Near **Euphoria** with **DST or Bearish DIV** → watch for potential short/exit opportunities.
3. Only take trades when:
- You also have confirmation from your own system (reversal candle, structure break, etc.).
4. Expect a **T+ style move** (1–3 swings) away from the extreme.
---
#### 4.3. To manage open positions
- When you are **heavily in profit**:
- If Sentiment Sniper moves into **Euphoria** and starts printing **DST or Bearish DIV**, consider:
- Taking partial profits
- Tightening stops
- Reducing risk to protect gains
- When you are **stuck in drawdown**:
- If sentiment is deep in **Panic** but there is **no** ABS or Bullish DIV yet, be careful:
- Avoid catching a falling knife too early.
- Look for sentiment to stabilise (ABS/DIV + your own confirmation) before committing.
---
### 5. User‑level settings (simple view)
You typically only need to think of them like this:
- **Half-Life (Memory Decay)**
- Higher value → sentiment reacts more slowly (more “long‑term” feel).
- Lower value → sentiment reacts faster to recent moves (better for short‑term trading).
- **Euphoria / Panic Threshold (%)**
- Define what counts as an “extreme”.
- For very volatile assets (crypto, small caps), you may want slightly wider thresholds.
- For calmer markets (majors, large caps), slightly tighter thresholds may be enough.
- **Avg Volume Length**
- Period to define “normal” volume.
- Spikes above this are used to flag meaningful absorption/distribution.
- **Show Sentiment Divergence / Show Supply/Demand Absorption**
- Turn off one or both if you feel the chart is too crowded.
- Keep only the parts that match your own style.
---
### 6. Alerts
In TradingView’s **Alerts** panel you will find:
- `XΩ SNIPER BUY`
- Triggers when a **psychological Buy** signal appears (Absorption or Bullish Divergence, if enabled).
- `XΩ SNIPER SELL`
- Triggers when a **psychological Sell** signal appears (Distribution or Bearish Divergence, if enabled).
Use alerts to be notified when the crowd hits important **Panic/Euphoria zones**, without watching the screen all day.
---
### 7. Important notes
- This is a **sentiment / context tool**, not a standalone “black box” system.
- Always combine it with:
- Price structure on higher timeframes
- Your own entry/exit rules
- Proper risk management
- Backtest and forward‑test before applying it with real capital.

FVG / Imbalance MTF Pro (4 HTFs + Alerts) - (@JP7FX)FVG / Imbalance MTF Pro (@JP7FX)
This indicator finds and plots Fair Value Gaps across up to four higher timeframes on a single chart. It shows them as lines, zones, 50 percent levels and labels, and can fire alerts when new gaps form or when price mitigates them.
Core logic
The script detects bullish and bearish FVGs using the classic three candle logic:
• Bullish FVG when high is below the current low.
• Bearish FVG when low is above the current high.
All logic runs on the selected higher timeframes through request.security, then projects the zones down onto your current chart timeframe. The script also checks that your chart timeframe is equal to or lower than the selected HTFs so the plots stay meaningful.
Multi timeframe control
You can configure up to four separate FVG layers: TF1, TF2, TF3 and TF4.
For each TF you can choose:
• Timeframe (or link it to the chart).
• Display mode, Lines and Zones, Zones Only, Lines Only, or Disable.
• Whether to show the 50 percent line.
• Whether to show a label with the TF name next to each FVG.
Inputs also convert the timeframe into minutes and hours so labels can show clear tags such as “15m”, “1h” and so on.
Visuals per timeframe
For every timeframe you can set:
• Entry and stop FVG line colours.
• 50 percent line colour and line style.
• Bullish and bearish zone fill colours.
• Separate colours for mitigated bullish and mitigated bearish zones.
• Label text colours for demand and supply.
Each FVG can draw:
• Two lines for the “entry” and “stop” edges of the gap.
• An optional 50 percent line through the zone.
• A shaded box that tracks the zone as price trades into it.
• A label that shows the originating timeframe.
Line and zone behaviour
Global settings let you control:
• Maximum number of FVG lines and zones kept on the chart.
• Line style for FVG edges and 50 percent lines.
• Whether lines and zones extend to the right.
• Whether zones update with price movement as price trades deeper.
• Whether the zone colour changes once the FVG has been mitigated.
• Label offset so you can push the TF labels to the right of price.
• An option to avoid overlapping zones per timeframe by checking for box overlap.
The script uses arrays of lines, boxes and labels for each TF and for demand and supply separately. It removes the oldest objects once the max count is hit and deletes or recolours zones when price reaches them.
Bar colouring
You can optionally colour the bar that creates the chart timeframe FVG.
• Bullish FVG origin bar can show as green.
• Bearish FVG origin bar can show as red.
Alerts
The indicator exposes alertcondition signals for both creation and mitigation. For each timeframe it supports:
• FVG zone created, bullish or bearish.
• Bullish FVG mitigated.
• Bearish FVG mitigated.
You choose the alert pack per TF through the inputs, then set the alert from the chart by right clicking the indicator and adding an alert.
Use case
This tool is for traders who map and trade Fair Value Gaps across multiple higher timeframes and want clean, configurable MTF FVG zones with clear labels, mitigation behaviour and alerts all in one script.
