Multi-Timeframe QuartilesThis indicator helps you identify the position of price in comparison with distance to key reference levels on multiple timeframes. Statistically, when the price is opening in the lower quartile of a timeframe, there is a higher chance for that previous low to be taken, depending on the market structure already formed
Indicateurs et stratégies

N-Consecutive Candle Marker (SMA Filter & Consolidated Alert)Certainly, here is the English version of the Pine Script description for posting on TradingView.
---
## 📈 N-Consecutive Candle Marker (SMA Filter & Consolidated Alert)
### 📝 Overview
This indicator automatically displays a **signal mark** on the chart when a user-defined number ($N$) of **consecutive bullish or bearish candles** occurs.
It includes an optional **SMA (Simple Moving Average) filter** to restrict signals to conditions favoring a **short-term counter-trend (reversal) trade**. It also consolidates both bullish and bearish signals into a **single alert mechanism** for simplified management.
### ⚙️ Key Features
#### 1. N-Consecutive Candle Detection
* **Consecutive Count (N)**: The indicator detects continuous candles of the same color based on the `Consecutive Candle Count (N)` input setting.
* **Bullish Signal (Red Marker)**: A mark is placed above the high of the closing candle after the bullish sequence is complete.
* **Bearish Signal (Blue Marker)**: A mark is placed below the low of the closing candle after the bearish sequence is complete.
#### 2. SMA Filter (Counter-Trend Logic)
When **`Use SMA Filter`** is enabled, the signal conditions are filtered against the SMA, which focuses on potential **short-term bounces or pullbacks** against the broader trend.
* **Bullish Signal Condition**: The consecutive bullish candles must close **below** the SMA (`close < sma_value`). This typically targets a bounce in a downtrend.
* **Bearish Signal Condition**: The consecutive bearish candles must close **above** the SMA (`close > sma_value`). This typically targets a pullback/dip in an uptrend.
#### 3. Performance & Alert Consolidation
* **Display Limit**: Enabling **`Use Display Limit`** restricts the plotted marks to the **last N bars** defined by `Limit Display to Last N Bars`. This automatically deletes old labels, helping to **maintain chart performance**.
* **Consolidated Alert**: Both bullish and bearish signals trigger the same **single `alert()` function**, simplifying the process of setting up notifications in TradingView.
### 💡 How to Use
1. Add the indicator to your chart.
2. Set the **`Consecutive Candle Count (N)`** to your desired number of consecutive bars (e.g., 3, 4, etc.).
3. If you want to use the reversal filter, switch **`Use SMA Filter (On/Off)`** to **On**. Adjust the `SMA Period` as needed.
4. In the TradingView alert creation menu, select this indicator and choose **"Any function call"** or **"N-Consecutive Candle Marker (SMA Filter & Consolidated Alert)"** to set up your consolidated alert.
> ⚠️ **Disclaimer**: This indicator detects specific candle patterns. Always combine this signal with other forms of technical analysis and context for making trading decisions.
ご要望いただいたTradingViewに投稿する際のインジケーターの説明文として、機能、使い方、フィルターロジックに焦点を当てた文章を作成しました。
この説明文は、Pine Scriptの公開ライブラリの投稿テンプレートに合わせて、**概要、使い方、主要機能**を明確に伝える構造にしています。
---
## 📈 N-Consecutive Candle Marker (SMA Filter & Consolidated Alert)
### 📝 概要 (Overview)
このインジケーターは、設定した本数($N$)の**連続した陽線または陰線**が出現した際に、チャート上に**サイン(マーク)**を自動で表示します。
オプションで**SMA(単純移動平均線)フィルター**を適用することができ、トレンドの状況に応じた**短期的な逆張りサイン**に限定することが可能です。また、陽線サインと陰線サインを**一つのアラート**で統合して通知できるため、管理が容易です。
### ⚙️ 主要機能 (Key Features)
#### 1. N連続ローソク足の検出
* **連続本数の設定 (N)**: `Consecutive Candle Count (N)` の設定値に基づき、連続した同色ローソク足を検出します。
* **陽線サイン (Red Marker)**: 連続陽線が完了した足の高値の上にマークを表示します。
* **陰線サイン (Blue Marker)**: 連続陰線が完了した足の安値の下にマークを表示します。
#### 2. SMAフィルター (逆張りロジック)
`Use SMA Filter` を **オン** にすることで、サインの出現条件にトレンドフィルターを追加します。これは、トレンド方向に対する**一時的な反発・押し目**を狙う、**逆張り的なロジック**を採用しています。
* **陽線サインの出現条件**: 終値がSMAの**下**にある状態で、連続陽線が出現した場合。
* **陰線サインの出現条件**: 終値がSMAの**上**にある状態で、連続陰線が出現した場合。
#### 3. パフォーマンス最適化とアラート統合
* **表示制限**: `Use Display Limit` をオンにすると、描画されるマークの数を**直近のN本**に制限し、古いマークを自動で削除することで、チャート描画の**パフォーマンスを維持**します。
* **統合アラート**: 陽線・陰線どちらのサインが出た場合でも、**単一の `alert()` 関数**でメッセージを出し分けます。これにより、アラート設定をシンプルに保てます。
### 💡 使い方 (How to Use)
1. インジケーターをチャートに追加します。
2. **`Consecutive Candle Count (N)`** を希望する連続本数に設定します(例: 3本連続、4本連続など)。
3. トレンドフィルターを使用したい場合は、**`Use SMA Filter (On/Off)`** をオンに切り替えます。
4. TradingViewのアラート設定画面で、このインジケーターを選択し、**「どんな関数呼び出しでも」**または**「N-Consecutive Candle Marker (SMA Filter & Consolidated Alert)」**を選んでアラートを設定してください。
> ⚠️ **注意点**: このインジケーターは、連続足という特定のパターンのみを検出するものです。トレード判断を行う際は、他のテクニカル分析や環境認識と組み合わせてご利用ください。

Trend Step Channel [BigBeluga]🔵 OVERVIEW
Trend Step Channel identifies directional bias by forming a dynamic volatility-based step channel. It detects trend shifts when candle lows close above the upper band (bullish) or when candle highs drop below the lower band (bearish). A step-style midline tracks the trend evolution, while an integrated dashboard shows price positioning percentages across multiple timeframes.
🔵 CONCEPTS
ATR-Based Channel — The indicator constructs upper and lower channel boundaries using ATR distance around a single adaptive trend line, providing automatic scaling with volatility.
Trend Direction Logic —
• Low above upper band → uptrend confirmation.
• High below lower band → downtrend confirmation.
Step Trend Line — A reactive midline that locks onto price swings, stepping upward or downward as new trend confirmations occur.
Channel Width — Defines the total volatility range around the midline; a wider channel smooths market noise, while a narrower one reacts faster.
Price Position Ratio — Calculates the relative position of the close within the channel, from 0% (bottom) to 100% (top).
🔵 FEATURES
Volatility-Adaptive Channel — Expands and contracts dynamically to match market volatility, maintaining consistent distance scaling.
Configurable MA Source — Choose from SMA, EMA, SMMA, WMA, or VWMA as the base smoothing method.
Color-Coded Step Line —
• Green indicates an uptrend.
• Orange indicates a downtrend.
Channel Fill Visualization — Semi-transparent fills highlight active volatility zones for clear trend identification.
Price Position Label — Displays a “<” marker and percentage at the channel edge showing how far the current close is from the lower or upper band.
Multi-Timeframe Dashboard —
• Displays alignment across 1H–5H charts.
• Each cell shows an arrow (↑ / ↓) with price % positioning.
• Cell background color reflects bullish or bearish bias.
Real-Time Updating — The channel, midline, and dashboard refresh dynamically every bar for continuous feedback.
🔵 HOW TO USE
Trend Confirmation —
• Bullish trend forms when candle low closes above the upper band.
• Bearish trend forms when candle high closes below the lower band.
Trend Continuation — Maintain bias while the step line color remains consistent.
Volatility Breakouts — Sudden candle breaks outside the band suggest new directional strength.
Dashboard Alignment — Confirm trend consistency across multiple timeframes before entering trades.
Entry Planning — In uptrends, consider entries near the lower band; in downtrends, focus on upper-band rejections.
Price Position Insight — Use the % label to judge whether price is extended (near 100%) or compressed (near 0%) within the channel.
🔵 CONCLUSION
Trend Step Channel delivers a precise, volatility-driven view of trend structure using ATR-based boundaries and a step-line framework. The integrated dashboard, color-coded channel, and live positioning metrics give traders a complete picture of market direction, trend strength, and price location within evolving conditions.

Stage 2 Trend Signals (10/21/50/200) *Trend-following indicator designed to focus on **strong Stage 2 uptrends**, not bottom-fishing or chop.
* Plots **10 EMA, 21 EMA, 50 SMA, and 200 SMA** as core moving averages.
* Uses a **trend filter** so buy signals only occur when:
* Price is above the **50 SMA** (and optionally above the **200 SMA**), and
* The **50 SMA is above the 200 SMA**, reflecting classic Stage 2 alignment.
* Prints a **green “BUY” label** when the **10 EMA crosses above the 21 EMA** within this bullish environment, signaling momentum turning up in an established uptrend.
* Prints a **red “SELL” label** when the **10 EMA crosses below the 21 EMA** or when price is in a bearish context and closes below the 21 EMA, prompting risk reduction as trend/momentum weaken.
* Light **green background shading** highlights periods where the bullish Stage 2 conditions are active (“trend-on” zones).
* Works on **any timeframe**; commonly used on:
* **Weekly charts** for big-picture trend confirmation.
* **Daily charts** for swing entries, exits, and active trade management.

Stoch RSI Buy/Sell Signals with AlertsThis color code helps a novice know when to buy and when to sell
What Each Section Does
Header: //@version=5 tells TradingView which Pine Script version to use.
Indicator setup: indicator("Stoch RSI Buy/Sell Signals with Alerts", overlay=false) names your script and sets it to plot in a separate panel.
Inputs: Adjustable parameters for RSI length, Stoch length, and smoothing. You can tweak these in the settings panel.
Calculations: Builds RSI, then Stoch RSI, then smooths into %K and %D lines.
Signals: Defines buy (green) and sell (red) conditions based on crossovers and thresholds.
Color logic: Dynamically changes the %K line color (green/red/gray).
Plots: Draws %K (colored) and %D (blue) lines.
Background shading: Adds light green/red shading when signals fire for easy visual scanning.
Alerts: Pops up TradingView alerts when buy/sell conditions trigger, so you don’t miss them.
✅ Publishing Notes
Paste this into a new blank Pine Script editor starting at line 1.
Save and add it to your chart.
You’ll see the %K line flip colors, background shading, and alerts firing when conditions are met.

Sessions Pro+ (@JP7FX)Sessions Pro Plus (JP7FX)
Sessions Pro Plus marks key trading sessions and gives real time session information. It helps traders track session behaviour without manual work.
Session Info Panel
Shows live updates for Tokyo, Frankfurt, London and New York.
Displays if session highs or lows are intact or taken.
Includes a countdown to the next session start.
Range High and Low Alerts
Alerts trigger when a session high or low is breached.
Useful for monitoring breaks, sweeps and changes in behaviour.
Daily Open Bias
Shows whether price is above or below the daily open.
Helps traders understand directional conditions quickly.
Custom Session Settings
Session times can be adjusted to fit personal trading hours.
Sessions can be renamed and recoloured for clarity.
Webhook and Real Time Alerts
Alerts support webhook integrations for external platforms, including Discord.
Countdown Timers
Displays countdowns to the next session open to help plan ahead.
This indicator is designed for traders who follow session timing, session highs and lows, and daily open behaviour. It aims to simplify chart preparation and reduce the need to track session information manually.

Buy & Sell Arrows - MACD + Best_Solve WPRMACD + Best_Solve Williams %R – Aggressive Trend-Reversal Catcher
(Allow Signals Even in Overbought/Oversold Zones)
This indicator combines the classic MACD histogram with Best_Solve’s popular custom Williams %R (a 0–100 momentum oscillator that behaves more like a fast Stochastic) to deliver clean, high-conviction entry signals on daily (and higher) timeframes.
Core Logic – Only TWO conditions are required
BUY (large green arrow below bar)
MACD histogram is green (bullish momentum)
Williams %R fast line is crossing above OR already above its EMA
SELL (large red arrow above bar)
MACD histogram is red (bearish momentum)
Williams %R fast line is crossing below OR already below its EMA
Unlike most oscillators, this version deliberately removes the traditional “do not buy when overbought / do not sell when oversold” filters. This allows the script to catch powerful trend reversals and explosive moves immediately — even on violent earnings gaps or panic sell-offs (example: META’s -11 % drop on Oct 30 2025 triggered an instant sell even though %R was deeply oversold).
Built-in Clean-Signal Logic
No consecutive buys or sells — each new signal must be preceded by the opposite direction.
This keeps the chart extremely clean and prevents whipsaw clusters during strong trends.
Best Use Cases
Daily and 4H swing trading on stocks, indices, crypto, forex
Excellent for catching sharp reversals after earnings, news events, or overextended moves
Works especially well on high-beta names and growth stocks
Visuals
Large green/red arrows with “BUY” / “SELL” text (your favorite style)
Subtle transparent MACD histogram overlaid on price for instant momentum context
Ready-to-use alerts (“Buy Alert” / “Sell Alert”)
Set it, alert it, trade it — one of the cleanest and most responsive daily reversal systems you’ll find.
Enjoy the edge!

WPS ALL IN ONE WPS ALL IN ONE is a technical analysis tool designed to assist traders by highlighting potential market entries based on price behavior.
The script plots suggested entry points, along with stop-loss and target levels, allowing users to view structured trade setups directly on the chart.
The indicator works across all timeframes and supports multiple instruments, making it suitable for various trading styles.
It is intended to help traders maintain a consistent risk-management approach by keeping all important levels visible.
How to Use
Apply the indicator to your chart.
Observe the suggested entry, stop-loss, and target levels.
Use these levels as part of your own analysis and only take trades that match your personal risk-reward preferences.
This tool is meant for chart analysis and educational assistance only.
It does not guarantee performance or outcomes.

GEOtheGEMIt looks for when the fast EMA crosses above the slow one, and the trend is up. If RSI is above fifty—and volume jumps—it draws a green arrow and tells you buy. It trails the stop so you don't get shaken out. And if price drops below the two-hundred, it won't short you in a rally. That's it. Nothing fancy. Just: is it going up? Yes? Get in. No? Stay out.

Bayesian Liquidity Pain & Gain [Instit. Vol Weighted]Bayesian Liquidity Pain & Gain Indicator
Stop guessing where support and resistance are.
The Bayesian Liquidity Pain & Gain indicator moves beyond arbitrary lines and raw price action. It quantifies Institutional Intent by calculating the exact price levels where large volume has been accumulated and visualizes the "Pain" (stress) those participants feel when the market moves against them.
The Logic: Quantified Institutional Stress
Institutions don't trade single candles; they accumulate positions over time. This indicator tracks their Volume-Weighted Average Cost Basis to answer two critical questions:
Where did they enter? (The Cost Basis Lines)
Are they underwater? (The Pain Clouds)
By normalizing price distance using volatility (ATR) and statistical deviation (Z-Score), we filter out noise and only highlight zones where "Smart Money" is statistically forced to defend their positions or capitulate.
How to Read the Chart
1. The Cost Basis Lines (Anchors)
• 🟢 Green Line (Buyer Cost Basis): The average price where institutions accumulated long positions. This acts as dynamic Support.
• 🔴 Red Line (Seller Cost Basis): The average price where institutions accumulated short positions. This acts as dynamic Resistance.
2. The Pain Clouds (Signals)
When price moves significantly away from the cost basis (Z-Score > 2.0), "Clouds" appear to visualize the PnL status of the participants:
• 🔴 Red Cloud (Buyer Pain): Price is below the buyer's entry. Buyers are losing money (in the red). This creates a "Discount" zone where they may defend support.
• 🟢 Green Cloud (Seller Pain): Price is above the seller's entry. Sellers are losing money (shorts are squeezed). This indicates strong bullish momentum.
3. The Multi-Timeframe Dashboard
A real-time HUD showing the Z-Score status across 4 timeframes (1m, 5m, 15m, 1h):
• 🟢 Green: Profitable/Neutral (Trend Continuation)
• 🟠 Orange: Warning (Pressure Building)
• 🔴 Red: Critical Pain (High Probability Reversal)
Trading Strategies
Setup 1: The Defensive Bounce (Long)
• Context: Price drops into a 🔴 Red Cloud (Buyer Pain).
• Trigger: Price touches the 🟢 Green Line (Buyer Cost Basis) and shows a rejection wick.
• Logic: Institutional buyers defend their cost basis to avoid realizing losses.
Setup 2: The Short Squeeze (Momentum)
• Context: Price rallies into a 🟢 Green Cloud (Seller Pain).
• Trigger: Price holds above the 🔴 Red Line (Seller Cost Basis).
• Logic: Short sellers are trapped and forced to buy back (cover), fueling the rally.
Fractal Alignment:
For high-conviction trades, wait for the Dashboard to show "Pain" signals on both the 1h (Anchor) and 5m (Trigger) timeframes simultaneously.
Settings
• Memory Length (Default 144): The lookback period for the institutional cost basis. Increase for swing trading, decrease for scalping.
• Sigma Threshold (Default 2.0): The statistical confidence level for "Pain". Higher values = fewer, stronger signals.
• Volume Amp: When enabled, high volume amplifies the pain signal, giving more weight to institutional footprints.

MAMA - FAMA (Ehlers) [KN]MAMA - FAMA (Ehlers)
Surprisingly, I couldn't find a proper Pine Script implementation of this classic indicator on TradingView, so here's my version.
This indicator implements John Ehlers' MESA Adaptive Moving Average (MAMA) and Following Adaptive Moving Average (FAMA) from his book "Rocket Science for Traders."
How It Works
Unlike traditional moving averages with fixed periods, MAMA adapts its smoothing based on the market's dominant cycle. It uses the Hilbert Transform to measure the instantaneous phase of price, then adjusts its responsiveness according to how fast that phase is changing.
When price is trending strongly (rapid phase change), MAMA speeds up to follow closely. During consolidation (slow phase change), it slows down to filter noise. FAMA is a further smoothed version of MAMA that serves as a signal line.
Signals
🔵 Bullish : MAMA crosses above FAMA
🟠 Bearish : MAMA crosses below FAMA
The adaptive nature makes this particularly effective at avoiding whipsaws during ranging markets while still catching trends early.
Inputs
- Fast Limit (default 0.5): Maximum alpha, controls fastest response
- Slow Limit (default 0.05): Minimum alpha, controls slowest response
- Source (default hl2): Price input
Credits
Original concept by John F. Ehlers.

Auto Reaction Zones (XAUUSD)
✅ Auto Reaction Zones (XAUUSD) OANDA:XAUUSD
Auto Reaction Zones (XAUUSD) is an advanced supply & demand mapping tool designed to detect high-probability reaction zones using price impulses, volatility filters, market structure, and adaptive confirmation logic.
This indicator automatically identifies strong bullish and bearish reaction bases formed before impulsive movements, then plots dynamic demand and supply zones that help traders anticipate future reactions, reversals, or continuation points.
🔍 Core Features
▪ Automatic Supply & Demand Zone Detection
Identifies zones based on structural breakout impulses using ATR-based thresholds, volume confirmation, and validated base levels.
▪ Adaptive Confirmation Distance (ADR-Based)
The zone becomes active/confirmed only after price moves a configurable number of points.
A unique 3-case ADR logic adjusts the required confirmation distance based on current market volatility:
Case 1: Low ADR → smaller confirmation required
Case 2: Moderate ADR → medium confirmation
Case 3: High ADR → higher confirmation (more filtering)
This ensures stronger zones in high-volatility conditions (e.g., XAUUSD).
▪ Smart Zone Management
Automatic extension until tested or consumed
Optional lifetime limits (bars or days)
Auto-delete unconfirmed zones if price violates them too early
Hide tested or consumed zones for a cleaner chart
▪ Adjustable Zone Size Filtering
Option to enforce a minimum or maximum zone size, useful for cleaning noise and ultra-small reaction levels.
▪ ADR-Based Zone Spacing Filter
Prevents the creation of zones that are too close to each other.
Different spacing rules for same-direction and opposite-direction zones.
▪ Multi-Timeframe Mode
Overlay zones detected from higher timeframes directly onto your current chart.
▪ Directional Bias (EMA Filter)
Optionally restrict long/short zones based on EMA trend alignment.
▪ Real-Time Alerts
Receive alerts when price touches any active zone or only fresh zones.
🎯 Why This Indicator Is Different
Unlike typical supply/demand indicators that print every swing,
Auto Reaction Zones focuses on:
Only strong reaction bases
Only valid impulse-generated levels
Only zones confirmed by price movement
Only zones that respect volatility and minimum spacing rules
This results in cleaner charting, fewer false zones, and far more reliable reaction levels, especially on volatile instruments like XAUUSD.
⚠️ Disclaimer
This tool is not financial advice. Always combine zone analysis with broader market context and risk management.

Multi-Pivot Plotter//================================================================================
//📌 Manual Pivot Plotter (4 Sets: P, R1–R3, S1–S3)
// - Up to 4 indices
// - Each index: Name + P/S/R values
// - One shared Style block: colors, visibility, line width (applies to all indices)
// - Lines start at 00:00 UTC+8 and extend a few bars
// - Labels at line end or start, with optional "Index Name" and price value
//================================================================================

Candle Length by RaviThis is a private, invite-only script designed to measure and analyze candle length behavior in real-time.
It detects significant deviations in candle size, allowing traders to identify:
High volatility zones
Breakout and breakdown conditions
Momentum continuation or exhaustion
Potential reversal signals
Ideal for scalpers, intraday traders, and momentum-based systems.

NEXFEL – Quantum Adaptive MACD System v2.0# NEXFEL – Quantum Adaptive MACD System v2.0
## 📌 Overview
The **NEXFEL – Quantum Adaptive MACD System v2.0** is an advanced, fully integrated decision-support tool built upon an enhanced adaptive MACD engine.
Unlike traditional MACD implementations that rely on fixed parameters, this system uses **R² correlation** to dynamically adjust sensitivity based on current market behavior.
This indicator **does not simply merge tools**; it unifies:
- Adaptive MACD calculation
- Multi-timeframe sentiment (1H + 4H)
- Market regime detection
- Volume confirmation
- Confidence scoring (0–100%)
- ATR stop-loss visualization
- Session filtering
- Daily trade limit control
into a **single coherent trading framework**.
This publication replaces my previous “Adaptive MACD Flow PRO”, as this version is a complete rewrite with new logic, improved structure, and expanded analytical capabilities.
---
## ⚙️ How It Works
### **1. Adaptive MACD Core (R²-Based)**
The MACD sensitivity is adjusted using R² correlation:
- High R² → smoother & more stable response
- Low R² → more reactive & faster response
This adaptation allows the oscillator to naturally adjust to different volatility environments.
---
### **2. Multi-Timeframe Sentiment**
The system analyzes:
- **1H EMAs (10/30)**
- **4H EMAs (20/50)**
A directional sentiment score is generated, allowing signals only when the local timeframe aligns with the higher timeframe structure.
---
### **3. Market Regime Detection**
The indicator identifies whether the market is:
- **TRENDING**
- **RANGING**
- **NEUTRAL**
Signals are validated or filtered depending on the active regime.
---
### **4. Confidence Scoring System (0–100%)**
The signal quality is measured by weighting:
- Momentum
- Volume confirmation
- Market regime compatibility
- Multi-timeframe alignment
- Local trend direction
- Short-term momentum
Only **high-confidence** conditions produce the safest BUY/SELL signals.
---
### **5. ATR Stop-Loss Visualization**
Dynamic stop levels are displayed using:
- ATR × multiplier
A visual reference for risk management without executing trades.
---
### **6. Daily Trade Limit Control**
To prevent overtrading, the system tracks daily signals and restricts new ones once a limit is reached.
---
### **7. Multi-Language Interface**
The panel can display:
- **English**
- **Portuguese**
depending on user selection.
(TradingView requires English as the primary language, which is why it appears first in this description.)
---
## 👤 Who This Script Is For
- Traders seeking a more reliable and adaptive MACD
- Scalpers who prefer high-confirmation entries
- Swing traders analyzing market regimes
- Users needing a clean, objective analytical panel
---
## ⚠️ Important
This indicator does **not** execute trades and does not guarantee results.
It is a **decision-support system**, not a trading bot.
# 📝 Author’s Notes
This version is a complete redesign of my previous indicator.
All components were rebuilt, expanded, and optimized to offer a more structured and reliable trading system.


VWAP + EMA9/21/50 + Ichimoku + RSI (M5) - Strict + TPSL//@version=5
indicator("VWAP + EMA9/21/50 + Ichimoku + RSI (M5) - Strict + TPSL", overlay=true, shorttitle="VWAP_EMA_ICH_RSI_TPSL")
// === Inputs ===
emaFastLen = input.int(9, "EMA Fast (9)")
emaMidLen = input.int(21, "EMA Mid (21)")
emaSlowLen = input.int(50, "EMA Slow (50)")
// Ichimoku inputs
tenkanLen = input.int(9, "Tenkan Sen Length")
kijunLen = input.int(26, "Kijun Sen Length")
senkouBLen = input.int(52, "Senkou B Length")
displacement = input.int(26, "Displacement")
// RSI
rsiLen = input.int(14, "RSI Length")
rsiThreshold = input.int(50, "RSI Threshold")
// VWAP option
useSessionVWAP = input.bool(true, "Use Session VWAP (true) / Daily VWAP (false)")
// Volume filter
useVolumeFilter = input.bool(true, "Enable Volume Filter")
volAvgLen = input.int(20, "Volume Avg Length")
volMultiplier = input.float(1.2, "Min Volume > avg *", step=0.1)
// Higher timeframe trend check
useHTF = input.bool(true, "Enable Higher-Timeframe Trend Check")
htfTF = input.string("60", "HTF timeframe (e.g. 60, 240, D)")
// Alerts / webhook
alertOn = input.bool(true, "Enable Alerts")
useWebhook = input.bool(true, "Send webhook on alerts")
webhookURL = input.string("", "Webhook URL (leave blank to set in alert)")
// TP/SL & Trailing inputs
useTP = input.bool(true, "Enable Take Profit (TP)")
tpTypeRR = input.bool(true, "TP as Risk-Reward ratio (true) / Fixed points (false)")
tpRR = input.float(1.5, "TP RR (e.g. 1.5)", step=0.1)
fixedTPpts = input.float(40.0, "Fixed TP (ticks/pips) if not RR")
useSL = input.bool(true, "Enable Stop Loss (SL)")
slTypeATR = input.bool(true, "SL as ATR-based (true) / Fixed points (false)")
atrLen = input.int(14, "ATR Length")
atrMult = input.float(1.5, "ATR Multiplier for SL", step=0.1)
fixedSLpts = input.float(20.0, "Fixed SL (ticks/pips) if not ATR")
useTrailing = input.bool(true, "Enable Trailing Stop")
trailType = input.string("ATR", "Trailing type: ATR or EMA", options= ) // "ATR" or "EMA"
trailATRmult = input.float(1.0, "Trailing ATR Multiplier", step=0.1)
trailEMAlen = input.int(9, "Trailing EMA Length (if EMA chosen)")
trailLockInPts = input.float(5.0, "Trail lock-in (min profit before trail active, pts)")
// Other
showArrows = input.bool(true, "Show Entry Arrows")
// === Calculations ===
ema9 = ta.ema(close, emaFastLen)
ema21 = ta.ema(close, emaMidLen)
ema50 = ta.ema(close, emaSlowLen)
// VWAP
vwapVal = ta.vwap
// Ichimoku
highestHighTenkan = ta.highest(high, tenkanLen)
lowestLowTenkan = ta.lowest(low, tenkanLen)
tenkan = (highestHighTenkan + lowestLowTenkan) / 2
highestHighKijun = ta.highest(high, kijunLen)
lowestLowKijun = ta.lowest(low, kijunLen)
kijun = (highestHighKijun + lowestLowKijun) / 2
highestHighSenkouB = ta.highest(high, senkouBLen)
lowestLowSenkouB = ta.lowest(low, senkouBLen)
senkouB = (highestHighSenkouB + lowestLowSenkouB) / 2
senkouA = (tenkan + kijun) / 2
// RSI
rsi = ta.rsi(close, rsiLen)
// Volume
volAvg = ta.sma(volume, volAvgLen)
volOk = not useVolumeFilter or (volume > volAvg * volMultiplier)
// Higher timeframe trend values
htf_close = request.security(syminfo.tickerid, htfTF, close)
htf_ema50 = request.security(syminfo.tickerid, htfTF, ta.ema(close, emaSlowLen))
htf_rsi = request.security(syminfo.tickerid, htfTF, ta.rsi(close, rsiLen))
htf_bull = htf_close > htf_ema50
htf_bear = htf_close < htf_ema50
htf_ok = not useHTF or (htf_bull and close > ema50) or (htf_bear and close < ema50)
// Trend filters (on current timeframe)
priceAboveVWAP = close > vwapVal
priceAboveEMA50 = close > ema50
priceAboveCloud = close > senkouA and close > senkouB
bullTrend = priceAboveVWAP and priceAboveEMA50 and priceAboveCloud
bearTrend = not priceAboveVWAP and not priceAboveEMA50 and not priceAboveCloud
// Pullback detection (price near EMA21 within tolerance)
tolPerc = input.float(0.35, "Pullback tolerance (%)", step=0.05) / 100.0
nearEMA21 = math.abs(close - ema21) <= ema21 * tolPerc
// Entry conditions
emaCrossUp = ta.crossover(ema9, ema21)
emaCrossDown = ta.crossunder(ema9, ema21)
longConditionBasic = bullTrend and (nearEMA21 or close >= vwapVal) and emaCrossUp and rsi > rsiThreshold
shortConditionBasic = bearTrend and (nearEMA21 or close <= vwapVal) and emaCrossDown and rsi < rsiThreshold
longCondition = longConditionBasic and volOk and htf_ok and (not useHTF or htf_bull) and (rsi > rsiThreshold)
shortCondition = shortConditionBasic and volOk and htf_ok and (not useHTF or htf_bear) and (rsi < rsiThreshold)
// More strict: require Tenkan > Kijun for bull and Tenkan < Kijun for bear
ichimokuAlign = (tenkan > kijun) ? 1 : (tenkan < kijun ? -1 : 0)
longCondition := longCondition and (ichimokuAlign == 1)
shortCondition := shortCondition and (ichimokuAlign == -1)
// ATR for SL / trailing
atr = ta.atr(atrLen)
// --- Trade management state variables ---
var float activeLongEntry = na
var float activeShortEntry = na
var float activeLongSL = na
var float activeShortSL = na
var float activeLongTP = na
var float activeShortTP = na
var float activeLongTrail = na
var float activeShortTrail = na
// Function to convert fixed points to price (assumes chart in points as price units)
fixedToPriceLong(p) => p
fixedToPriceShort(p) => p
// On signal, set entry, SL and TP
if longCondition
activeLongEntry := close
// SL
if useSL
if slTypeATR
activeLongSL := close - atr * atrMult
else
activeLongSL := close - fixedToPriceLong(fixedSLpts)
else
activeLongSL := na
// TP
if useTP
if tpTypeRR and useSL and not na(activeLongSL)
risk = activeLongEntry - activeLongSL
activeLongTP := activeLongEntry + risk * tpRR
else
activeLongTP := activeLongEntry + fixedToPriceLong(fixedTPpts)
else
activeLongTP := na
// reset short
activeShortEntry := na
activeShortSL := na
activeShortTP := na
// init trailing
activeLongTrail := activeLongSL
if shortCondition
activeShortEntry := close
if useSL
if slTypeATR
activeShortSL := close + atr * atrMult
else
activeShortSL := close + fixedToPriceShort(fixedSLpts)
else
activeShortSL := na
if useTP
if tpTypeRR and useSL and not na(activeShortSL)
riskS = activeShortSL - activeShortEntry
activeShortTP := activeShortEntry - riskS * tpRR
else
activeShortTP := activeShortEntry - fixedToPriceShort(fixedTPpts)
else
activeShortTP := na
// reset long
activeLongEntry := na
activeLongSL := na
activeLongTP := na
// init trailing
activeShortTrail := activeShortSL
// Trailing logic (update only when in profit beyond 'lock-in')
if not na(activeLongEntry) and useTrailing
// current unrealized profit in points
currProfitPts = close - activeLongEntry
if currProfitPts >= trailLockInPts
// declare candidate before use to avoid undeclared identifier errors
float candidate = na
if trailType == "ATR"
candidate := close - atr * trailATRmult
else
candidate := close - ta.ema(close, trailEMAlen)
// move trail stop up but never below initial SL
activeLongTrail := math.max(nz(activeLongTrail, activeLongSL), candidate)
// ensure trail never goes below initial SL if SL exists
if useSL and not na(activeLongSL)
activeLongTrail := math.max(activeLongTrail, activeLongSL)
// update SL to trailing
activeLongSL := activeLongTrail
if not na(activeShortEntry) and useTrailing
currProfitPtsS = activeShortEntry - close
if currProfitPtsS >= trailLockInPts
// declare candidateS before use
float candidateS = na
if trailType == "ATR"
candidateS := close + atr * trailATRmult
else
candidateS := close + ta.ema(close, trailEMAlen)
activeShortTrail := math.min(nz(activeShortTrail, activeShortSL), candidateS)
if useSL and not na(activeShortSL)
activeShortTrail := math.min(activeShortTrail, activeShortSL)
activeShortSL := activeShortTrail
// Detect TP/SL hits (for plotting & alerts)
longTPHit = not na(activeLongTP) and close >= activeLongTP
longSLHit = not na(activeLongSL) and close <= activeLongSL
shortTPHit = not na(activeShortTP) and close <= activeShortTP
shortSLHit = not na(activeShortSL) and close >= activeShortSL
if longTPHit or longSLHit
// reset long state after hit
activeLongEntry := na
activeLongSL := na
activeLongTP := na
activeLongTrail := na
if shortTPHit or shortSLHit
activeShortEntry := na
activeShortSL := na
activeShortTP := na
activeShortTrail := na
// Plot EMAs
p_ema9 = plot(ema9, title="EMA9", linewidth=1)
plot(ema21, title="EMA21", linewidth=1)
plot(ema50, title="EMA50", linewidth=2)
// Plot VWAP
plot(vwapVal, title="VWAP", linewidth=2, style=plot.style_line)
// Plot Ichimoku lines (Tenkan & Kijun)
plot(tenkan, title="Tenkan", linewidth=1)
plot(kijun, title="Kijun", linewidth=1)
// Plot cloud (senkouA & senkouB shifted forward)
plot(senkouA, title="Senkou A", offset=displacement, transp=60)
plot(senkouB, title="Senkou B", offset=displacement, transp=60)
fill(plot(senkouA, offset=displacement), plot(senkouB, offset=displacement), color = senkouA > senkouB ? color.new(color.green, 80) : color.new(color.red, 80))
// Plot active trade lines
plotshape(not na(activeLongEntry), title="Active Long", location=location.belowbar, color=color.new(color.green, 0), style=shape.circle, size=size.tiny)
plotshape(not na(activeShortEntry), title="Active Short", location=location.abovebar, color=color.new(color.red, 0), style=shape.circle, size=size.tiny)
plot(activeLongSL, title="Long SL", color=color.red, linewidth=2)
plot(activeLongTP, title="Long TP", color=color.green, linewidth=2)
plot(activeShortSL, title="Short SL", color=color.red, linewidth=2)
plot(activeShortTP, title="Short TP", color=color.green, linewidth=2)
// Arrows / labels
if showArrows
if longCondition
label.new(bar_index, low, "BUY", style=label.style_label_up, color=color.green, textcolor=color.white, size=size.small)
if shortCondition
label.new(bar_index, high, "SELL", style=label.style_label_down, color=color.red, textcolor=color.white, size=size.small)
// Alerts
// alertcondition must be declared in global scope so TradingView can create alerts from them
alertcondition(longCondition, "VWAP+EMA+Ichimoku+RSI — BUY (STRICT)", "BUY signal from VWAP+EMA+Ichimoku+RSI (STRICT)")
alertcondition(shortCondition, "VWAP+EMA+Ichimoku+RSI — SELL (STRICT)", "SELL signal from VWAP+EMA+Ichimoku+RSI (STRICT)")
// Runtime alerts (still use alert() to trigger immediate alerts; webhook is added in TradingView Alert dialog)
if alertOn
if longCondition
alert("VWAP+EMA+Ichimoku+RSI — BUY (STRICT)", alert.freq_once_per_bar_close)
if shortCondition
alert("VWAP+EMA+Ichimoku+RSI — SELL (STRICT)", alert.freq_once_per_bar_close)
// Alerts for TP/SL hits
if longTPHit
alert("LONG TP HIT", alert.freq_once_per_bar_close)
if longSLHit
alert("LONG SL HIT", alert.freq_once_per_bar_close)
if shortTPHit
alert("SHORT TP HIT", alert.freq_once_per_bar_close)
if shortSLHit
alert("SHORT SL HIT", alert.freq_once_per_bar_close)
// Info table
var table info = table.new(position.top_right, 1, 8)
if barstate.islast
table.cell(info, 0, 0, text = 'Trend: ' + (bullTrend ? 'Bull' : bearTrend ? 'Bear' : 'Neutral'))
table.cell(info, 0, 1, text = 'EMA9/21/50: ' + str.tostring(ema9, format.mintick) + ' / ' + str.tostring(ema21, format.mintick) + ' / ' + str.tostring(ema50, format.mintick))
table.cell(info, 0, 2, text = 'VWAP: ' + str.tostring(vwapVal, format.mintick))
table.cell(info, 0, 3, text = 'RSI: ' + str.tostring(rsi, format.mintick))
table.cell(info, 0, 4, text = 'Vol OK: ' + (volOk ? 'Yes' : 'No'))
table.cell(info, 0, 5, text = 'HTF: ' + htfTF + ' ' + (htf_bull ? 'Bull' : htf_bear ? 'Bear' : 'Neutral'))
table.cell(info, 0, 6, text = 'ActiveLong: ' + (not na(activeLongEntry) ? 'Yes' : 'No'))
table.cell(info, 0, 7, text = 'ActiveShort: ' + (not na(activeShortEntry) ? 'Yes' : 'No'))
// End of script

RRG Style RS & Momentum (vs Benchmark) by AKM
## What this indicator does
This indicator is an **RRG‑style Relative Strength & Momentum tool**.
It compares the current symbol to a chosen benchmark (e.g. NIFTY / NIFTY 500) and plots:
- **RS‑Ratio**: Out/under‑performance of the symbol vs the benchmark, normalized around 100.
- **RS‑Momentum**: Momentum of that relative strength, also normalized around 100.
- **RS‑Signal**: A smoothed signal line of RS‑Ratio (EMA of RS‑Ratio).
Using these two axes (RS‑Ratio and RS‑Momentum), each bar is classified into one of four **RRG‑style quadrants**:
- **LEADING** – RS‑Ratio > 100 and RS‑Momentum > 100
- **WEAKENING** – RS‑Ratio > 100 and RS‑Momentum < 100
- **LAGGING** – RS‑Ratio < 100 and RS‑Momentum < 100
- **IMPROVING** – RS‑Ratio < 100 and RS‑Momentum > 100
The chart background is color‑coded by quadrant, and a label on the center (100) line shows the current zone name (LEADING / WEAKENING / LAGGING / IMPROVING) in real time.
> **Concept credit:**
> The conceptual framework of “Relative Strength vs Momentum” in four quadrants (Leading, Weakening, Lagging, Improving) is inspired by **Relative Rotation Graphs® (RRG®)**, created by **Julius de Kempenaer** and commercialized through RRG Research and platforms like Bloomberg, StockCharts, Optuma, etc.
> This script is only an RRG‑inspired *1‑symbol vs benchmark* implementation inside Pine, not an official RRG product.
***
## Inputs
- **Benchmark symbol**:
Default `NSE:NIFTY`. You can set `NSE:NIFTY500`, `NSE:BANKNIFTY`, sector indices, etc.
- **RS base length (`rsLen`)**:
EMA length for smoothing the raw price ratio (symbol / benchmark). Lower = more sensitive, higher = smoother.
- **Smoothing length (`smoothLen`)**:
Secondary smoothing for RS‑Ratio. Default 14.
- **Signal length (`signalLen`)**:
EMA length for the RS‑Signal line (EMA of RS‑Ratio).
- **Momentum length (`momLen`)**:
Lookback for optional ROC‑based momentum.
- **Use ROC‑based momentum**:
If `false` (default): RS‑Momentum is computed as RS‑Ratio / EMA(RS‑Ratio) × 100 (ratio‑style).
If `true`: RS‑Momentum uses ROC(RS‑Ratio, momLen) + 100 (ROC‑style).
- **Show quadrant background**:
Toggles colored background by quadrant.
- **Show zone name on background**:
Shows a label on the 100‑line with the current quadrant name.
***
## How to read it
There is a horizontal center line at **100**:
- **RS‑Ratio > 100** → symbol is outperforming the benchmark.
- **RS‑Ratio < 100** → symbol is underperforming the benchmark.
- **RS‑Momentum > 100** → relative strength is improving (momentum picking up).
- **RS‑Momentum < 100** → relative strength is fading.
The four zones behave similar to classic RRG quadrants:
- **LEADING (lime/green background)**
- RS‑Ratio > 100 and RS‑Momentum > 100.
- Symbol is **stronger than the benchmark and momentum is strong**.
- This is where leadership typically resides.
- **WEAKENING (orange background)**
- RS‑Ratio > 100 and RS‑Momentum < 100.
- Still outperforming, but momentum is rolling over.
- Late‑stage leadership / time to be more selective and manage exits.
- **LAGGING (red background)**
- RS‑Ratio < 100 and RS‑Momentum < 100.
- Underperforming with weak momentum.
- Worst zone for aggressive longs.
- **IMPROVING (green background)**
- RS‑Ratio < 100 and RS‑Momentum > 100.
- Still weaker than benchmark, but momentum is improving.
- Early turnaround zone where future leaders often start.
The **white RS‑Signal line** is just a smoother of RS‑Ratio, helpful to visually see RS trend and crossovers.
***
## Practical trading use (RRG‑style workflow)
This indicator is designed as a **selection and context filter**, not a stand‑alone entry/exit system.
### 1. Sector and stock selection
1. Apply it to **sector indices** vs a broad benchmark (e.g., Nifty IT vs NIFTY 500, Nifty Auto vs NIFTY 500).
2. Focus on sectors where:
- The zone label is **IMPROVING → LEADING** over recent bars.
- RS‑Ratio is rising and staying above 100 in LEADING.
3. Then, on individual stocks inside those strong sectors, use the same benchmark and indicator:
- Prefer stocks that are also in **LEADING** (or just moved from **IMPROVING** into **LEADING**).
This recreates the essence of using RRG to find sectors/stocks with strong relative strength and momentum.
### 2. Combining with your price setup
Once a stock/sector passes the RS filter:
- Use your own price‑action / indicator rules for entries (EMA trends, VWAP pullbacks, breakouts, etc.).
- Example for longs:
- Only take long setups when:
- Sector index AND stock are in **LEADING** or newly from **IMPROVING → LEADING**, and
- Price is in an uptrend on your main chart (e.g., above 20/50 EMA, higher highs and higher lows).
### 3. Managing exits and rotation
- When a held symbol shifts from **LEADING → WEAKENING → LAGGING** and RS‑Momentum stays < 100, consider:
- Tightening stops.
- Partially booking profits.
- Rotating into other names still in LEADING / IMPROVING.
This mirrors how many investors use “sector rotation” and RRG to stay in stronger groups and reduce exposure in weakening ones.
***
## Disclaimers
- This script is for **educational and analytical purposes only** and is **not financial advice or a recommendation** to buy/sell any security.
- **Relative Rotation Graphs® / RRG®** and the four‑quadrant concept belong to **Julius de Kempenaer and RRG Research**; this Pine implementation is an independent, simplified adaptation for one symbol vs a benchmark and is **not an official RRG product or library**.

MC² Daily Candidates (v1.0 SAFE)// This Pine Script® code is subject to the terms of the Mozilla Public License 2.0 at mozilla.org
// © mason_fibkins
//@version=5
indicator("MC² Daily Candidates (v1.0 SAFE)", overlay=true)
// ──────────────────────────────────────────
// INTERNAL DAILY DATA (NO TIMEFRAME ARGUMENT)
// ──────────────────────────────────────────
getDaily(_src) =>
request.security(syminfo.tickerid, "D", _src)
// Daily values
d_close = getDaily(close)
d_open = getDaily(open)
d_high = getDaily(high)
d_low = getDaily(low)
d_vol = getDaily(volume)
// ──────────────────────────────────────────
// Parameters
// ──────────────────────────────────────────
lookbackVol = input.int(10, "Vol Lookback (days)")
atrLength = input.int(14, "ATR Length")
emaLen = input.int(20, "EMA Length")
smaLen = input.int(50, "SMA Length")
// ──────────────────────────────────────────
// Core Calculations (DAILY)
// ──────────────────────────────────────────
// Relative Volume
relVol = d_vol / request.security(syminfo.tickerid, "D", ta.sma(volume, lookbackVol))
// Momentum — last 2 daily bullish candles
twoGreen = (d_close > d_open) and (request.security(syminfo.tickerid, "D", close ) > request.security(syminfo.tickerid, "D", open ))
// Trend filters
emaTrend = d_close > request.security(syminfo.tickerid, "D", ta.ema(close, emaLen))
smaTrend = d_close > request.security(syminfo.tickerid, "D", ta.sma(close, smaLen))
// ATR Expansion
d_atr = request.security(syminfo.tickerid, "D", ta.atr(atrLength))
atrExpand = d_atr > request.security(syminfo.tickerid, "D", ta.atr(atrLength))
// Strong Close
dayRange = d_high - d_low
closePos = dayRange > 0 ? (d_close - d_low) / dayRange : 0.5
strongClose = closePos > 0.70
// MASTER CONDITION
candidate = relVol > 2.0 and twoGreen and emaTrend and smaTrend and atrExpand and strongClose
// ──────────────────────────────────────────
// PLOT — GREEN CIRCLE BELOW DAILY BARS
// ──────────────────────────────────────────
plotshape(candidate, title="Daily Candidate", style=shape.circle, size=size.large, color=color.new(color.green, 0), location=location.belowbar, text="MC²")
// ──────────────────────────────────────────
// END
// ──────────────────────────────────────────
plot(candidate ? 1 : 0, title="MC2_Signal", display=display.none)

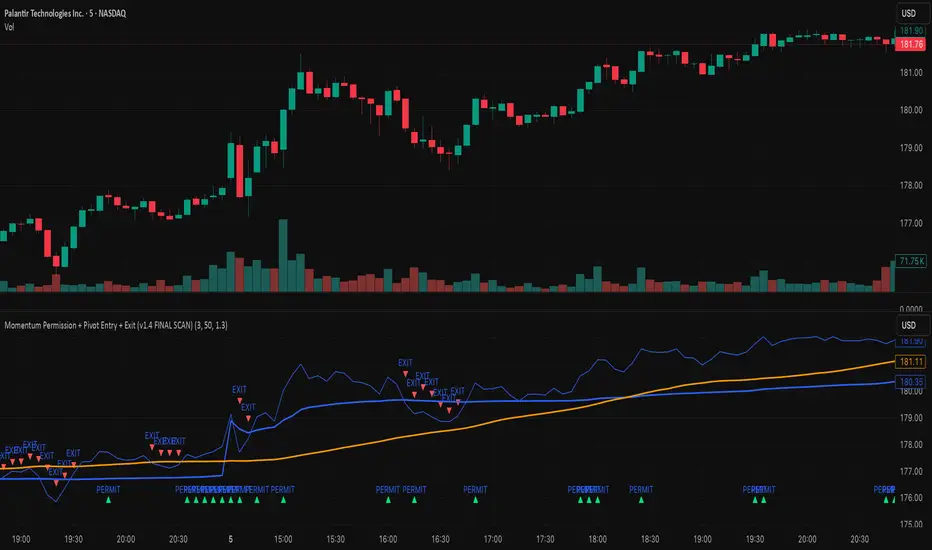
Momentum Permission + Pivot Entry (v1.4 CLEAN ENTRY)//@version=5
indicator("Momentum Permission + Pivot Entry (v1.4 CLEAN ENTRY)", overlay=true)
// ─────────── INPUTS ───────────
pivotLookback = input.int(3, "Pivot Lookback")
smaLen = input.int(50, "SMA Length")
relVolTh = input.float(1.3, "RelVol Threshold")
// ─────────── TREND + MOMENTUM — BASICS ───────────
vwapLine = ta.vwap
smaLine = ta.sma(close, smaLen)
relVol = volume / ta.sma(volume, 10)
pivotLow = ta.lowest(low, pivotLookback) == low
trendUp = close > smaLine
aboveVWAP = close > vwapLine
greenCandle = close > open
// ─────────── PERMISSION (Context Only) ───────────
permitSignal = trendUp and (relVol > relVolTh)
// ─────────── ENTRY LOGIC — ONE CLEAN SIGNAL ───────────
rawEntry = permitSignal and aboveVWAP and pivotLow and greenCandle
// Anti-spam: only first signal in a move
entrySignal = rawEntry and not rawEntry
// ─────────── VISUAL SHAPES (Clean) ───────────
plotshape(permitSignal, style=shape.triangleup, color=color.lime, size=size.tiny, location=location.bottom, text="PERMIT")
plotshape(entrySignal, style=shape.triangleup, color=color.aqua, size=size.small, text="ENTRY")
// ─────────── TREND VISUALS ───────────
plot(vwapLine, "VWAP", color=color.blue, linewidth=2)
plot(smaLine, "SMA50", color=color.orange, linewidth=2)


Crypto Anchored VWAP (Swing High/Low)Crypto Anchored VWAP (Swing High/Low)
This indicator provides an automatic Anchored VWAP system designed specifically for highly volatile assets such as cryptocurrencies (ETH, BTC, SOL, etc.).
Unlike traditional AVWAP tools that require manual date input, this script automatically anchors VWAP to the most recent swing high and swing low, making it ideal for real-time trend tracking and intraday/4H structure analysis.
How It Works
The script detects local swing lows and swing highs based on user-defined swing length.
When a new swing point appears, an Anchored VWAP is initialized from that specific candle.
As price evolves, the AVWAP dynamically becomes:
A trend boundary
A fair-value line
A mean-reversion attractor
Traders can use these levels to identify:
Trend continuation
Breakout confirmation
Mean reversion pullbacks
Overextended expansions
Included Features
✔ Auto-Anchored VWAP from swing low
✔ Auto-Anchored VWAP from swing high
✔ Standard deviation bands (1σ) for volatility context
✔ Designed for Crypto 4H / 1H / 15m
✔ Works on any asset & any timeframe
How To Use
1. Trend Direction
Price above Swing-Low VWAP → Bullish bias
Price below Swing-High VWAP → Bearish bias
2. Trade Setups
Break → Retest → Hold above AVWAP = Trend continuation long
Reject from AVWAP / σ band = Mean-reversion short setup
AVWAP zone → High probability liquidity reaction
3. Volatility Bands
Price touching +1σ = extension
Price returning to 0σ = mean reversion
Price breaking −1σ = trend weakening
Inputs
Swing Length: determines sensitivity of swing high/low detection
(Default: 5)
Best Use Cases
ETH 4H trend following
BTC structure shifts
Altcoin volatility filtering
Identifying institutional "cost basis" zones
Confirming breakouts / fakeouts
Notes
This is not a trading system by itself but a structural tool meant to help traders understand trend and value location. Always combine AVWAP with market structure, volume, and risk management.
Disclaimer
This script is for educational and informational purposes only. It does not constitute financial advice or a recommendation to buy or sell any asset. Use at your own discretion.

Momentum Permission + Pivot Entry + Exit (v1.4 FINAL SCAN)plot(permitOut, "PERMIT", display=display.none)
plot(entryOut, "ENTRY", display=display.none)
plot(exitOut, "EXIT", display=display.none)