OrderFlow Sentiment SwiftEdgeOrderFlow Sentiment SwiftEdge
Overview
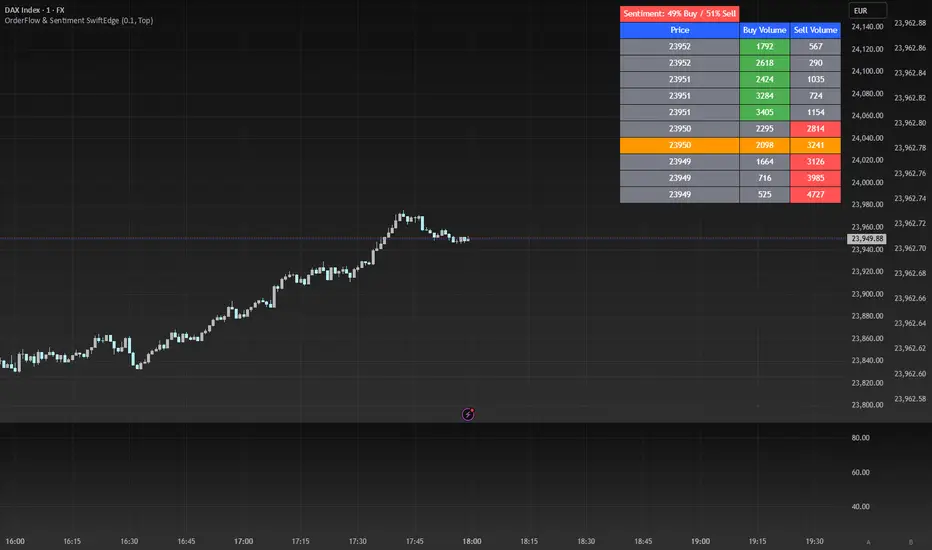
OrderFlow Sentiment SwiftEdge is a visual indicator designed to help traders analyze market dynamics through a simulated orderbook and market sentiment display. It breaks down the current candlestick into 10 price bins, estimating buy and sell volumes, and presents this data in an orderbook table alongside a sentiment row showing the buy vs. sell bias. This tool provides a quick and intuitive way to assess orderflow activity and market sentiment directly on your chart.
How It Works
The indicator consists of two main components: an Orderbook Table and a Market Sentiment Row.
Orderbook Table:
Simulates buy and sell volumes for the current candlestick by distributing total volume into 10 price bins based on price movement and proximity to open/close levels.
Displays the price bins in a table with columns for Price, Buy Volume, and Sell Volume, sorted from highest to lowest price.
Highlights the current price level in orange for easy identification, while buy and sell dominance is indicated with green (buy) or red (sell) backgrounds.
Market Sentiment Row:
Calculates the overall buy and sell sentiment (as a percentage) for the current candlestick based on the simulated orderflow data.
Displays the sentiment above the orderbook table, with the background colored green if buyers dominate or red if sellers dominate.
Features
Customizable Colors: Choose colors for buy (default: green), sell (default: red), and current price (default: orange) levels.
Lot Scaling Factor: Adjust the volume scaling factor (default: 0.1 lots per volume unit) to simulate realistic lot sizes.
Table Position: Select the table position on the chart (Top, Middle, or Bottom; default: Middle).
Default Properties
Positive Color: Green
Negative Color: Red
Current Price Color: Orange
Lot Scaling Factor: 0.1
Table Position: Middle
Usage
This indicator is ideal for traders who want to visualize orderflow dynamics and market sentiment in real-time. The orderbook table provides a snapshot of buy and sell activity at different price levels within the current candlestick, helping you identify areas of high buying or selling pressure. The sentiment row offers a quick overview of market bias, allowing you to gauge whether buyers or sellers are currently dominating. Use this information to complement your trading decisions, such as identifying potential breakout levels or confirming trend direction.
Limitations
This indicator simulates orderflow data based on candlestick price movement and volume, as TradingView does not provide tick-by-tick data. The volume distribution is an approximation and should be used as a visual aid rather than a definitive measure of market activity.
The indicator operates on the chart's current timeframe and does not incorporate higher timeframe data.
The simulated volumes are scaled using a user-defined lot scaling factor, which may not reflect actual market lot sizes.
Disclaimer
This indicator is for informational purposes only and does not guarantee trading results. Always conduct your own analysis and manage risk appropriately. The simulated orderflow data is an estimation and may not reflect real market conditions.
Recherche dans les scripts pour "Candlestick"
Arrow-SimplyTrade vol1.5-FinalTitle: Arrow-SimplyTrade vol1.5-Final
Description:
This advanced trading indicator is designed to assist traders in analyzing market trends and identifying optimal entry signals. It combines several popular technical analysis tools and strategies, including EMA (Exponential Moving Average), MA (Simple Moving Averages), Bollinger Bands, and candlestick patterns. This indicator provides both trend-following and counter-trend signals, making it suitable for various trading styles, such as scalping and swing trading.
Main Features:
EMA (Exponential Moving Average):
EMA200 is the main trend line that helps determine the overall market direction. When the price is above EMA200, the trend is considered bullish, and when the price is below EMA200, the trend is considered bearish.
It helps filter out signals that go against the prevailing market trend.
Simple Moving Averages (MA5 and MA15):
This indicator uses two Simple Moving Averages: MA5 (Fast) and MA15 (Slow). Their crossovers create buy or sell signals:
Buy Signal: When MA5 crosses above MA15, signaling a potential upward trend.
Sell Signal: When MA5 crosses below MA15, signaling a potential downward trend.
Bollinger Bands:
Bollinger Bands measure market volatility and can identify periods of overbought or oversold conditions. The Upper and Lower Bands help detect potential breakout points, while the Middle Line (Basis) serves as dynamic support or resistance.
This tool is particularly useful for identifying volatile conditions and potential reversals.
Arrows:
The indicator plots arrows on the chart to signal entry opportunities:
Green Arrows signal buy opportunities (when MA5 crosses above MA15 and price is above EMA200).
Red Arrows signal sell opportunities (when MA5 crosses below MA15 and price is below EMA200).
Opposite Arrows: Optionally, the indicator can also display arrows for counter-trend signals, triggered by MA5 and MA15 crossovers, regardless of the price's position relative to EMA200.
Candlestick Patterns:
The indicator detects popular candlestick patterns such as Bullish Engulfing, Bearish Engulfing, Hammer, and Doji.
These patterns are important for confirming entry points or anticipating trend reversals.
How to Use:
EMA200: The main trend line. If the price is above EMA200, consider long positions. If the price is below EMA200, consider short positions.
MA5 and MA15: Short-term trend indicators. The crossover of these averages generates buy or sell signals.
Bollinger Bands: Use these bands to spot overbought/oversold conditions. Breakouts from the bands may signal potential entry points.
Arrows: Green arrows represent buy signals, and red arrows represent sell signals. Opposite direction arrows can be used for counter-trend strategies.
Candlestick Patterns: Patterns like Bullish Engulfing or Doji can help confirm the signals.
Customizable Settings:
Fully customizable colors, line styles, and display settings for EMA, MAs, Bollinger Bands, and arrows.
The Candlestick Patterns feature can be toggled on or off based on user preference.
Important Notes:
This indicator is intended to be used in conjunction with other analysis tools.
Past performance does not guarantee future results.
Polish:
Tytuł: Arrow-SimplyTrade vol1.5-Final
Opis:
Ten zaawansowany wskaźnik handlowy jest zaprojektowany, aby pomóc traderom w analizie trendów rynkowych oraz identyfikowaniu optymalnych sygnałów wejścia. Łączy w sobie kilka popularnych narzędzi analizy technicznej i strategii, w tym EMA (Wykładnicza Średnia Ruchoma), MA (Prosta Średnia Ruchoma), Bollinger Bands oraz formacje świecowe. Wskaźnik generuje zarówno sygnały podążające za trendem, jak i przeciwnym trendowi, co sprawia, że jest odpowiedni do różnych stylów handlu, takich jak scalping oraz swing trading.
Główne Funkcje:
EMA (Wykładnicza Średnia Ruchoma):
EMA200 to główna linia trendu, która pomaga określić ogólny kierunek rynku. Gdy cena znajduje się powyżej EMA200, trend jest uznawany za wzrostowy, a gdy poniżej EMA200, za spadkowy.
Pomaga to filtrować sygnały, które są niezgodne z głównym trendem rynkowym.
Proste Średnie Ruchome (MA5 i MA15):
Wskaźnik używa dwóch Prostych Średnich Ruchomych: MA5 (szybka) oraz MA15 (wolna). Ich przecięcia generują sygnały kupna lub sprzedaży:
Sygnał Kupna: Kiedy MA5 przecina MA15 od dołu, sygnalizując potencjalny wzrost.
Sygnał Sprzedaży: Kiedy MA5 przecina MA15 od góry, sygnalizując potencjalny spadek.
Bollinger Bands:
Bollinger Bands mierzą zmienność rynku i mogą pomóc w identyfikowaniu okresów wykupienia lub wyprzedania rynku. Górna i dolna linia pomagają wykrywać punkty wybicia, a Środkowa Linia (Basis) działa jako dynamiczny poziom wsparcia lub oporu.
Narzędzie to jest szczególnie przydatne w wykrywaniu warunków zmienności i potencjalnych odwróceń trendu.
Strzałki:
Wskaźnik wyświetla strzałki na wykresie, które wskazują sygnały kupna i sprzedaży:
Zielona strzałka wskazuje sygnał kupna (gdy MA5 przecina MA15 i cena jest powyżej EMA200).
Czerwona strzałka wskazuje sygnał sprzedaży (gdy MA5 przecina MA15 i cena jest poniżej EMA200).
Strzałki w przeciwnym kierunku: Opcjonalna funkcja, która pokazuje strzałki w przeciwnym kierunku, uruchamiane przez przecięcia MA5 i MA15, niezależnie od pozycji ceny względem EMA200.
Formacje Świecowe:
Wskaźnik wykrywa popularne formacje świecowe, takie jak Bullish Engulfing, Bearish Engulfing, Hammer oraz Doji.
Formacje te pomagają traderom potwierdzić punkty wejścia i przewidzieć możliwe odwrócenia trendu.
Jak Używać:
EMA200: Główna linia trendu. Jeśli cena jest powyżej EMA200, rozważaj pozycje długie. Jeśli cena jest poniżej EMA200, rozważaj pozycje krótkie.
MA5 i MA15: Śledzą krótkoterminowe zmiany trendu. Przecięcia tych średnich generują sygnały kupna lub sprzedaży.
Bollinger Bands: Używaj tych pasm do wykrywania wykupionych lub wyprzedanych warunków. Wybicia z pasm mogą wskazywać potencjalne punkty wejścia.
Strzałki: Zielona strzałka wskazuje sygnał kupna, a czerwona strzałka sygnał sprzedaży. Strzałki w przeciwnym kierunku mogą być używane do strategii przeciwtrendowych.
Formacje Świecowe: Formacje takie jak Bullish Engulfing czy Doji mogą pomóc w potwierdzaniu sygnałów.
Ustawienia Personalizacji:
W pełni personalizowalne kolory, style linii i ustawienia wyświetlania dla EMA, MAs, Bollinger Bands oraz strzałek.
Funkcja Formacji Świecowych może być włączana lub wyłączana według preferencji użytkownika.
Ważne Uwagi:
Ten wskaźnik powinien być używany w połączeniu z innymi narzędziami analizy rynku.
Wyniki z przeszłości nie gwarantują wyników w przyszłości.

Consecutive Higher/Lower Closes with Breakout LineIndicator Description:
"Four Consecutive Higher/Lower Closes with Auto Breakout Line Timeframe" is a custom TradingView indicator designed to help traders identify key breakout points based on consecutive price action. It combines two main features:
Four Consecutive Higher/Lower Closes – Detects bullish or bearish momentum through consecutive higher or lower closing prices.
Auto Breakout Line – Plots a breakout line that adapts to the timeframe of the chart, helping to visualize potential breakout levels and trends.
Features:
Higher/Lower Close Detection: The indicator tracks and plots lines when there are four consecutive higher closes (bullish) or four consecutive lower closes (bearish). This can signal a trend or momentum in the market.
Breakout Line: It draws an adaptive breakout line that adjusts based on the selected timeframe (i.e., the chart interval), helping traders visually identify breakout levels across different timeframes.
Timeframe Adaptability: The indicator automatically adjusts the breakout line timeframe based on the chart interval (e.g., 15 minutes for lower timeframes and 1 day for higher timeframes).
Customizable Timeframe and Color: The default color for breakout lines is purple, but it is customizable. You can also enable/disable the breakout line through the settings.
How to Use This Indicator for Trading:
1. Trading with Consecutive Higher/Lower Closes:
Bullish Signal: When the indicator detects four consecutive higher closes, it signifies increasing buying momentum. Traders might consider taking long positions when this occurs, especially if the price continues to close higher.
Bearish Signal: When the indicator detects four consecutive lower closes, it signals increasing selling pressure. Traders might consider taking short positions if the price continues to close lower.
Confirmation: The fourth consecutive higher or lower close should be confirmed with additional analysis, such as candlestick patterns, support/resistance levels, or volume.
2. Using the Breakout Line:
The breakout line is designed to help traders identify potential breakout levels. When the price approaches or crosses this line, it could indicate that the market is either breaking out in the direction of the trend or failing to continue the trend.
Bullish Breakout: If the price crosses the breakout line upwards (after four consecutive higher closes), it may confirm that a bullish breakout is in progress. This can be a good opportunity to take a long position.
Bearish Breakout: If the price crosses the breakout line downwards (after four consecutive lower closes), it may confirm that a bearish breakout is occurring. This can be an opportunity to take a short position.
Avoid False Breakouts: It is important not to react to every price move crossing the breakout line. Wait for additional confirmation signals like higher volume, candlestick patterns (e.g., bullish or bearish engulfing), or other technical indicators (e.g., RSI, MACD) to confirm the breakout's validity.
How to Avoid Fake Breakouts:
A fake breakout occurs when the price moves beyond a breakout level but then quickly reverses back inside the range, trapping traders who took positions in the breakout direction.
Here are strategies to avoid fake breakouts:
1. Volume Confirmation:
A valid breakout is often supported by higher volume. If the price crosses the breakout line but the volume is low, it's more likely to be a fake breakout. Always check the volume when a breakout occurs.
Look for volume spikes that accompany the breakout. A surge in volume confirms the market's conviction in the new trend.
2. Candlestick Patterns:
Bullish/bearish engulfing patterns or Doji candles can provide important insights into potential reversals. If a breakout occurs but is immediately followed by a bearish engulfing candle, it's a sign that the breakout may be false.
Also, check for candlestick formations at key support or resistance levels for confirmation.
3. Time Confirmation:
Wait for the close of the current bar to confirm the breakout. A breakout within a single bar without closing above or below a significant level could be a false move.
Sometimes the market will test the breakout level before committing to the direction. This is common in volatile or choppy market conditions.
4. Use of Other Indicators:
RSI (Relative Strength Index): An overbought or oversold condition can indicate a potential reversal after a breakout.
MACD (Moving Average Convergence Divergence): Watch for a MACD crossover that aligns with the breakout direction to confirm the move.
5. Use Stop Losses:
A key rule in avoiding fake breakouts is to always use stop-loss orders. Set your stop-loss just outside the breakout level to avoid excessive losses if the price reverses.
Trailing stops can also help lock in profits if the price moves in your favor but may reverse at a later point.
Summary:
The Four Consecutive Higher/Lower Closes with Auto Breakout Line Timeframe indicator is a valuable tool for identifying strong trends and potential breakouts in the market. By combining consecutive close patterns with dynamic breakout levels, it can help traders spot bullish or bearish momentum and make more informed trading decisions. However, always confirm breakouts with volume, candlestick patterns, and other technical indicators to avoid fake breakouts and reduce the risk of false signals.
By using this indicator along with prudent risk management strategies, traders can improve their chances of entering and exiting trades at the right time while avoiding unnecessary losses from false breakouts.

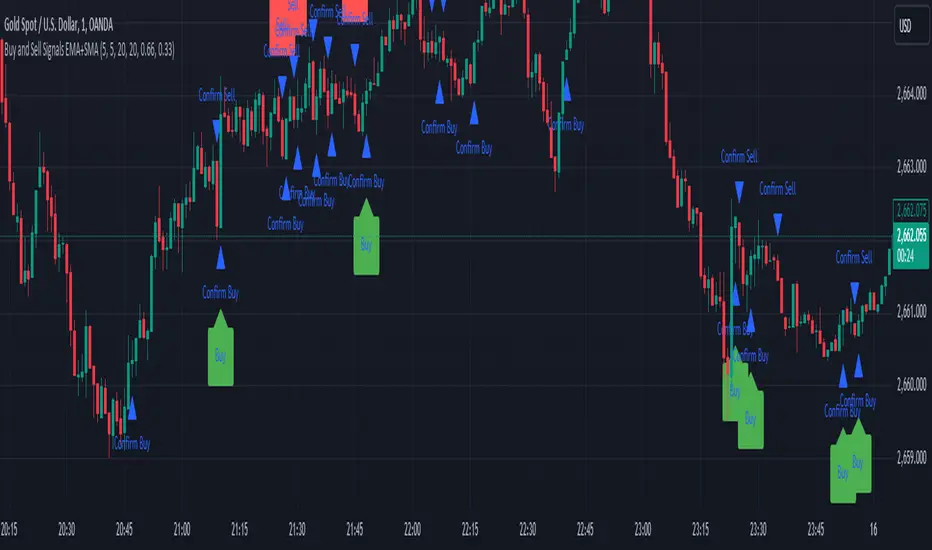
Sell Signals EMA+SMAIndicator Overview:
This indicator identifies sell signals based on candlestick patterns, volume conditions, and moving average confirmations. It also plots support and resistance levels based on pivot highs and pivot lows. You can configure different settings like pivot lengths, moving average periods, and candlestick pattern conditions for the sell signals.
Configurable Settings:
Pivot High Length: Defines the number of bars used to calculate the resistance levels (pivot highs).
Pivot Low Length: Defines the number of bars used to calculate the support levels (pivot lows).
Volume SMA Length: The period of the simple moving average (SMA) for volume. Used to filter signals based on high volume.
Close SMA Length: The period of the simple moving average (SMA) for the close price. Used for confirmation of sell signals.
Pin Bar High Ratio: The ratio for defining the size of the upper wick in a bearish pin bar.
Pin Bar Low Ratio: The ratio for defining the size of the lower wick in a bearish pin bar.
How It Works:
Support and Resistance:
The indicator plots red lines for resistance (pivot highs) and green lines for support (pivot lows).
These levels are updated as new pivot points are detected based on the configured pivot lengths.
Sell Signal Conditions:
Candlestick Patterns: The indicator checks for two bearish patterns:
Bearish Pin Bar: A candle with a large upper wick and small lower wick where the close is below the open.
Bearish Engulfing: A candle where the current close is lower than the previous low, and the current open is higher than the previous high.
Volume Condition: The volume must be above the configured simple moving average (SMA) of the volume.
Confirmation: A sell signal is confirmed only when the price crosses below the configured SMA for the close price.
Sell Signals:
If all the conditions (candlestick pattern, volume, and confirmation) are met, the indicator will plot a red "Sell" label above the candle.
Additionally, a blue triangle will appear above the candle to indicate that the sell signal has been confirmed.
How to Use:
Adjust the Settings:
Open the settings of the indicator and adjust the parameters like pivot lengths, moving average periods, and candlestick pattern ratios based on your preferences.
Identify Key Levels:
Watch the red resistance and green support lines to identify key levels where price may reverse.
Look for Sell Signals:
When a red "Sell" label appears, it indicates a possible sell opportunity.
Ensure that a blue triangle (confirmation) also appears to validate the sell signal.
Manage Risk:
Use the support and resistance levels along with the sell signals to define your entry, stop-loss, and take-profit levels.
This indicator helps you identify potential bearish reversal points with configurable settings for added flexibility.
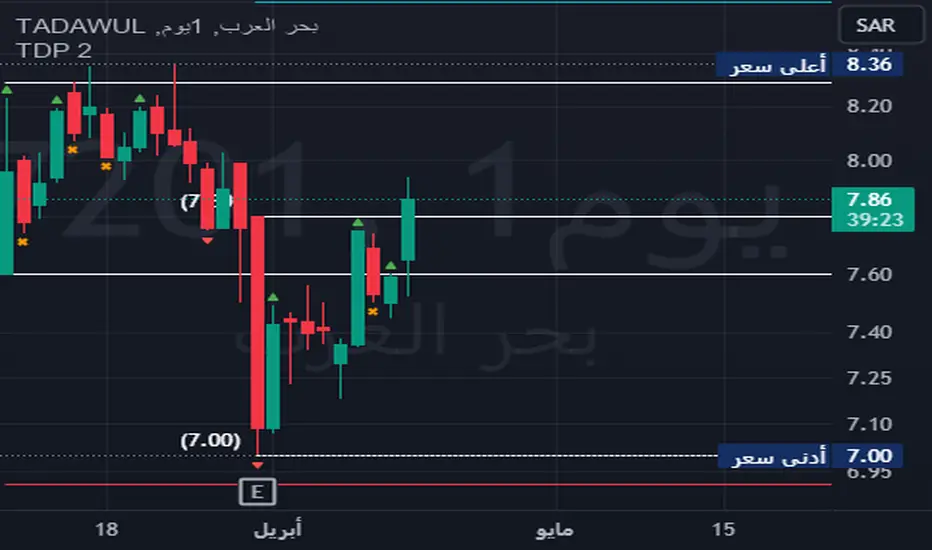
TDP 2Title: Enhanced Candlestick Pattern Identifier with Body Ratio Analysis
Description:
This Pine Script, titled "Enhanced Candlestick Pattern Identifier with Body Ratio Analysis," is designed to aid traders in visualizing key candlestick formations that have significant implications for trend reversals and continuations. It uses the body ratio of candles to identify strong directional movements, enhancing decision-making processes in trading strategies.
Key Features:
Body Ratio Calculation: The script calculates the body ratio of each candle, which is the proportion of the candle's body to its total range. This helps in distinguishing between candles that show decisive market movements versus those with indecision.
Bullish Candle Identification: Identifies bullish candles where the close is greater than the open and the body constitutes at least 55% of the total candle range, indicating strong buying pressure.
Bearish Candle Identification: Flags bearish candles where the open is above the close with a body ratio of 55% or more, highlighting strong selling pressure.
Comparative Analysis: The script not only identifies bearish candles but also categorizes them based on whether they close below the lowest point of the last qualifying bullish candle, offering insights into potential breakdowns or supports.
Visual Markers: Uses distinct shapes and colors to mark each type of candle directly on the chart, making it easy to spot these patterns in real-time trading scenarios.
Utility:
This tool is invaluable for traders who utilize technical analysis to make informed decisions. By providing clear visual cues about significant bullish and bearish candlestick formations, the script facilitates quick interpretations of potential market moves, helping traders to capitalize on trends or protect against losses from reversals.
How to Use:
Simply add this script to your chart, and it will automatically highlight the qualifying candles. Green labels indicate strong bullish candles, red labels signify bearish candles closing below the last bullish candle's low, and orange labels show bearish candles that do not close below the bullish low.
Ideal for use in various markets including forex, equities, and commodities, this script is a must-have tool for both novice and experienced traders aiming to enhance their trading strategy with detailed candlestick pattern analysis.
OW_MTF CandleDescription
Overview The OW_MTF+ indicator allows traders to visualize Higher Timeframe (HTF) candlesticks directly on their current chart. Designed for Price Action and Smart Money Concepts (SMC) traders, this tool helps you perform Top-Down Analysis without switching back and forth between timeframes.
Unlike standard MTF indicators, this script features a Dynamic History Fade system that automatically adjusts the transparency of older candles, keeping your chart clean and focused on recent price action.
Key Features
・Multi-Timeframe Overlay: Display candles from any higher timeframe (e.g., show 4-Hour candles on a 15-Minute chart).
・Real-Time Updates: Uses lookahead=barmerge.lookahead_on to ensure the forming HTF candle updates in real-time with the current market price, allowing for immediate reaction to live price action.
・Dynamic Transparency (Fade Effect): The indicator includes a smart visual management system. It automatically increases the transparency of older historical candles so they do not obscure your chart, while keeping the most recent candles vivid and clear.
・Extended History: Supports displaying up to 500 historical HTF bars, giving you a deep view of past market structure.
・Time-Accurate Positioning: utilizes xloc.bar_time to ensure candles and wicks are perfectly aligned with the correct timestamp, preventing visual misalignment during market gaps.
Settings & Customization
・Timeframe: Select your desired Higher Timeframe (e.g., 240 for 4-Hour, D for Daily).
・History Depth: Choose how many HTF bars to display (Max 500).
Visual Styles: Fully customizable colors for Bullish/Bearish bodies, wicks, and borders.
・Auto Extend Mode: When enabled, this optimizes the transparency of the most recent 50 bars for the best visual experience.
Technical Note This indicator uses lookahead_on to retrieve HTF data. This is intentional to allow the current forming bar to update in real-time. Please note that while the historical closed candles are permanent, the currently active HTF candle will update tick-by-tick until it closes.
概要
OW_MTF Candleは、現在表示しているチャート上に上位足のローソク足を重ねて表示するマルチタイムフレーム・インジケーターです。 プライスアクションやスマートマネーコンセプト(SMC)を用いたトレードにおいて、時間足を切り替えることなくトップダウン分析を行うのに最適です。
通常のMTFインジケーターとは異なり、**「ダイナミック・ヒストリー・フェード(動的透明度調整)」**機能を搭載しています。これにより、過去の古いローソク足の透明度を自動的に上げ、最新のプライスアクションを強調しつつ、チャート全体の視認性を保ちます 。
主な機能
・マルチタイムフレーム表示: 任意の上位足を選択して表示可能です(例:15分足チャートに4時間足のローソクを表示など)。
・リアルタイム更新: request.security で lookahead=barmerge.lookahead_on を使用しているため、現在形成中の上位足もリアルタイムの価格に追従して動きます 。
・動的透明度(フェード効果): 過去の履歴バーがチャートを邪魔しないよう、古い足ほど自動的に透明度を高く調整します。これにより最新の相場状況がクリアに表示されます 。
・拡張履歴: 最大500本までの過去の上位足を表示でき、長期的な市場構造の確認が可能です 。
・正確な位置合わせ: xloc.bar_time(時間座標)を使用しているため、市場の休場やギャップがあってもローソク足とヒゲが正しい時刻に配置されます 。
設定項目
・上位足の時間足 (Timeframe): 表示したい上位足を選択します(デフォルト: 240/4時間足)。
・表示する履歴本数: 過去何本分の上位足を表示するか設定します(最大500本)。
・スタイル設定: 上昇足・下降足の実体色、ヒゲの色、枠線の太さなどを自由にカスタマイズ可能です 。
・自動拡張モード (Auto Extend): 最新の50本に対して最適な透明度調整を自動で行います 。
技術的な注釈
・確定した過去足: リペイントしません(変化しません)。
・現在進行中の足: 確定するまではリアルタイムで形状が変化します。

Wp's Vector CandlesVector Candles are special, color-coded candlesticks that highlight significant market activity, showing intense buying/selling (climax), institutional entry, momentum shifts, or potential reversals by analyzing high volume and large price ranges (spreads). They transform normal charts to instantly spot areas of extreme participation (bullish green/blue, bearish red/violet) versus standard conditions (gray), helping traders see market dynamics beyond just price.

BLACK SWAN SWEEP (DANIELPEREZ)Crt de velas especificas después del sweep buscar la confirmación del order block para tomar una operacio .
Check specific candlesticks after the sweep to find order block confirmation before taking a trade.

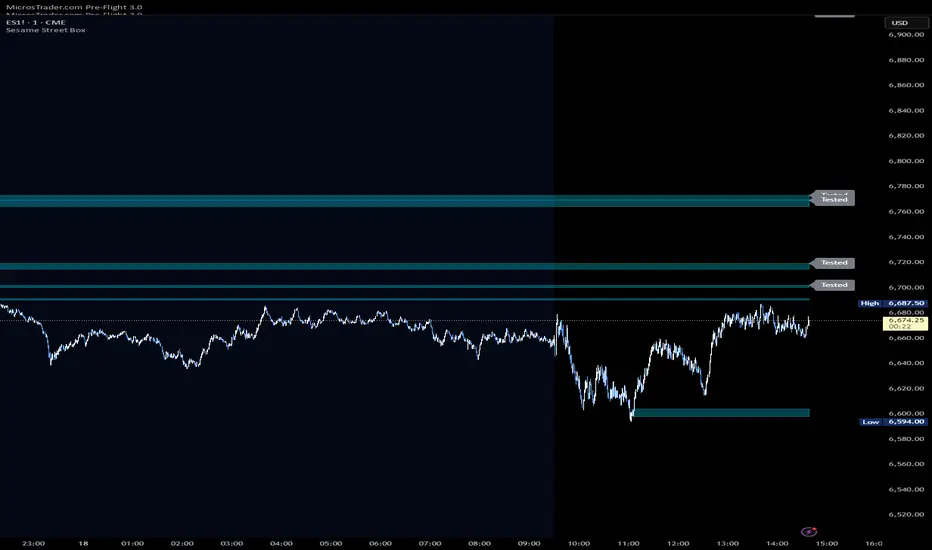
Sesame Street BoxThe Sesame Street Box is a 100% original candlestick pattern by it's creator. ICT invented order blocks, I have invented the Sesame Street Box.
This candlestick pattern draws a retouch box. In particular, in an up trend, it finds one down closed candle that has at least 3 up closed candles before it, and 3 or more up closed candles after it. 3-1-3 candle stick pattern. The 3 or more candles after it MUST leave the candlestick range of the down closed candle for the box to draw. The box is drawn from the low of the down closed candle to the high of the down closed candle and extended to the right. Once price reaches into this box, you would long off the top of the rendered box for continuation.
The reverse is true for shorts. For shorts, there would be 3 or more down closed candles, 1 up closed candle, followed by 3 or more down closed candles that leave the up closed candle's range. If these conditions are met, a box is drawn. The box is drawn from the low of the up closed candle to the high of the up closed candle and extended to the right. Once price reaches into this box, you would short off the bottom of the rendered box for continuation.
This indicator also provides 2 optional time frames to render the same pattern on your active chart. If you do not want to use these, just leave the option set as chart, and only the active timeframe will render.
There is also an option to toggle how to handle the boxes once they are invalidated. Either you can delete them, or choose to have them stop rendering at the candle that invalidated them.
Exciting Candles by BitcoinBailyExciting Candles by BitcoinBaily — is a custom indicator that visually highlights "momentum" or "exciting" candlesticks on the chart.
It helps traders quickly identify candles with strong body-to-range ratios, i.e., candles showing strong price momentum (big move between open and close relative to the high-low range).
If the candle’s body is greater than or equal to the threshold percentage (say 85%), the bar is colored yellow. Otherwise, no color is applied.
Yellow Candle = Exciting Candle
The candle’s body occupies ≥ the set % (e.g., 85%) of the total high-low range.
Indicates strong momentum (buyers or sellers dominated most of that period).
No Color = Neutral / Normal Candle
Price moved both ways (upper & lower wicks), but neither buyers nor sellers fully dominated.
1. Range Breakout: When price breaks a sideways range and a yellow (exciting) candle appears,
it confirms that real momentum has entered — a good time to catch the move early.
2. Trend Pullback: If price dips to a moving average (like 20 or 50 SMA) and then forms a yellow
candle, it signals that buyers are regaining control — often a high-probability trend
continuation entry.
3. Exhaustion Top: A yellow bearish candle near a resistance area shows strong selling pressure
— a warning that the uptrend may be ending.
4. Sideways Market: When no yellow candles appear, the market lacks momentum — best to
stay out and avoid choppy trades.

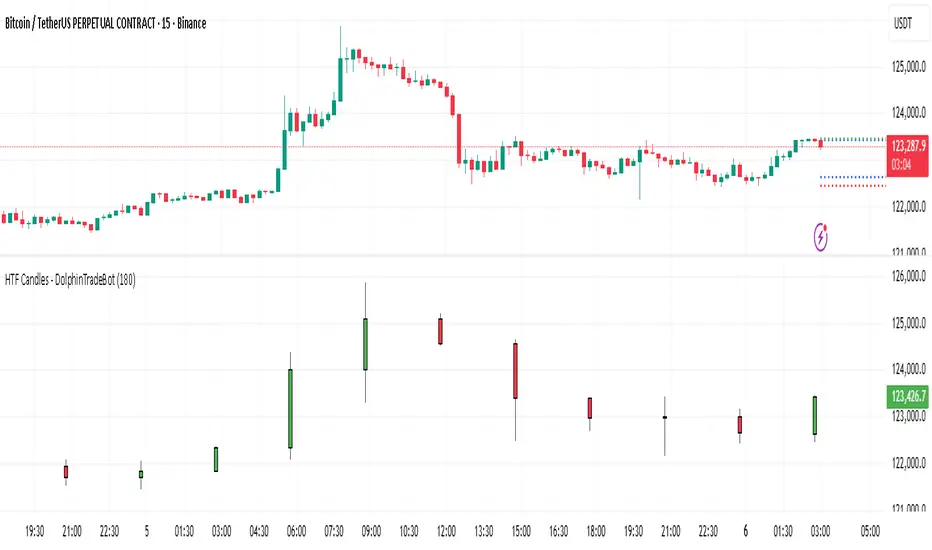
HTF Candles - DolphinTradeBot1️⃣ Overview
The "HTF Candles - DolphinTradeBot" indicator displays higher timeframe (HTF) candlesticks and their OHLC (Open, High, Low, Close) levels on any lower timeframe chart.
While staying on lower timeframes this helps confirm entries or reversals and visualize major market structure, trend bias, and key price zone
2️⃣ How to Use It ?
Use these levels to identify major support/resistance or trend structure.
Observe higher timeframe candle formations (e.g., engulfing, pin bar, doji)
3️⃣ ⚙️Settings
TimeFrame → Select the higher timeframe to display.
Show OHLC Levels → Toggle lines for Open, High, Low, Close.
Line Colors → Customize the color for each level.
Objective Doji Highlight (Range-Relative)This indicator highlights Doji candles using an objective, mathematics-based rule: a bar is Doji when the absolute difference between its open and close is less than or equal to a user-defined fraction (x) of that bar’s high–low range.
How it works:
Compute body size as the absolute difference between open and close.
Compute the bar’s range as high minus low.
Classify as Doji when body size ≤ x × range.
Only Doji candles are colored; non-Doji bars remain unchanged.
Inputs
Doji threshold (x of range): tolerance (0–1) controlling how small the body must be relative to the range.
Doji Candle Color: visual color for detected Doji candles.
Example:
If x = 0.10 and a candle has high = 100 and low = 90 (range = 10), the maximum allowed body is 1.
If the difference between open and close is ≤ 1, the candle is marked as Doji.
Why it can be useful
Doji candles are often studied as signs of market indecision. This tool provides a clear, parameter-based way to identify them consistently across any timeframe, without discretionary interpretation.
Notes & limitations
Works with standard candlesticks (not Heikin Ashi, Renko, or other synthetic bar types).
Visualization and research only: it does not produce buy/sell signals and makes no performance claims.
No repainting from future data; the logic uses only the current bar’s prices.

顶/底分型 指标Top/Bottom Fractal Indicator is a technical analysis tool used to identify potential reversal points in a market trend. It is based on the concept of fractal patterns, which consist of specific candlestick formations that signal local highs (top fractals) or lows (bottom fractals).
A top fractal typically occurs when the high of a middle candlestick is higher than the highs of the two candles on either side. This formation suggests that upward momentum may be weakening and a downward reversal could follow. Conversely, a bottom fractal forms when the low of a middle candlestick is lower than the lows of the two adjacent candles, indicating a potential shift from a downtrend to an uptrend.
This indicator is commonly used to spot market turning points, determine entry or exit signals, and enhance the reliability of other indicators such as Bollinger Bands or MACD. Because of its clear structure and reliable reversal signals, the Top/Bottom Fractal Indicator is also widely applied in wave theory and price action strategies.
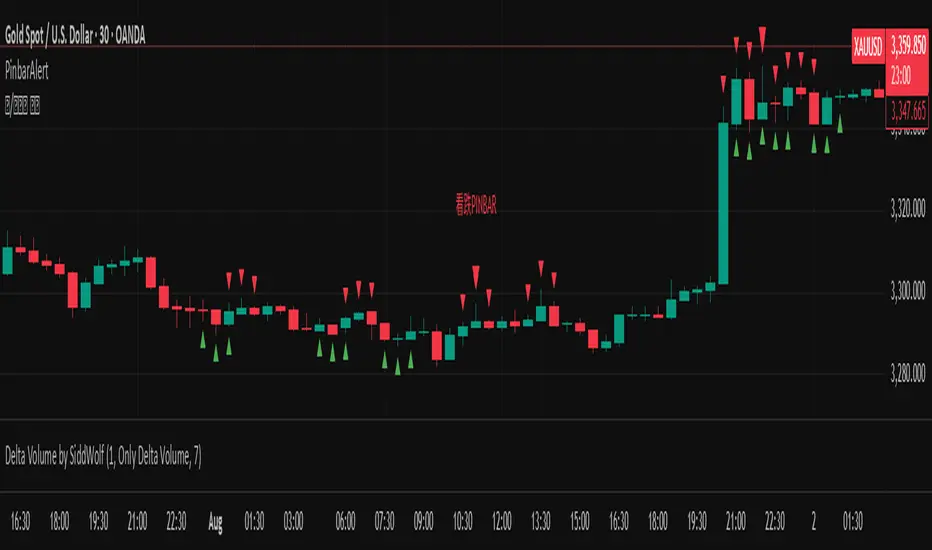
Pinbar DetectorPinbar Detector is original from Naked Candlestick Trading Method
Pinbar Definition: A candlestick where the dominant shadow exceeds 2/3 of the entire candle length
Key Features:
Bearish Pinbar: Red downward triangle when upper shadow exceeds 2/3 of total candle length
Bullish Pinbar: Green upward triangle when lower shadow exceeds 2/3 of total candle length
Background highlighting for easy identification
Alert conditions for both bullish and bearish pinbars
Original candlestick display preserved

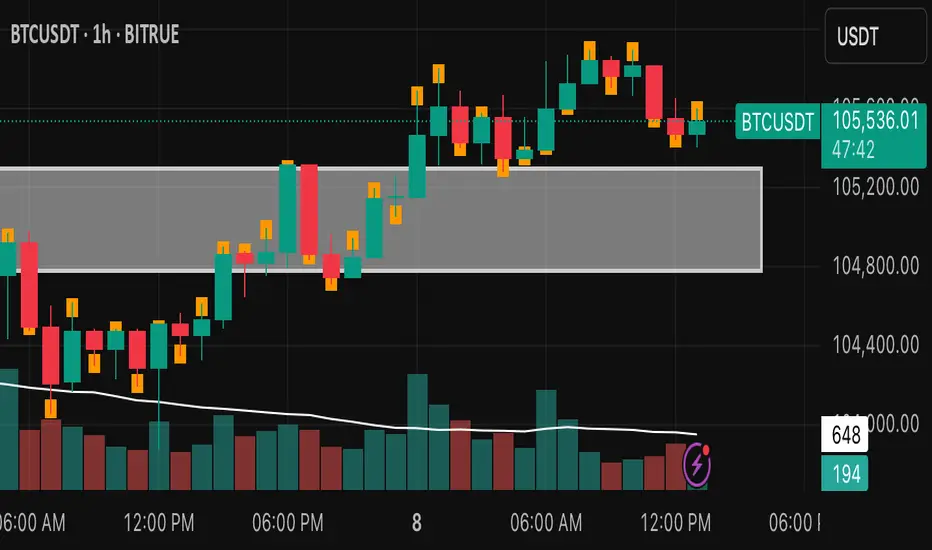
Candle Close Location MarkerThis script customizes the appearance of candlesticks by highlighting whether the candle closed in the upper, middle, or lower part of its range — using a small orange marker inside each candle.
It also includes a traditional volume histogram with two simple moving averages (SMA 20 and SMA 50), helping traders detect volume trends and potential reversals.
📌 Useful for identifying strength of momentum and visualizing market sentiment clearly.
Features:
• ✅ Colored candles: green for bullish, black for bearish
• ✅ Orange square shows the position of the close (top, middle, or bottom of the candle)
• ✅ Volume bars with SMA 20 (orange) and SMA 50 (blue)
• ✅ Works on all timeframes
Developed by:
Version: 1.0
Language: Pine Script v5
Another EMA/RSI trend indicatorAnother EMA/RSI trend indicator is a trend-following trade signal and back-testing tool. It leverages EMA, RSI, ATR, volume, and price breakouts to generate and track buy/sell signals, manage trades, and display performance statistics.
EMA (Exponential Moving Average): Used for identifying trend direction.
RSI (Relative Strength Index): Used to confirm momentum.
ATR (Average True Range): Used to calculate Stop Loss (SL) and Take Profit (TP) dynamically.
Volume: Only trades when current volume > average volume.
Price breakout filters: Detects bullish/bearish breakout candlesticks for signals.
Entry Logic
Entry placed slightly above/below current price using an ATR-based buffer.
Configurable SL and TP using ATR multipliers.
Optional: Stop existing trade on a new opposite signal.
Entry filters include price structure checks using highs/lows.
Visual output
Plots Buy/Sell signals on chart
Draws entry, SL, and TP lines for ongoing trades
Displays trade statistics in a table (top-right):
Trade count
Wins/Losses/Stopped
Win rate
Cumulative and average profit/loss
Start date
This is a semi-automated trading signal generator and visual back-tester aimed at helping traders:
Identify trend-based entry opportunities
Automate entry/exit evaluation using standard risk management
Evaluate performance with live stats

Engulfing Logic Candle Consolidation
The "Engulfing Logic Candle Consolidation" indicator is designed to visualize price zones where multiple candlesticks are engulfing each other. When candles meet specific engulfing conditions, the script merges them into a single "virtual" range and displays it using semi-transparent boxes on the chart.
- Engulfing Range Logic : Automatically detects and consolidates groups of candles that are fully engulfed by others, forming clear structural zones.
- Multi-Session Time Highlights : Marks major trading sessions (Asia, Europe, U.S.) with customizable colors and visibility settings, helping traders identify time-based market rhythms.
The indicator uses two engulfing conditions to form virtual zones:
1、 Short-after-Long (right-side engulfing) : If the current candle is engulfed by the previous candle, a virtual box begins from that pair.
2、 Long-after-Short (left-side engulfing) : If the current candle engulfs one or more previous candles (looping backward), it triggers zone formation.
The zone grows as long as new candles are completely inside the range of prior ones. When engulfing ends, the range is boxed and preserved visually.
This tool is ideal for traders who focus on price structure. By consolidating engulfing candles into zones, it filters out noise and emphasizes meaningful price behavior. Works well when combined with trendlines, support/resistance, and volume indicators.
---
中文
<概述>
結合律 K 線整理指標用於視覺化市場中具有「吞噬行為」的價格結構。當多根 K 線出現互相包含的情況時,指標會將它們合併成一個虛擬區間,並以半透明區塊方式在圖表中標示出來。
<功能>
- 吞噬區間邏輯 :自動判斷多根 K 線是否符合「包容」邏輯,將其歸納為單一整理區。
- 多時區背景提示 :標示亞洲、歐洲、美國主要交易時段,並可自由設定顏色與開關,強化交易節奏感知。
<邏輯說明>
此指標使用兩種吞噬條件建立整理區:
短後長(右側包容) :若當前 K 線被前一根吞噬,將該兩根視為起點。
長後短(左側包容) :若當前 K 線吞噬一或多根前方 K 線,則回頭形成區間。
只要後續 K 線繼續落在區間內,就會不斷擴展。直到不再符合條件,該區間會被框選並視覺化標示。
<使用情境>
適合用於進行價格行為結構分析的交易者。它能簡化雜訊,聚焦在關鍵轉折與延續區。可與趨勢線、支撐壓力、成交量指標等搭配使用,提高 K 線策略的判讀效率。

Wick Ratio IndicatorScript Description: Wick Ratio Indicator
This Pine Script indicator identifies candlesticks with dominant upper or lower wicks and visually marks them on the chart. It helps traders spot potential price rejection signals, often used to anticipate trend reversals or breakout opportunities. Key Features
Wick Length Calculation
Upper Wick: high - max(open, close)
(Measures distance from the highest price to the candle body's top)
Lower Wick: min(open, close) - low
(Measures distance from the candle body's bottom to the lowest price)
Comparison Logic
Green Triangle (▲): Plotted above the candle when the upper wick is longer (bearish rejection signal).
Red Triangle (▼): Plotted below the candle when the lower wick is longer (bullish rejection signal).
Visual Simplicity
Non-intrusive design that overlays directly on price action.
Customizable colors and sizes (modifiable in settings).

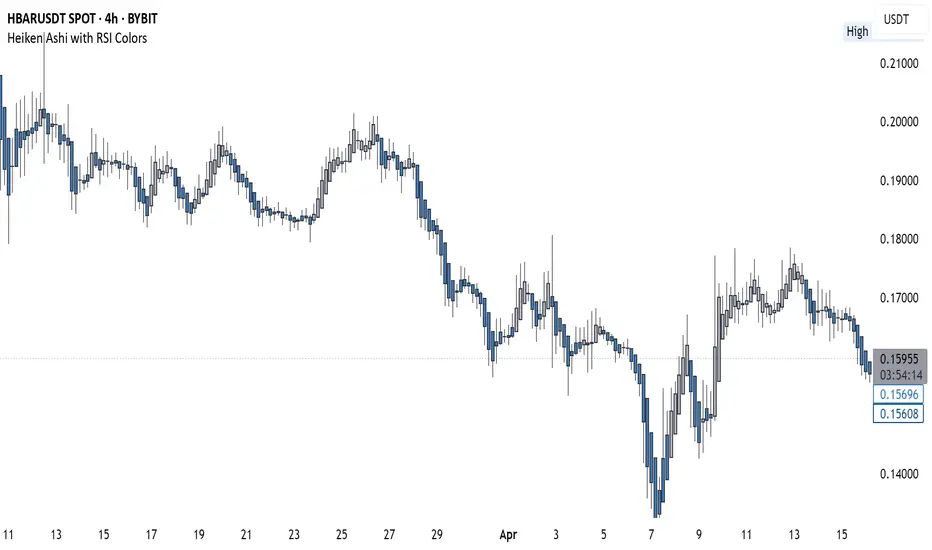
Heiken Ashi with RSI Colors📜 Description:
This indicator blends Heiken Ashi candlesticks with RSI-based color filters to help traders quickly assess both trend structure and momentum extremes in a single glance.
✅ Heiken Ashi Mode: Smooths out price action to highlight clearer trends and suppress noise
✅ RSI Coloring: Applies candle color changes based on whether RSI is overbought, oversold, or neutral
It allows traders to visually spot potential exhaustion zones, continuation trends, or early reversal areas with enhanced clarity.
🔧 Settings:
Use Heiken Ashi Candles: Toggle between standard candles and Heiken Ashi smoothed values
RSI Length: Controls the lookback for RSI calculation (default 14)
Overbought/Oversold Levels: Customize your thresholds for extreme conditions (default: 70/30)
🎨 Candle Color Logic:
Green (Lime): RSI is overbought → price may be overextended upward
Red: RSI is oversold → price may be overextended downward
Gray: RSI is between extremes → neutral momentum
💡 Use Cases:
Confirm trend momentum with Heiken Ashi structure
Spot potential reversal points using RSI extremes
Enhance entry/exit decisions by combining price action and momentum in a single visual
ATR gorizontal vswed
This indicator is based on the Average True Range (ATR) and provides users with a clear visual representation of key volatility metrics for a selected asset. The ATR is calculated using daily candlesticks over a specified period.
🔹 Key Features:
ATR 1D – Average True Range value over the selected period (default: 24 days).
Current ATR – Current relative volatility compared to ATR.
Stop ATR – Suggested stop-loss level based on ATR.
Power Reversal – Difference between ATR and current volatility.
Risk-Reward Ratio (RR) – The ratio between the potential reward and the stop-loss level.
📊 Visual Representation:
The indicator displays data in a compact, horizontal table, positioned at the desired location on the chart (default: bottom-right). The values are color-coded for better readability.
This tool is useful for traders looking to assess market volatility, stop-loss placement, and potential trade opportunities based on ATR calculations.

langshen K-Line CounterEnglish Description:**
This indicator, named “langshen K-Line Counter,” is designed to count the number of K-line bars (candlesticks) during the current trading day. The key functionalities include:
- **Daily Reset**: At the start of a new trading day (detected by the change in daily time), the counter automatically resets to 1.
- **Incremental Counting**: For each new bar within the same trading day, the counter increments by 1, thus recording the sequence number of each K-line.
- **Chart Display**: The current count is displayed as a numerical label above the high of each K-line on the chart. Users can customize the text size and color of these numbers.
This feature enables traders to visually track the number of K-lines and their sequence within the day, which can assist in analyzing market trends and the pace of price movements.
中文介绍:**
此指标名为“langshen K线计数器”,主要用于统计当前交易日内的K线(蜡烛图)数量。指标的核心功能包括:
- **每日计数重置**:在交易所日切换时(即新的一天开始时),计数器自动重置为1。
- **逐根累加**:在同一交易日内,每根新出现的K线都会使计数器加1,从而记录当天的K线序号。
- **图表展示**:计数器的当前值会以数字标签的形式显示在每根K线的最高价上方,用户可自定义数字的显示大小和颜色。
这种功能可以帮助交易者直观地了解当天市场中的K线数量以及K线的序号变化,辅助分析市场的走势和节奏。

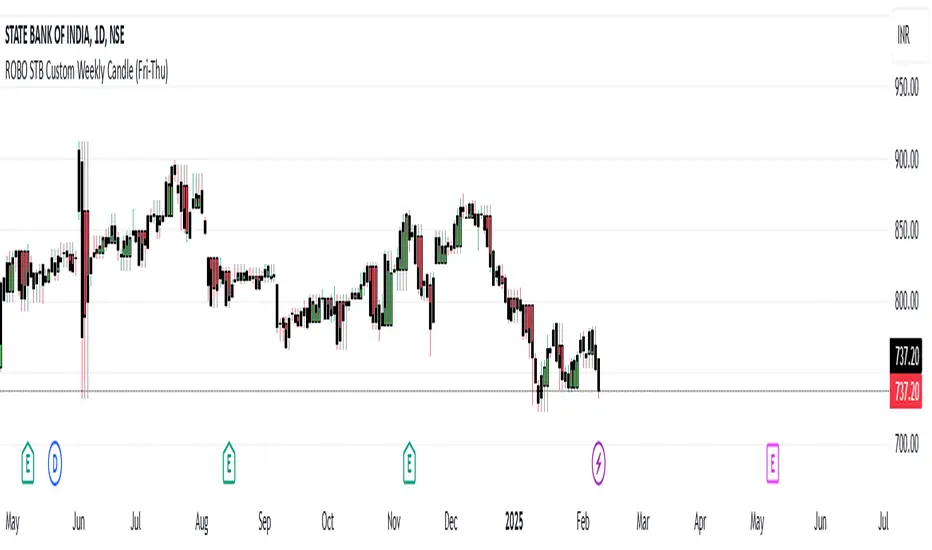
ROBO STB Custom Weekly Candle (Fri-Thu)Description:
This indicator creates custom weekly candles that start on Friday and end on Thursday, instead of the standard Monday–Friday weekly structure in TradingView. It aggregates the open, high, low, and close (OHLC) values from Friday to Thursday and displays them as candlesticks on the chart.
Features:
✅ Custom weekly candles from Friday to Thursday
✅ Dynamic calculation of open, high, low, and close
✅ Works on any timeframe
✅ Helps traders analyze market structure differently
How It Works:
Identifies the custom weekly session based on Friday's start and Thursday's end.
Aggregates OHLC values within this time range.
Resets the values when a new custom week begins.
Plots the calculated weekly candles on the chart.
Use Case:
This indicator is useful for traders who prefer to analyze weekly price movements based on a non-standard start and end day, especially those focusing on forex, crypto, or commodities where trading hours differ.
Notes:
This script does not modify existing candles but overlays new custom weekly candles on the chart.
It does not repaint and updates in real-time.
If you find this useful, like and share! 🚀
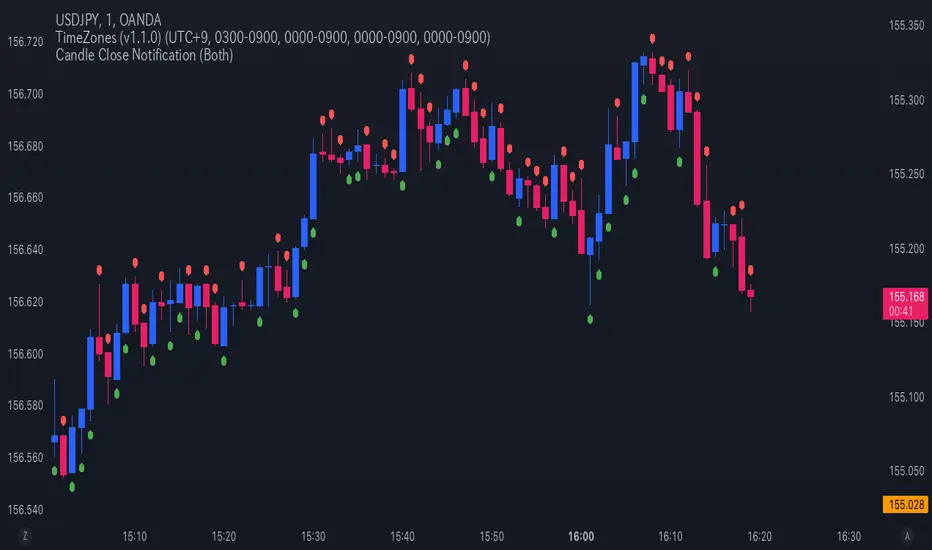
Candle Close NotificationCandle Close Notification Indicator - Specification
1. 概要 (Overview)
本インジケーターは、TradingView 上でローソク足が確定した際に、そのローソク足が陰線(Bearish)または陽線(Bullish)であった場合に通知を送信するものです。
また、該当するローソク足の上または下にマークを表示し、視覚的にも識別しやすくなっています。
This indicator for TradingView sends notifications when a candlestick closes as either a bearish (red) or bullish (green) candle. It also marks the corresponding candles on the chart for visual reference.
2. 機能 (Features)
2.1 通知機能 (Notification Function)
ローソク足の確定時に、以下の条件に基づき アラート(通知) を送信します。
「Both」(両方): 陰線・陽線のどちらでも通知
「Bearish」(陰線のみ): 陰線の時のみ通知
「Bullish」(陽線のみ): 陽線の時のみ通知
When a candlestick closes, an alert notification is sent based on the selected option:
"Both" (Default): Notifies for both bearish and bullish candles.
"Bearish": Notifies only bearish candles.
"Bullish": Notifies only bullish candles.
2.2 チャートマーク表示機能 (Chart Marking Function)
ローソク足が確定した際、以下のルールでマークを表示します。
陰線(Bearish) の場合、赤色の「下向きマーク」を表示(ローソク足の上)
陽線(Bullish) の場合、緑色の「上向きマーク」を表示(ローソク足の下)
When a candlestick closes, a marker appears according to the following rules:
Bearish candle → A red downward marker appears above the candle.
Bullish candle → A green upward marker appears below the candle.
3. 通知オプションの設定 (Setting Notification Options)
スクリプト内の notify_option の値を変更することで、通知の種類を設定できます。
Both(デフォルト) → 陰線・陽線両方通知
Bearish → 陰線のみ通知
Bullish → 陽線のみ通知
Modify the notify_option value in the script to customize notifications:
Both (Default) → Notifies for both bearish and bullish candles.
Bearish → Notifies only bearish candles.
Bullish → Notifies only bullish candles.
TradingView の アラート機能 を有効にすることで、通知を受け取ることができます。
Enable TradingView’s Alert function to receive notifications.