EngulfingThe script highlights a Bullish/Bearish Engulfing 2 candlesticks pattern on the main chart screen, and has a preset alert condition. Please use an oscillator that shows oversold and overbought conditions with this script (i.e. StochRSI oscillator).
Recherche dans les scripts pour "Candlestick"

Bullish Harami Backtest This is a bullish reversal pattern formed by two candlesticks in which a small
real body is contained within the prior session's unusually large real body.
Usually the second real body is the opposite color of the first real body.
The Harami pattern is the reverse of the Engulfing pattern.
WARNING:
- For purpose educate only
- This script to change bars colors.

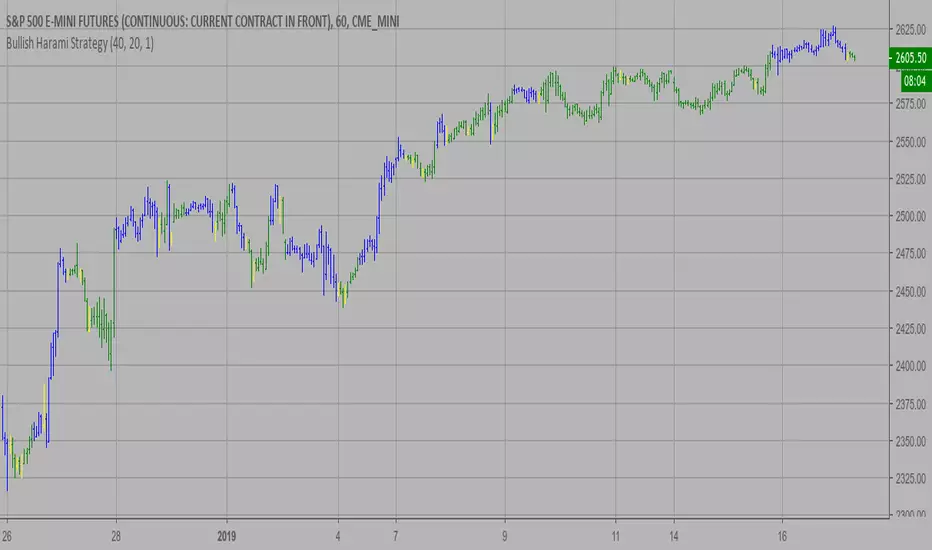
Bullish Harami Strategy This is a bullish reversal pattern formed by two candlesticks in which a small
real body is contained within the prior session's unusually large real body.
Usually the second real body is the opposite color of the first real body.
The Harami pattern is the reverse of the Engulfing pattern.
WARNING:
- This script to change bars colors.
Bearish Harami Backtest This is a bearish reversal pattern formed by two candlesticks in which a short
real body is contained within the prior session's long real body. Usually the
second real body is the opposite color of the first real body. The Harami pattern
is the reverse of the Engulfing pattern.
WARNING:
- For purpose educate only
- This script to change bars colors.

MA CandlesOHLC calculated with a moving average.
You can replace sma with anything. EMA, Hull, sma(sma(sma(sma(close, etc.
You could also make it look clean like Heikin Ashi candlesticks if you include min/max for low/high wicks on candles.

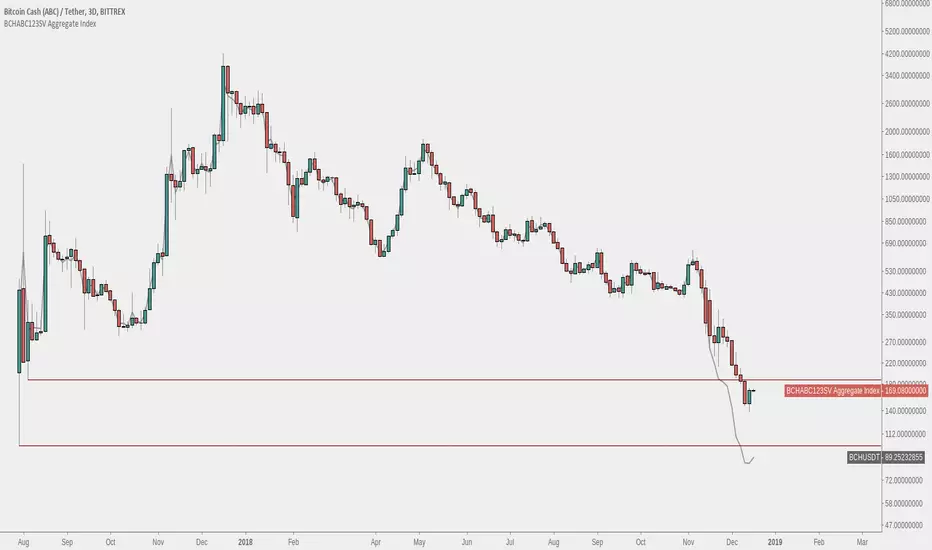
Bitcoin Cash - BCHABCSV Aggregate IndexAn index of both Bitcoin Cash ABC pre-fork and Bitcoin Cash ABC + Bitcoin Cash SV post-fork.
The pre-fork BCH used is from Bittrex, and Binance is used for ABC and SV afterwards.
Option to choose USDT or BTC pairing.
Instructions:
1. Load up a BCH chart from Bittrex, ex. 'BITTREX:BCHABCUSDT' or 'BITTREX:BCHSVBTC' for full chart history
2. Hide original candlesticks
3. Right click the price scale and untick 'Scale Price Chart Only'
Bithumb Ticker USD/BTC PairConverts Bithumb tickers into USD or bitcoin pairings from KRW.
This currently uses the FX pair to convert. There is an option to toggle between candlesticks and line.


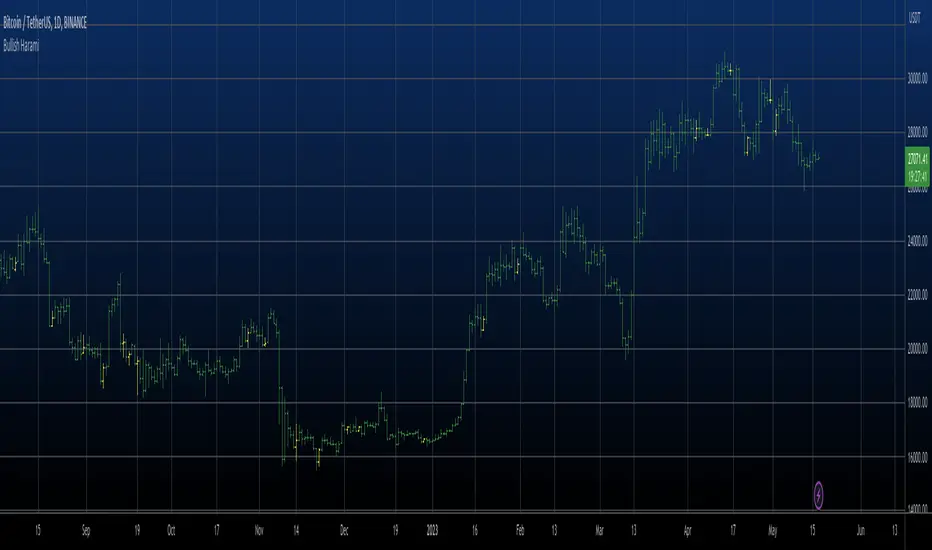
Bullish Harami automatic finding script Hi
Let me introduce my Bullish Harami automatic finding script.
This is a bullish reversal pattern formed by two candlesticks in which a small
real body is contained within the prior session's unusually large real body.
Usually the second real body is the opposite color of the first real body.
The Harami pattern is the reverse of the Engulfing pattern.
This pattern marked as yellow.
Market Structure [BOS/ChoCh Line & Bar-Chart]Overview
A comprehensive market structure indicator that identifies Break of Structure (BOS) and Change of Character (CHoCH) patterns - essential concepts in Smart Money trading methodology.
━━━━━━━━━━━━━━━━━━━━━━━━━━━━━━━━━━━━━━━━
🔹 KEY FEATURES
Two detection modes: Swing-based (High/Low) and Line Chart-based (Close)
Automatic HH/LL/LH/HL labeling with price and percentage change
BOS (Break of Structure) for trend continuation
CHoCH (Change of Character) for trend reversals
Market Structure Candle Coloring (MSC)
Optional Line Chart overlay
Fully customizable colors and display options
Built-in alerts for BOS and CHoCH events
━━━━━━━━━━━━━━━━━━━━━━━━━━━━━━━━━━━━━━━━
🔹 DETECTION MODES
Swings Mode
Uses candlestick highs and lows to identify swing points. This is the traditional approach and works well for most trading styles.
Line Chart Mode
Uses closing prices only to identify peaks and troughs - similar to how a line chart displays price action. This mode filters out wicks and can provide cleaner structure identification.
━━━━━━━━━━━━━━━━━━━━━━━━━━━━━━━━━━━━━━━━
🔹 STRUCTURE LABELS
HH (Higher High) - Price made a new high above the previous high → Bullish
HL (Higher Low) - Price made a higher low → Bullish
LH (Lower High) - Price failed to make a new high → Bearish
LL (Lower Low) - Price made a new low below the previous low → Bearish
━━━━━━━━━━━━━━━━━━━━━━━━━━━━━━━━━━━━━━━━
🔹 BOS vs CHoCH
BOS (Break of Structure)
A continuation signal. Occurs when price breaks a key level in the direction of the current trend.
Bullish BOS: Price closes above the last swing high during an uptrend
Bearish BOS: Price closes below the last swing low during a downtrend
CHoCH (Change of Character)
A reversal signal. Occurs when price breaks the key level that would invalidate the current trend.
Bullish CHoCH: During a downtrend, price closes above the high that produced the last Lower Low
Bearish CHoCH: During an uptrend, price closes below the low that produced the last Higher High
━━━━━━━━━━━━━━━━━━━━━━━━━━━━━━━━━━━━━━━━
🔹 CANDLE COLORING (MSC)
When enabled, candles are colored based on the current market structure trend:
Bullish trend: Candles colored in the bullish color
Bearish trend: Candles colored in the bearish color
Trend-conforming candles appear solid, counter-trend candles appear faded
Note: For best results, go to Chart Settings → Symbol and set Body/Border/Wick colors to transparent.
━━━━━━━━━━━━━━━━━━━━━━━━━━━━━━━━━━━━━━━━
🔹 SETTINGS
Market Structure Settings
Detection Mode - Choose between Swings or Line Chart
Swing Length - Sensitivity of pivot detection (higher = less sensitive)
Show BOS / Show CHoCH - Toggle display of each pattern type
Line Chart Display
Show Line Chart - Display the close-based line overlay
Line Chart Color / Width - Customize appearance
Labels & Extra Data
Show HH/LL/LH/HL Labels - Toggle swing point labels
Show Price at Pivots - Display price values
Show % Change - Display percentage change between swings
━━━━━━━━━━━━━━━━━━━━━━━━━━━━━━━━━━━━━━━━
🔹 ALERTS
The indicator includes alerts for:
Bullish/Bearish BOS
Bullish/Bearish CHoCH
━━━━━━━━━━━━━━━━━━━━━━━━━━━━━━━━━━━━━━━━
🔹 USAGE TIPS
Use higher Swing Length values on higher timeframes to filter noise
CHoCH signals potential trend reversals - consider waiting for confirmation
BOS signals trend continuation - can be used for entries in the trend direction
Combine with other confluence factors like support/resistance, order blocks, or volume analysis
The Line Chart mode can help identify structure on volatile instruments where wicks create noise
For best display of bar coloring set Visual Order -> Bring to Front

Wavelet Candlestick Slope Follower-Master Edition Here is a short description of this script:
This is a **Trend Following strategy** that utilizes advanced mathematics—the **Wavelet Transform**—to filter out market noise.
**Key Features:**
1. **Synthetic Candles:** The script does not analyze raw prices. Instead, it constructs "Wavelet Candles"—smoothed candles created through mathematical convolution of prices with a specific wavelet "kernel" (e.g., Mexican Hat, Morlet, Haar).
2. **Auto-Correction (Normalization):** This is the most critical technical feature of this code. The script automatically normalizes the weights. This ensures that even when using complex mathematical shapes (like the Mexican Hat), the output price remains accurate to the real chart scale and is not distorted.
3. **Strategy Logic:** The logic is very straightforward—the system enters a **Long** position when the smoothed closing price (`w_close`) is rising, and closes the position when it starts to fall.
4. **Visualization:** It draws new, cleaner candles (green/red) on the chart, revealing the "true" trend structure after filtering out temporary fluctuations.
This is a example of use idea of wavelet candle

ETIQUETAS DE ANCLAJE.INTERVALO 9:00 AM/4.15PMThis indicator displays labels on the candlestick that range from 9:00 am to 4:15 pm, with 5-minute intervals, indicating the 5M periods on the chart.


Reversal Buy and Sell SignalsThis indicator is fast and minimalistic reversal-detection indicator designed to capture high-probability turning points in the market. It combines engulfing candlestick patterns, a strong candle body filter, and RSI momentum analysis to generate precise BUY and SELL signals with minimal noise.

CVD Candle Divergence IndicatorThis indicator identifies potential reversal points by comparing the direction of price candles with the direction of cumulative volume delta (CVD) candles, while applying additional filters based on RSI behavior, volume strength, and candlestick wick structure.
It aims to highlight situations where price movement and volume delta disagree, which can signal fading momentum or absorption.
Core Concept
The script combines several independent conditions that must occur simultaneously before a signal is displayed on the chart. A signal appears only when all filters agree, reducing the number of low-quality or noise-based setups.
1. CVD Candle Direction
The indicator uses TradingView’s built-in function for volume delta candles. These candles summarize buying and selling aggression derived from lower-timeframe volume.
A CVD green candle indicates more buyer-initiated volume.
A CVD red candle indicates more seller-initiated volume.
The script looks for instances where price and CVD candles disagree:
Bullish signal: price candle is green while CVD candle is red
Bearish signal: price candle is red while CVD candle is green
This creates a form of divergence using volume delta instead of price highs and lows.
2. RSI Context Filter
Momentum is evaluated through RSI. Instead of relying only on standard overbought/oversold levels, the script also includes a recency filter based on the RSI midline (50 level).
RSI Threshold
Users can specify the RSI value required for bullish and bearish conditions.
Recency Filter
The indicator only allows signals if RSI has crossed the 50 level within a user-defined number of bars. This prevents signals during extended one-directional trends where divergence is less meaningful.
3. Volume Strength Filter
Signals are filtered through a volume-based requirement:
Current volume must exceed a moving average of volume multiplied by a user-defined factor.
This ensures that signals appear only during periods with sufficient participation and reduces noise during low-volume consolidation.
4. Wick-to-Body Ratio Filter
To incorporate price-action characteristics, the script evaluates the wick structure of each candle:
Bullish signals require a sufficiently large lower wick relative to the total candle range.
Bearish signals require a sufficiently large upper wick relative to the total candle range.
The wick percentage is fully configurable.
This adds a rejection or absorption component to the logic and prevents signals on weak or indecisive candles.
Signal Conditions
A bullish signal appears when all of the following are true:
Price candle is green
RSI is below the bullish threshold
CVD candle is red
Volume is above its threshold (if enabled)
RSI has interacted with the 50 level recently
Lower wick meets the wick-percentage requirement
A bearish signal requires the opposite conditions:
Price candle is red
RSI is above the bearish threshold
CVD candle is green
Volume is above its threshold (if enabled)
RSI recently interacted with the 50 level
Upper wick meets the wick-percentage requirement
Signals appear as arrows directly on the chart.
Use Cases
This indicator is intended for traders who work with:
Momentum shifts
Volume delta analysis
Candle structure-based confirmation
Reversal or exhaustion setups
Divergence concepts beyond price highs/lows
It does not predict market direction. Instead, it highlights areas where multiple conditions suggest a potential imbalance between price movement and volume delta.
I would strongly suggest to use this indicator only on timeframes 2-15m.
Here are a few examples:

aPraJaiThis indicator Overlays Heikin Ashi Candles over the normal Candlestick pattern for you to be able to view both candle types simultaneously.

Structure Analysis + Hammer Alert# Structure Resistance + Hammer Alert
## 📊 Indicator Overview
This indicator integrates Structure Breakout Analysis with Candlestick Pattern Recognition, helping traders identify market trend reversal points and strong momentum signals. Through visual markers and background colors, you can quickly grasp the bullish/bearish market structure.
---
## 🎯 Core Features
### 1️⃣ Structure Resistance System
- Auto-plot Previous High/Low: Automatically marks key support/resistance based on pivot points
- Structure Breakout Detection: Shows "BULL" when price breaks above previous high, "BEAR" when breaking below previous low
- Trend Background Color: Green background for bullish structure, red background for bearish structure
### 2️⃣ Bullish Momentum Candles (Hammer Patterns)
Detects candles with long lower shadows, indicating strong buying pressure at lows:
- 💪Strong Bull (Bullish Hammer): Green marker, bullish close with significant lower shadow
- 💪Weak Bull (Bearish Hammer): Teal marker, bearish close but strong lower shadow
### 3️⃣ Bearish Momentum Candles (Inverted Hammer/Shooting Star)
Detects candles with long upper shadows, indicating strong selling pressure at highs:
- 💪Weak Bear (Bullish Inverted Hammer): Orange marker, bullish close but significant upper shadow
- 💪Strong Bear (Shooting Star): Red marker, bearish close with significant upper shadow
### 4️⃣ Smart Marker Sizing
Markers automatically adjust size based on current trend:
- With-Trend Signals: Larger markers (e.g., hammer in bullish trend)
- Counter-Trend Signals: Smaller markers (e.g., shooting star in bullish trend)
- Neutral Trend: Medium-sized markers
---
## ⚙️ Parameter Settings
### Structure Resistance Parameters
- Swing Length: Default 5, higher values = clearer structure but fewer signals
- Show Lines/Labels: Toggle on/off options
### Bullish Momentum (Hammer) Parameters
- Lower Shadow/Body Ratio: Default 2.0, lower shadow must be 2x body size
- Upper Shadow/Body Ratio Limit: Default 0.2, upper shadow cannot be too long
- Body Position Ratio: Default 2.0, ensures body is at the top of candle
### Bearish Momentum (Inverted Hammer) Parameters
- Upper Shadow/Body Ratio: Default 2.0, upper shadow must be 2x body size
- Lower Shadow/Body Ratio Limit: Default 0.2, lower shadow cannot be too long
- Body Position Ratio: Default 2.0, ensures body is at the bottom of candle
### Filter & Display Settings
- Minimum Body Size: Filters out doji-like candles with tiny bodies
- Pattern Type Toggles: Show/hide different pattern types individually
- Background Transparency: Adjust background color intensity (higher = more transparent)
- Label Distance: Adjust marker distance from candles
---
## 📈 Usage Guidelines
### Trading Signal Interpretation
**Long Signals (Strongest to Weakest):**
1. Bullish Structure + Bullish Hammer (💪Strong Bull) → Strongest long signal
2. Bullish Structure + Bearish Hammer (💪Weak Bull) → Secondary long signal
3. Bearish Structure + Hammer → Potential reversal signal
**Short Signals (Strongest to Weakest):**
1. Bearish Structure + Shooting Star (💪Strong Bear) → Strongest short signal
2. Bearish Structure + Bullish Inverted Hammer (💪Weak Bear) → Secondary short signal
3. Bullish Structure + Shooting Star → Potential reversal signal
### Practical Tips
✅ Trend Following: Prioritize large marker signals (aligned with trend)
✅ Structure Confirmation: Wait for structure breakout before entry to avoid false breaks
✅ Multiple Timeframes: Confirm trend direction with higher timeframes
⚠️ Counter-Trend Caution: Small marker signals (counter-trend) require stricter risk management
---
## 🔔 Alert Setup
This indicator provides 9 alert conditions:
- Individual Patterns: Bullish Hammer, Bearish Hammer, Bullish Inverted Hammer, Shooting Star
- Combined Signals: Bullish Momentum, Bearish Momentum, Bull/Bear Momentum
- Structure Breakouts: Bullish Structure Break, Bearish Structure Break
---
## 💡 FAQ
**Q: Why do hammers sometimes appear without markers?**
A: Check "Minimum Body Size" setting - the candle body may be too small and filtered out
**Q: Too many or too few markers?**
A: Adjust "Lower Shadow/Body Ratio" or "Upper Shadow/Body Ratio" parameters - higher ratios = stricter conditions
**Q: How to see only the strongest signals?**
A: Disable "Bearish Hammer" and "Bullish Inverted Hammer", keep only "Bullish Hammer" and "Shooting Star"
**Q: Can it be used on all timeframes?**
A: Yes, but recommended for 15-minute and higher timeframes - shorter timeframes have more noise
---
## 📝 Disclaimer
⚠️ This indicator is a supplementary tool and should be used with other technical analysis methods
⚠️ Past performance does not guarantee future results - always practice proper risk management
⚠️ Recommended to test on demo account before live trading
---
**Version:** Pine Script v6
**Applicable Markets:** Stocks, Futures, Cryptocurrencies, and all markets

HTF Entry Model+ [#] by @shulktradesHTF Entry Model+ by @shulktrades
Overview
The HTF Entry Model+ is a multi-timeframe trading indicator that identifies algorithmic signatures in price action and automatically displays complete entry setups with risk-to-reward projections. When specific order flow patterns are detected on a higher timeframe, the indicator calculates and displays entry zones, stop loss placement, and multiple profit targets - giving traders a complete trade plan before price reaches the entry level.
What This Indicator Does
Identifies Algorithmic Price Patterns
The indicator monitors a higher timeframe to detect specific signatures in price action that signal potential reversals or continuations. These patterns represent moments when institutional order flow creates measurable shifts in market dynamics.
Key Points:
- Analyzes higher timeframe price structure continuously
- Detects order flow signatures that precede directional moves
- Confirms patterns only when specific conditions are met
- Filters out low-quality signals automatically
Projects Complete Entry Models
When a valid pattern is detected, the indicator immediately calculates and displays a full trade setup with all necessary levels clearly marked on your chart.
What Gets Displayed:
- Entry zone (optimal price area to enter the trade)
- Stop loss level (where to exit if wrong)
- Multiple profit targets (1:1, 1:2, 1:3, 1:4, 1:5, 1:6, 1:7)
- OTE levels (Optimal Trade Entry zone & OTE + take profit model)
- Risk-reward ratios for each target
Adapts to Your Timeframe
The indicator intelligently selects an appropriate higher timeframe based on your current chart, or you can manually choose which timeframe to analyze.
Timeframe Relationships:
- 1-5 minute charts → analyzes 15-60 minute structure
- 15-30 minute charts → analyzes 4-hour structure
- 1 hour charts → analyzes daily structure
- 4 hour charts → analyzes weekly structure
- Daily charts → analyzes monthly structure
How Traders Use This Indicator
Step 1: Wait for Setup Detection
The indicator runs in the background, continuously scanning the higher timeframe for algorithmic signatures. When detected, a horizontal marker appears at the pattern formation level.
Step 2: Review the Entry Model
Once confirmed, the complete risk-reward projection displays instantly:
- All entry and exit levels are clearly labeled
- Stop loss shows exactly where the setup invalidates
- Multiple targets allow for systematic profit-taking
- Color coding shows bullish (green) or bearish (red) direction
Step 3: Plan Your Trade
Before price retraces to the entry zone, you have complete information:
- Know your exact entry price levels
- Know your exact stop loss placement
- Know multiple profit target levels
- Calculate position size based on the risk shown
Step 4: Execute When Price Returns
Wait for price to retrace back into the entry zone (OTE levels), then execute your trade with predefined parameters.
Step 5: Manage According to the Model
Use the displayed targets to manage your position:
- Scale out partial profits at each target level
- Move stops to breakeven after first or second target
- Let remaining position run toward extended targets
Key Features
Smart Pattern Recognition
- Detects specific algorithmic signatures that precede high-probability moves
- Validates patterns using proprietary order flow analysis
- Filters signals based on market structure quality
- Reduces false signals in choppy or ranging conditions
Complete Risk-Reward Framework
- Entry zones marked with "OTE" labels at optimal prices
- Stop loss clearly labeled at pattern invalidation point
- Seven profit targets (1:1 through 1:7 risk-reward)
- Additional reference levels for advanced trade management
Liquidity-Based Validation
- Monitors higher timeframe liquidity dynamics
- Identifies when stops are likely being hunted
- Confirms setups that follow liquidity sweeps
- Distinguishes high-quality from lower-quality signals
Session Time Filtering
- Optional time-based filtering for entry model display
- Set specific trading hours when setups should appear
- Useful for focusing on active market sessions
- Can be disabled for swing trading or higher timeframes
Clean Visual Presentation
- Color-coded setups (green for bullish, red for bearish)
- Clearly labeled levels (Entry, Stop Loss, OTE, 1:1, 1:2, etc.)
- Minimal chart clutter - only active setups display
- All historical setups remain visible for backtesting
Configuration Options
Higher Timeframe Settings
- Auto Mode: Automatically selects optimal higher timeframe for your chart
- Fixed Mode: Manually choose any specific timeframe to analyze
- Provides flexibility for different trading strategies and preferences
Visual Customization
- Bullish Color: Choose color for long setups (default: green)
- Bearish Color: Choose color for short setups (default: red)
- Display Length: Adjust how far forward the levels project
- Clean, professional appearance on any chart theme
Time Filter Options
- Enable/Disable Toggle: Turn session filtering on or off
- Entry Timeframe: Specify exact trading hours for setup display
- Recommended Usage: Enable for day trading, disable for swing trading
- Timezone adjustable to match your market hours
Who This Indicator Is For
Day Traders & Scalpers
- Get precise entry timing on intraday timeframes
- Clear stop placement for tight risk management
- Multiple targets for scaling out positions
- Session filtering helps focus on active market hours
Seconds Timeframe
5m Timeframe
Swing Traders
- Higher timeframe analysis for multi-day positions
- Structured entry and exit planning
- Extended targets for longer-term moves
- Can disable time filtering for 24-hour analysis
Multi-Timeframe Traders
- Aligns entries across different timeframes
- Provides higher timeframe context automatically
- Helps identify confluence between timeframes
- Works on any liquid market (stocks, futures, forex, crypto)
Systematic Traders
- Pre-defined entry and exit levels before execution
- Consistent risk-reward framework on every setup
- Historical setups remain visible for backtesting
- Removes emotional decision-making from entries
Market Compatibility
Best Performance On:
- Futures contracts (ES, NQ, YM, CL, GC, etc.)
- Major forex pairs (EUR/USD, GBP/USD, USD/JPY, etc.)
- Liquid stocks and ETFs
- Major cryptocurrency pairs
Optimal Timeframes:
- 1-minute to 1-hour: Intraday trading and scalping
- 4-hour to Daily: Swing trading and position entries
- Works on higher timeframes but signals become less frequent
Market Conditions:
- Most effective in trending or impulsive markets
- Automatically filters lower-quality ranging setups
- Adapts to different volatility environments
- Functions across all market sessions
Important Information
What This Indicator Does NOT Do
- Does not predict future price movement
- Does not guarantee profitable trades
- Does not show internal calculation methods or specific detection criteria
- Does not display the pattern scanning process (only confirmed setups)
What Traders Should Understand
- This tool identifies potential setups based on candlestick order flow analysis
- All trading involves risk - use appropriate position sizing
- Combine with your own analysis and market understanding
- Proper risk management is essential regardless of signal quality
- Past setup performance does not guarantee future results
Standard Risk Management Guidelines
Position Sizing
- Risk only 1-2% of account capital per trade
- Use the displayed stop loss distance to calculate position size
- Adjust size smaller for lower-confidence setups
- Never risk more than you can afford to lose
Stop Loss Placement
- Always honor the displayed stop loss level
- Place stops at or slightly beyond the marked level
- Do not move stops further away if trade moves against you
- Accept the loss if stop is hit and wait for next setup
Profit Taking Strategy
- Consider scaling out at multiple target levels
- Take some profit at 1:1 to reduce risk to zero
- Let remaining position run toward extended targets
- Move stops to breakeven after first target is hit
Additional Considerations
- Be aware of overall market trend direction
- Reduce position size during uncertain market conditions
- Keep detailed records of trades taken from indicator setups
Important Trading Considerations
Price Action Variability
It is important to note that market conditions vary and price does not always retrace into the displayed entry zones. In certain market environments, particularly during strong impulsive moves or high-impact news events, price may move directly toward the projected targets without providing an opportunity to enter at the optimal entry levels. Traders should be prepared to either wait for proper entry conditions or adjust their strategy accordingly based on their risk tolerance and trading plan.
Disclaimer
Educational Purpose Only
This indicator is provided solely for educational and informational purposes. It is designed to assist traders in analyzing market structure and identifying potential trading opportunities based on technical analysis principles. The indicator does not constitute financial advice, investment advice, trading advice, or any other type of professional advice.
No Guarantee of Results
Past performance of signals and setups identified by this indicator does not guarantee future results. All trading and investing involves substantial risk of loss, and you may lose some or all of your invested capital. No representation is being made that any account will or is likely to achieve profits or losses similar to those shown or discussed.
Personal Responsibility
Users of this indicator are solely responsible for their own trading decisions and any resulting outcomes. You should conduct your own research, analysis, and due diligence before making any trading or investment decisions. Always consult with a qualified financial advisor before making investment decisions if you are uncertain about your financial situation.
Risk Warning
Trading futures, forex, stocks, and cryptocurrencies carries a high level of risk and may not be suitable for all investors. The high degree of leverage can work against you as well as for you. Before deciding to trade, you should carefully consider your investment objectives, level of experience, and risk appetite. Only trade with money you can afford to lose.
No Warranty
This indicator is provided "as is" without warranty of any kind, either expressed or implied. The developer makes no guarantees about the accuracy, reliability, completeness, or timeliness of the information, signals, or projections provided by this indicator.
---
This indicator represents proprietary research into algorithmic price behavior and order flow dynamics. The methodology is protected to preserve the effectiveness of the approach and maintain the integrity of the analysis framework.

Hammer Model [#]Hammer Model - HTF Candle Entry Model
Overview
The Hammer Model is a sophisticated technical indicator that identifies high-probability reversal setups based on Higher Timeframe (HTF) candlestick wick rejection patterns. Unlike traditional hammer pattern indicators that simply flag candle formations, this system provides a complete trading framework with precise entry zones, stop loss placement, and multiple take profit targets calculated using statistical projections.
What Makes This Different
Proprietary Signal Filtering: This indicator uses a proprietary algorithm that analyzes multiple market structure conditions to filter out low-quality hammer patterns. Only the highest-probability setups are displayed, significantly reducing false signals compared to standard pattern recognition tools.
Dynamic Quadrant Mapping: Rather than basic support/resistance levels, the system divides each qualified hammer candle into three distinct zones (Upper Wick, Body, and Lower Wick), with precise .25, .5, and .75 subdivision levels for granular entry and exit planning.
Multi-Standard Deviation Projections: The indicator automatically calculates TP1 and TP2 targets based on the wick's range, along with optional 1-4 standard deviation extension levels for position scaling and profit maximization.
How It Works
Signal Generation @ Candle Close/New Candle Open
The indicator monitors your chart for HTF candles that meet specific criteria:
Bullish Hammer: Lower wick must be significantly larger than the body
Bearish Hammer: Upper wick must be significantly larger than the body
When both wicks qualify, the indicator selects the larger wick as the primary signal, depending on conditions set.
Visual Components
Bullish Setups:
SL: Stop loss level (below lower wick)
ENTRY: Entry zone (candle body range)
.25/.5/.25: Wick quadrant levels for scaling entries
TP1/TP2: First and second take profit targets
1-4STDV: Advanced/Long Range Targets
Bearish Setups:
SL: Stop loss level (above upper wick)
ENTRY: Entry zone (candle body range)
.25/.5/.25: Wick quadrant levels for scaling entries
TP1/TP2: First and second take profit targets
1-4STDV: Advanced/Long Range Targets
HTF Candle Overlay (Optional):
Displays the actual HTF candle that generated the signal
Shows Open, High, Low, and Close lines for context
Trading the Signals
For Bullish Hammers (Long):
Entry is @ HTF Candle Close / New HTF Candle Open (or wait for a .25-.5 wick retrace)
Place stop loss at or 1 tick below the SL level (lower wick low)
Target TP1 (1x wick range above) and TP2 (2x wick range above) and STDV
Use .25/.5/.25 levels to scale into positions or manage partial exits
For Bearish Hammers (Short):
Entry is @ HTF Candle Close / New HTF Candle Open (or wait for a .25-.5 wick retrace)
Place stop loss at or above the SL level (upper wick high)
Target TP1 (1x wick range below) and TP2 (2x wick range below) and STDV
Use .25/.5/.25 levels to scale into positions or manage partial exits
Key Settings
Hammer Model Conditions
Bullish/Bearish: Toggle which direction setups to display
1-2STDV / 3-4STDV: Show extended projection levels
HTF Liquidity Sweep: Filter for setups that swept previous HTF highs/lows (proprietary)
Wick Size: Require larger wick-to-body ratio (1.75x vs 1x)
Time Filters: Isolate setups during specific trading sessions (NY AM/PM, Asia, London)
Hourly Filters: Target setups that form during specific hour segments (useful for lower timeframes)
Display Options
Show Recent Hammer Models: Limit how many setups display on chart (default: 4)
Unlimited: Show all historical setups
Candle Quadrants: Toggle .25, .5, .25 subdivision lines
HTF Candle Overlay: Display the actual HTF candle that generated the signal
Timeframes
1min chart → 15min HTF (scalping)
5min chart → 1H HTF (day trading)
15min chart → 4H HTF (swing trading)
1H chart → Daily HTF (position trading)
The indicator automatically selects appropriate HTF pairs
Why Closed Source
This indicator is closed source to protect proprietary filtering algorithms that determine which hammer patterns qualify as valid signals. These filters analyze specific market structure conditions, liquidity dynamics, and statistical thresholds that have been developed through extensive backtesting, data logging over 1 years time, and represent the core intellectual property of this system. The filtering methodology is what separates this from basic pattern recognition tools and delivers higher-probability setups. To learn how to learn more about this system see Author Notes.
Best Practices
Confluence: Use this indicator alongside trend analysis, key support/resistance levels, or volume profiles
Risk Management: The SL levels provide clear invalidation points - always honor them
Scaling: Use the quadrant levels (.25/.5/.25) to scale into positions rather than entering full size at once
Session Filters: Enable time filters to focus on setups during high-liquidity sessions
Backtesting: Review historical signals on your preferred instruments to understand typical behavior and win rates
Notes
The indicator displays a table in the top-right showing the current chart timeframe and HTF being analyzed
Only charts with sufficient historical data will display all past signals
The "Unlimited" option may cause performance issues on very low timeframes with extensive history
Disclaimer: This indicator is a tool for technical analysis and risk management education and does not guarantee profitable trades. Always practice proper risk management and position sizing. Past performance does not indicate future results

Pivot Reversal Signals - Multi ConfirmationPivot Reversal Signals - Multi-Confirmation System
Overview
A comprehensive reversal detection indicator designed for daytraders that combines six independent technical signals to identify high-probability pivot points. The indicator uses a scoring system to classify signal strength as Weak, Medium, or Strong based on the number of confirmations present.
How It Works
The indicator monitors six key reversal signals simultaneously:
1. RSI Divergence - Detects when price makes new highs/lows but RSI shows weakening momentum
2. MACD Divergence - Identifies divergence between price action and MACD histogram
3. Key Level Touch - Confirms price is at significant support/resistance (previous day high/low, premarket high/low, VWAP, 50 SMA)
4. Reversal Candlestick Patterns - Recognizes bullish/bearish engulfing, hammers, and shooting stars
5. Moving Average Confluence - Validates bounces/rejections at stacked moving averages (9/20/50)
6. Volume Spike - Confirms increased participation (default: 1.5x average volume)
Signal Strength Classification
• Weak (3/6 confirmations) - Small circles for situational awareness only
• Medium (4/6 confirmations) - Regular triangles, viable entry signals
• Strong (5-6/6 confirmations) - Large triangles with background highlight, highest probability setups
Visual Features
• Entry Signals: Green triangles (up) for long entries, red triangles (down) for short entries
• Exit Warnings: Orange X markers when opposing signals appear
• Signal Labels: Show confirmation score (e.g., "5/6") and strength level
• Key Levels Displayed:
o Previous Day High/Low - Solid green/red lines (uses actual daily data)
o Premarket High/Low - Blue/orange circles (4:00 AM - 9:30 AM EST)
o VWAP - Purple line
o Moving Averages - 9 EMA (blue), 20 EMA (orange), 50 SMA (red)
• Background Tinting: Subtle color on strongest reversal zones
Key Level Detection
The indicator uses request.security() to accurately fetch previous day's high/low from daily timeframe data, ensuring precise level placement. Premarket high/low levels are dynamically tracked during premarket sessions (4:00 AM - 9:30 AM EST) and plotted throughout the trading day, providing critical support/resistance zones that often influence price action during regular hours.
Customizable Parameters
• Signal strength thresholds (adjust required confirmations)
• RSI settings (length, overbought/oversold levels)
• MACD parameters (fast/slow/signal lengths)
• Moving average periods
• Volume spike multiplier
• Toggle individual display elements (levels, MAs, labels)
Best Practices
• Use on 5-minute charts for entries, confirm on 15-minute for direction
• Focus on Medium and Strong signals; Weak signals provide context only
• Strong signals (5-6 confirmations) have the highest win rate
• Pay special attention to reversals at premarket high/low - these levels frequently hold
• Previous day high/low often acts as major support/resistance
• Always use proper risk management and stop losses
• Works best in moderately trending markets
Alert Capabilities
Set custom alerts for:
• Strong long/short signals
• All entry signals (medium + strong)
• Exit warnings for open positions
Ideal For
• Daytraders and scalpers (especially SPY, QQQ, and liquid equities)
• Swing traders seeking precise entries
• Traders who prefer confirmation-based systems
• Anyone looking to reduce false signals with multi-factor validation
• Traders who utilize premarket levels in their strategy
Technical Notes
• Uses Pine Script v6
• Premarket hours: 4:00 AM - 9:30 AM EST
• Previous day levels pulled from daily timeframe for accuracy
• Maximum 500 labels to maintain chart performance
• All key levels update dynamically in real-time
________________________________________
Note: This indicator provides signal analysis only and should be used as part of a complete trading strategy. Past performance does not guarantee future results. Always practice proper risk management.

CVD – Visible Range Candles & Line (Cumulative Delta Volume)Disclaimer:
This indicator is provided for informational and educational purposes only. It does not constitute investment advice, trading advice, or a recommendation to buy or sell any financial instrument. The author assumes no liability for any losses, damages, or errors arising from use or misuse of this script. Please test thoroughly and use at your own risk.
________________________________________________________________________________
Purpose
This indicator provides a fast and clear visualization of Cumulative Delta Volume (CVD) for the currently visible chart range in TradingView. It helps traders identify buy/sell volume pressure and market sentiment over any custom timeframe, with full control over reset intervals and chart style.
Key Features
CVD by Visible Bars: Dynamically calculates CVD only for bars currently visible on the chart, so scrolling and zooming always rescale the line and candles to your view.
Style Selection: Choose line or candlestick display. Candles include both standard OHLC and optional Heikin Ashi smoothing.
Automatic Resets: Restart CVD accumulation at the beginning of every day, week, month, or quarter. Choose ‘None’ for ongoing accumulation.
Fully Custom Colors: Line color, candle body, wick, border – all optimized for clarity and customizable via the indicator’s Style tab.
Autoscale Support: Always fits your timeframe. No need to adjust scale manually.
Zero-Level Reference: Includes a horizontal zero line for quick reversal detection.
Input Parameters
Style: "Line" or "Candles" – controls visual type
Heikin Ashi candles: Enable smoothing for candle view
Show Line: Toggle CVD line visibility
Reset CVD: Options: None, Daily, Weekly, Monthly, Quarterly
How To Use
Add the indicator to your TradingView chart.
Select your preferred visual style (Line or Candles).
Choose reset frequency based on your trading timeframe.
Customize colors in the Style tab (line, candle up/down, wick, border).
Scroll or zoom on the chart – the indicator’s range always fits the currently visible bars.
Typical Use Cases
Intraday traders tracking open/close session volume delta
Swing traders identifying quarterly or monthly market accumulations
Visualizing buy/sell pressure divergence at reversal points
Comparing volume sentiment across flexible chart intervals
Formula
Delta calculation: Delta=volume×(sign(close−open))
Accumulation: Resets at user-chosen intervals, CVD plotted for only visible bars
Author
Created by Ronen Cohen

Day-Type Detector — Rejection / FNL / Outside / StopRun (Clean)Day-Type Detector — Rejection / FNL / Outside / Stop-Run (Clean Version)
This indicator identifies four high-impact candlestick day-types commonly used in professional price-action and auction-market trading: Rejection Days, Failed New Low (FNL) Days, Outside Days, and Stop-Run Days. These patterns often precede major directional moves, reversals, and absorption events, making them particularly valuable for swing traders, positional traders, and short-term discretionary traders.
The script is designed to work across all timeframes and is built around volatility-adjusted measurements using Average Daily Range (ADR) for accuracy and consistency.
What This Indicator Detects
1. Rejection Day (Bullish & Bearish)
A Rejection Day is a wide-range bar that rejects a previous extreme.
The indicator identifies rejection based on:
Range > ADR × threshold
Long lower wick (for bullish) or long upper wick (for bearish)
Close located in the strong zone of the day’s range
These conditions highlight areas where aggressive counter-orderflow entered the market.
2. Failed New Low (FNL) / Failed New High
An FNL day traps traders who attempted breakout selling or buying.
The indicator checks for:
A break beyond the previous session’s low or high
Immediate rejection back inside
Midpoint recapture conditions
ADR-normalized range requirements
These days often trigger powerful directional reversals.
3. Outside Day (Bullish & Bearish)
An Outside Day is a statistically significant expansion day that breaks both the previous high and low.
The script validates:
High > previous high and low < previous low
Range > ADR threshold
Close beyond prior session extreme to complete the rejection sequence
Outside Days often represent stop runs, shakeouts, or trend accelerations.
4. Stop-Run Day (Bullish & Bearish)
Stop-Run Days are aggressive volatility expansions and tend to be the largest ranges within short windows.
This detector identifies them using:
Range > ADR × multiplier
Close located near the extreme of the day (top for bullish, bottom for bearish)
Strong body relative to total range
Break above/below previous session extreme
These patterns indicate capitulation or forced liquidation and are often followed by continuation or sharp counter-rotation.
Key Features
✔ Historical Pattern Marking
All qualifying bars are marked on the chart using plotshape() in global scope, ensuring full historical visibility.
✔ Event Logging & Table Display
A table (top-right of the chart) displays the most recent pattern detections, including:
Timestamp
Pattern type
Bar index
This allows users to monitor and study past pattern occurrences without scanning the chart manually.
✔ ADR-Adjusted Detection
Volatility uncertainty is removed by anchoring all thresholds to ADR.
This ensures consistency across:
Different symbols
Different timeframes
Different market regimes
✔ Alerts Included
Alerts are preconfigured for:
Rejection Day Bull / Bear
FNL Bull / Bear
Outside Day Bull / Bear
Stop-Run Bull / Bear
This allows the user to receive real-time notifications when major day-type structures develop.
How to Use
Add the indicator to any timeframe chart.
Enable or disable:
Historical markers
History table
ADR diagnostics
Watch for shape markers or use alerts for real-time signals.
Use the history table to review recent occurrences.
Combine these day-types with:
Market structure levels
High/low volume nodes (LVNs)
Support/resistance zones
Trend context
These day-types are most effective when they occur near meaningful structural levels because they show where strong order-flow entered the market.
Best Practices
Use higher timeframes (1H–1D) for swing entries.
Confirm signals with market structure or volume profile.
Treat these day-types as context, not standalone signals.
Observe follow-through behavior in the next 1–3 bars after detection.
Credits
This script is based on concepts commonly seen in auction-market theory and professional price-action frameworks, such as Rejection Days, Failed New Lows, Outside Days, and Stop-Run behaviors.
All calculations and logic have been rebuilt from scratch to ensure clean, reliable, and optimized Pine Script v6 execution.

Huli (Reversal) PatternsThis indicator identifies and highlights specific candlestick patterns that commonly appear at potential reversal points in price action. The indicator scans for five distinct pattern types and visually marks them on your chart with customizable colors and optional signal shapes.
Pattern Detection:
Doji - Identifies candles with minimal body size relative to their range
Outside Bars - Detects engulfing patterns where the current bar completely contains the previous bar's range
Pin Bars - Recognizes candles with long wicks and small bodies at potential swing points
212 Pattern - Marks three-bar reversal formations with specific high/low relationships
222 Pattern - Identifies more complex three-bar reversal structures
Key Features:
Individual Pattern Controls - Enable/disable each pattern type independently
Volume Filtering - Optional volume increase requirement for each pattern (can be toggled on/off per pattern type)
Lookback Period - Adjustable lookback bars for each pattern to confirm swing highs/lows (default: 30 bars)
Visual Customization - Choose how patterns are highlighted:
Body only coloring
Body + wick coloring
Body + border coloring
Full candle coloring (body, wick, and border)
Signal Shapes - Optional arrows, triangles, diamonds, or dots to mark pattern occurrences
Custom Candle Colors - Apply custom colors to non-pattern candles for better visual organization
Pattern Priority System - When multiple patterns occur simultaneously, the indicator displays only the highest priority pattern (222 > 212 > Pin > Outside > Doji)
Configuration:
Each pattern type includes its own settings group where you can adjust colors, enable/disable volume requirements, and set lookback periods. The indicator allows for precise tuning to match your analysis preferences without cluttering the chart.
All patterns are evaluated using price structure and optionally volume, providing visual cues where multiple technical factors align. The indicator serves as a pattern recognition tool to assist in identifying areas of interest for further analysis.
