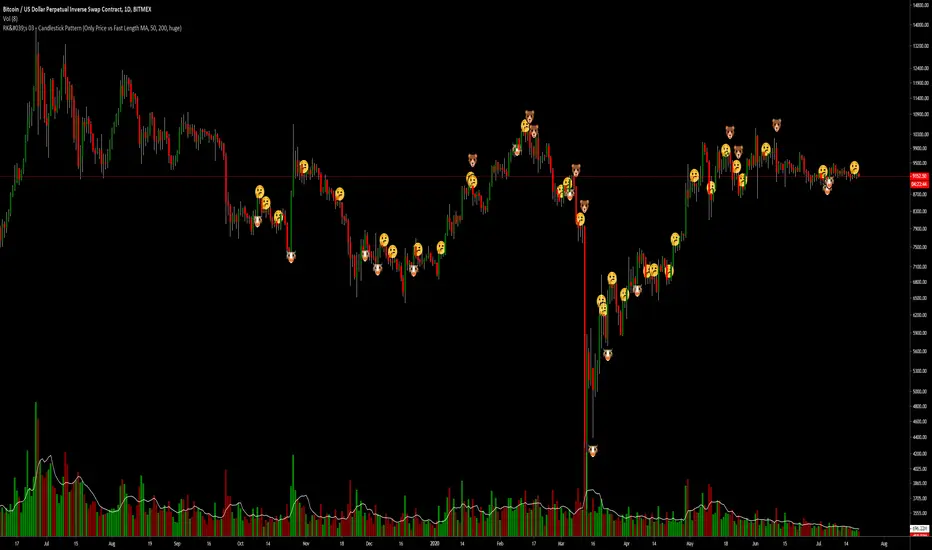
RK's 03 - Candlestick PatternThis code is just a combination of all TradingView's Candlestick Pattern.
I mix all the TV Candlestick Patterns Indicator from the TradingView in Indicator.
Recherche dans les scripts pour "Candlestick"
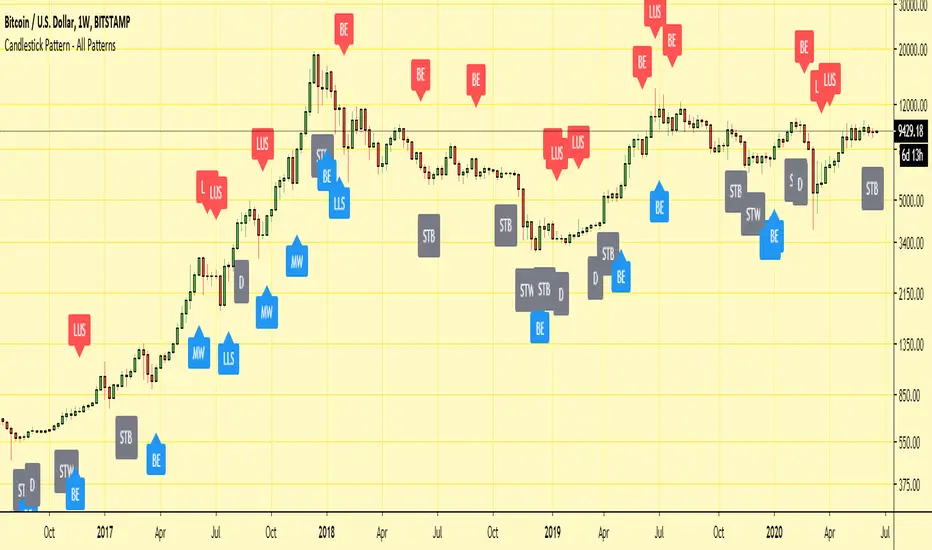
Candlestick Pattern - All PatternsHi,
Here I have collated all of the in-built TradingView candlestick patterns into one indicator.
It works on all time frames and can be useful for candlestick traders to quickly spot patterns forming on any chart.
It also allows for all individual patterns to be set up as seperate alerts within the same indicator.
Any issues/suggestions/requests let me know.
Enjoy!
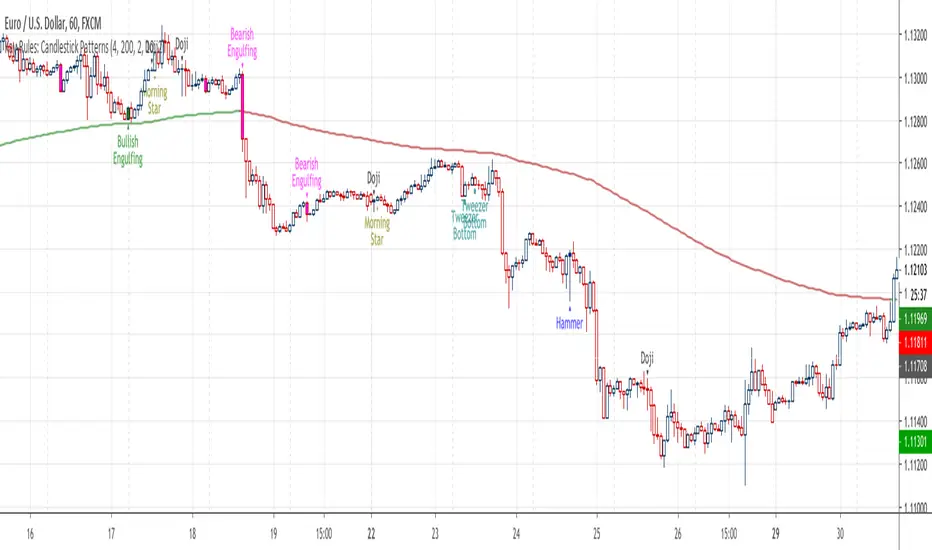
Kay-Rules: Candlestick PatternsThis indicator will mark 5 different candlestick patterns:
(1) bullish & bearish engulfing
(2) hammer & shooting star doji
(3) dragonfly & gravestone doji
(4) morning & evening star doji
(5) bottom & top tweezer
You may follow candlestick trading strategy by Rayner Teo here
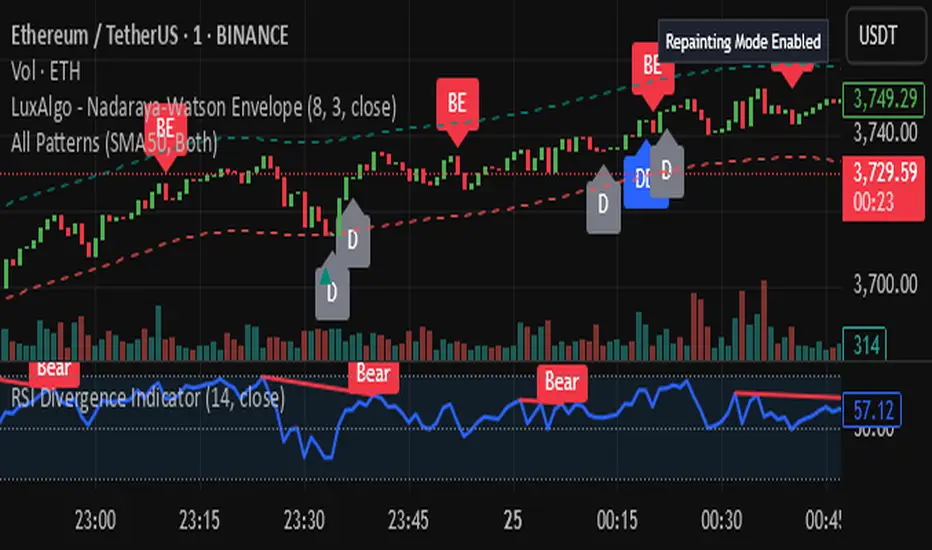
*All Candlestick Patterns*This Indicator identifies key candlestick patterns like Doji, Engulfing, and Hammer, and marks potential reversal zones. Ideal for traders focusing on price action and short-term entry points. It works well on 5min to 1hr timeframes for crypto and forex.
Weekend Filter Candlestick [odnac]Custom Candlestick Chart with Weekend Visibility Toggle
This indicator customizes the appearance of candlesticks by using a dark gray theme for better visibility.
Additionally, it provides an option to hide weekend candles, allowing traders to focus on weekday price action.
Features:
✅ Dark gray candlestick design for a clean and minimalistic look.
✅ Weekend hiding option – Users can enable or disable weekend candles with a simple toggle.
✅ Helps traders avoid weekend noise and focus on key market movements.
How to Use:
Add the indicator to your chart.
Use the "Hide Weekend Candles" setting to toggle weekend visibility.
When enabled, weekend candles will be hidden for a cleaner chart.
When disabled, all candles, including weekends, will be displayed.
This indicator is useful for traders who prefer to analyze weekday trends without unnecessary weekend fluctuations. 🚀

200 MAPD - Relative Price with candlesticks and divergenceThis is a MAPD (moving average percent difference) indicator that plots the results in candlestick format and with an option to show divergencies of a specific look back period. It's built with 200 moving average, which cannot be adjusted. A divergence is when the actual asset price moves in the opposite direction than the MAPD.
MAPD measures the percent difference of the asset price from the moving average, in this case, 200 moving average.
MAPD is my favorite indicator because it's an leading indicator, capable of predicting upcoming directions pretty accurately if you learn how to use it and how it works on your specific asset. With candlesticks instead of line you can also apply your own price action techniques.
I created this to be somewhat of a substitute for the actual price of the asset, meaning that price action analysis should be applied on this indicator and asset price is used as a secondary to spot divergencies.
The chart showing on this description is my own discretionary plotting of technical aspects. Divergencies will be enabled per default, but my preference is to have them off and plot my own analysis. And turn them on to get an overview from time to time. You can also change the look back period for the divergencies as you like.
I would say it works best from 1 hour to 1 day, maybe 1 week if you're bottom fishing in a big bear trend.
If you try it out and like it i would love to hear how you find it useful in the comments, will be helpful for me and others :)

Combine & Merge Candlesticks + EMACombine & Merge Candlesticks with EMA
You can do the following:-
1 min - look back 5 (5 min) up to 15 (15 min)
5 min - look back 3 (15 min) up to 12 (1 hour)
15 min - look back 4 (1 hour) up to 16 ( 4 hours)
1 hour - look back 4 (4 hours) up to 8 (8 hours - 1 trading session)
4 hour - look back 2 (8 hours - 1 trading session) up to 6 ( 1 Day)
1 day - look back 5 ( 1 week)

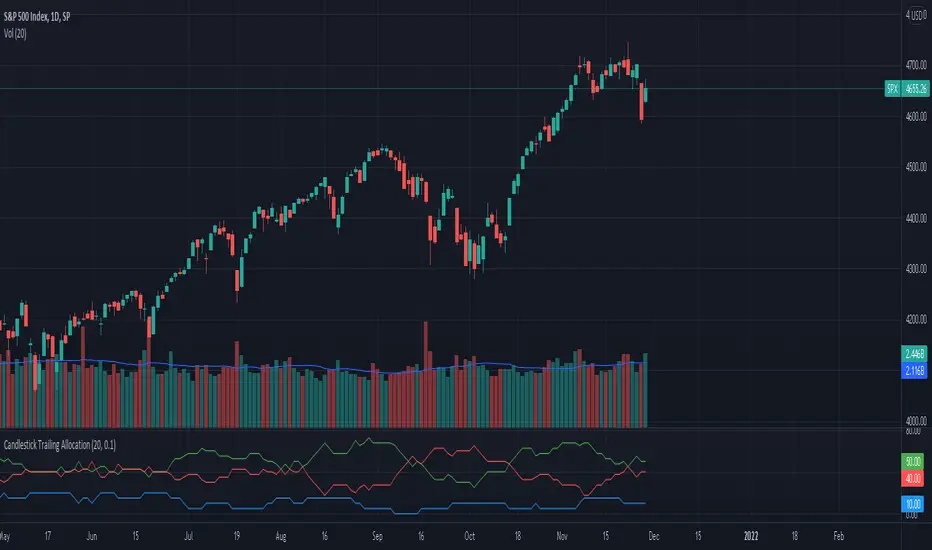
Candlestick Trailing AllocationA simple indicator that calculates the sum of 'Up'(green), 'Down'(red), and 'Doji'(near Doji) candlesticks and portrays the same in an allocation format in percentage. And since it is allocation-based, the total will never exceed 100% of the defined Length period.
The equation is Green + Red + Doji = Total Candles; where total candles = length
When calculating the allocation part, the doji candles are subtracted from the sum of green and red, and the new value is divided by the length period.
For example, the green line = (sum of all green candles - doji / 2) / length; the reason to divide doji by 2 is to eliminate the redundancy it can cause.
When the green line crosses above the red line, the number of green candles is more than red in the defined length period. Similarly, when the red line crossed above the green, there were more red candles than green in that period.
The Doji line shows if any doji or near doji candles have appeared. It acts as a form of resistance against the green and red candles.
There's also the option to change the value of the doji's weight. Default is at 0.1.
The indicator does not show trend nor momentum, even though it may replicate some of its behavior from time to time. It is purely showing the allocation of the number of candles classified as green, red, and doji within the length provided.
Strategy: Candlestick Wick Analysis with Volume Conditions
This strategy focuses on analyzing the wicks (or shadows) of candlesticks to identify potential trading opportunities based on candlestick structure and volume. Based on these criteria, it places stop orders at the extremities of the wicks when certain conditions are met, thus increasing the chances of capturing significant price movements.
Trading Criteria
Volume Conditions:
The strategy checks if the volume of the current candle is higher than that of the previous three candles. This ensures that the observed price movement is supported by significant volume, increasing the probability that the price will continue in the same direction.
Wick Analysis:
Upper Wick:
If the upper wick of a candle represents more than 90% of its body size and is longer than the lower wick, this indicates that the price tested a resistance level before pulling back.
Order Placement: In this case, a Buy Stop order is placed at the upper extremity of the wick. This means that if the price rises back to this level, the order will be triggered, and the trader will take a buy position.
SL Management: A stop-loss is then placed below the lowest point of the same candle. This protects the trader by limiting losses if the price falls back after the order is triggered.
Lower Wick:
If the lower wick of a candle is longer than the upper wick and represents more than 90% of its body size, this indicates that the price tested a support level before rising.
Order Placement: In this case, a Sell Stop order is placed at the lower extremity of the wick. Thus, if the price drops back to this level, the order will be triggered, and the trader will take a sell position.
SL Management: A stop-loss is then placed above the highest point of the same candle. This ensures risk management by limiting losses if the price rebounds upward after the order is triggered.
Strategy Advantages
Responsiveness to Price Movements: The strategy is designed to detect significant price movements based on the market's reaction around support and resistance levels. By placing stop orders directly at the wick extremities, it allows capturing strong movements in the direction indicated by the candles.
Securing Positions: Using stop-losses positioned just above or below key levels (wicks) provides better risk management. If the market doesn't move as expected, the position is automatically closed with a limited loss.
Clear Visual Indicators: Symbols are displayed on the chart at the points where orders have been placed, making it easier to understand trading decisions. This helps to quickly identify the support or resistance levels tested by the price, as well as potential entry points.
Conclusion
The strategy is based on the idea that large wicks signal areas where buyers or sellers have tested significant price levels before temporarily retreating. By placing stop orders at the extremities of these wicks, the strategy allows capturing price movements when they confirm, while limiting risks through strategically placed stop-losses. It thus offers a balanced approach between capturing potential profit and managing risk.
This description emphasizes the idea of capturing significant market movements with stop orders while providing a clear explanation of the logic and risk management. It’s tailored for publication on TradingView and highlights the robustness of the strategy.

Advanced Candlestick Patterns [vitruvius]This is a very advanced indicator that detects most commonly used candlestick patterns. Please read this document carefully to understand how it works.
It is tailored to identify patterns that only have a great possibility of signaling a price movement. In other words, it can and will ignore some patterns, even though they satisfy the recognition conditions defined in the books. Candlestick patterns should also satisfy some other conditions in this indicator to be valid and you can modify those conditions.
This indicator is not only about identifying the candlestick patterns. By using the different choices, you can:
Avoid fake signals
Confirm patterns
Increase your possibility to win a trade
Reduce risk
Identify bullish/bearish movements better
Recommended Use
This indicator works best when you:
Use it in the daily time frame
Combine it with Support/Resistance areas
Note: For some candlestick patterns, you have the option of confirming the pattern with the next price action. In those cases, there will be obviously one bar delay (because it will wait for one more bar to close to confirm the pattern). However, it will mark the candlestick where it identifies the pattern and it will have ”Confirmed” in its text.
Important Note
This indicator does some serious calculations and checks for a lot of user inputs. Therefore, it might be a little slow. Please give it some time when it needs to do some computing.
MODULES
Trend Detection
Most of the patterns in this script are trend reversal patterns. So, recognition of the candlestick patterns depends heavily on the trend. In fact, even if you do not select a trend detection method, it will use the SMA method as default where it needs a certain trend in identifying a specific pattern.
It is possible to combine multiple trend detection methods. You can see how this affects the overall trend detection by enabling the background coloring.
Note: There might be some cases where a candle has a bullish/bearish confirmation of the same candlestick pattern . In those cases, the script is unable to identify the move and the user should decide if the identified pattern is bullish or bearish.
Below are the inputs of this module:
Color the background according to the trend?
If you select a trend detection method, it will color the background green for an uptrend and red for a downtrend .
Counter the trend when there is no obvious trend?
If you select multiple trend detection methods, there might be some cases where one of the methods indicates an uptrend and the other one indicates a downtrend . In that case, the script will continue with the previous trend (whatever the trend is one bar ago) by default . You can, however, reverse the trend in those cases by using this option. If you choose to reverse, you might catch the trend early .
Use MACD to detect the trend?
Use MACD to detect the trend. Whenever MACD delta is greater or equal to zero, it is an uptrend .
MACD Fast Length
Fast length of MACD.
MACD Slow Length
Slow length of MACD.
MACD Signal Smoothing
Signal smoothing value of MACD. Please note that it is set to 6 by default.
Use SMA to detect the trend?
Use SMA to detect the trend. If the price closes above the SMA line, it is an uptrend
SMA Length
Length of SMA.
Use the average price of previous candles to detect the trend?
If the average of open and close prices constantly go up for n bars that are determined by the next user input, it is an uptrend .
Number of candles to analyze
The number of bars ( n ) to analyze for the average price method.
Use the closing price of the previous candle to detect the trend?
If the difference between the current close and nth previous bar’s close is greater than the given threshold, it is an uptrend .
Position of the previous candle to analyze
Position of the bar (backward) to compare with the current close price.
Threshold for the closing price
The threshold value for closing price method.
Basic Candlestick Patterns
This module detects Doji, Spinning Top, Marubozu candlestick patterns. Also, you can set some specific options that are going to be used in all candlestick patterns.
Note: If you choose to manually enter the body height of a doji , you need to find the optimal value for different timeframes. Different timeframes have difference price action ranges.
Below are the inputs of this module:
Tolerate opening/closing price of the candle?
When a candlestick pattern needs to have a gap between two candles, you can tolerate the opening/closing prices of the one candle. This option is useful where the opening and closing prices are very close. This option is going to be used in all candlestick patterns.
Factor for tolerating opening/closing price
The more the factor is, the more the tolerance is.
Body/Height ratio for a candle to be considered as Bullish/Bearish
A bullish/bearish candle shouldn’t have too much shadow. You can use this option to determine the shadow length of a bullish/bearish bar. This option is going to be used in all candlestick patterns
Use basic candlestick pattern (Doji, Spinning Top, Marubozu)?
Detect doji, spinning top, marubozu candlestick patterns.
Manually set body of Doji?
You can manually set the body height of a doji. Otherwise, it will be calculated automatically. If you choose to use this option, then spinning top, and marubozu will also be calculated based on this.
Body of Doji
Body height of a bar to be considered as doji . Any bar with a body equal or less than the given value will be marked as doji. Only effective if you check the ”Manually set body of Doji?” option .
Verify a Doji by looking at the preceding candle?
If true, it will only mark dojis if the preceding candle is bullish or bearish.
Single Candlestick Patterns
This module detects Hammer, Hanging Man, Inverted Hammer, Shooting Star single candlestick patterns.
Below are the inputs of this module:
Confirm Single Candlestick Patterns with next closing price?
You can confirm a single candlestick pattern with the next closing price. That is, if the next candle closes above the previous one, it will confirm a bullish movement. If the next candle closes below the previous one, it will confirm a bearish movement.
Use Hammer and Hanging Man Single Candlestick Patterns?
Detect hammer and h anging man single candlestick patterns.
Use Inverted Hammer and Shooting Star Single Candlestick Patterns?
Detect inverted hammer and s hooting star single candlestick patterns.
Dual Candlestick Patterns
This module detects Engulfing, Tweezer Bottoms, Tweezer Tops, Harami, Inside Bar, Piercing Line, Dark Cloud Cover dual candlestick patterns.
Below are the inputs of this module:
Use Engulfing Dual Candlestick Pattern?
Detect engulfing dual candlestick pattern.
Validate Engulfing by comparing highs and lows?
If checked, the second bar must engulf the previous bar’s high/low also. If unchecked, the second bar should only engulf the real body of the first bar.
Use Tweezer Bottoms and Tops Dual Candlestick Patterns?
Detect tweezer bottoms and tweezer tops dual candlestick patterns.
Check the shadow equality of Tweezer Bottom and Tops?
Check if the shadows of the tweezer bars are about the same length.
Detect Harami Dual Candlestick Pattern?
Detect harami dual candlestick pattern.
Use High/Low of the second Harami candle instead of Open/Close price?
If checked, the body of the child must be within High and Low of the mother bar. Otherwise, only open/close prices will be checked.
Detect Inside Bar Dual Candlestick Pattern?
Detect inside bar dual candlestick pattern.
Treat Inside Bar as a reversal pattern?
If checked, inside bar will be treated as a bullish/bearish reversal pattern.
Check if the Inside bar formed in the upper/lower half of the Mother bar?
Check if the inside bar forms within the upper/lower body half of the mother. Then it will be treated as a bullish/bearish inside bar .
Detect the Inside Bar only if the previous candle closes outside of the Keltner channel?
This option effects identifying the inside bar . Such that, an inside bar will be detected only if the previous candle closes outside of Keltner Channel . Inside bars are effective when the market is extended and this is a nice way to check for that.
Confirm Inside Bar with the next close breaching the low/high of the inside bar?
Check if the next bar breaches inside bar’s high/low. Then it will be treated as a bullish/bearish inside bar .
Use Piercing Line and Dark Cloud Cover Dual Candlestick Patterns?
Detect Piercing Line and Dark Cloud Cover dual candlestick patterns.
Triple Candlestick Patterns
This module detects Morning Star , Evening Star, Three White Soldiers, Three Black Crows, Three Inside Up, Three Inside Down, Three Line Strike, Abandoned Baby, NR4, NR7 candlestick patterns.
Below are the inputs of this module:
Use Morning and Evening Star Triple Candlestick Pattern?
Detect morning and evening star triple candlestick patterns.
Don't allow the second candle's body to overlap with the first and third candle?
If checked, high and low of the second candle cannot overlap with the first and third candle for morning and evening star candlestick patterns.
The third candle must close beyond the midpoint of the first candle?
If checked, the third candle must close beyond the midpoint of the first candle for morning and evening star candlestick patterns.
Use Three White Soldiers and Three Black Crows Triple Candlestick Pattern?
Detect three white soldiers and three black crows triple candlestick pattern.
Compare bodies of Three White Soldiers and Three Black Crows candles?
You also have the possibility of comparing bodies of the candles in a way that every consecutive candle must have a bigger body than the previous candle.
Check if each candle (TWS&TBC) opens in the middle price range of the previous day?
You can check if each candle of three white soldiers and three black crows opens in the middle price range of the previous day.
Use Three Inside Up/Down Triple Candlestick Pattern?
Detect three inside up and three inside down triple candlestick pattern.
Check candles' bodies and closing prices for Three Inside Up/Down?
There are two different definitions for three inside up/down candlestick patterns. This option allows you to select one of those definitions. That is;
If unchecked , the second candle should make it up all the way to the midpoint of the first candle. Also, the third candle needs to close above the first candle’s high.
If checked , the second candle opens and closes within the real body of the first candle. Also, the third candle needs to close above the first candle's high.
Use Three Line Strike Candlestick Pattern?
Detect three line strike triple candlestick pattern.
Compare High/Lows instead of Open/Close for the Three Line Strike Pattern?
If checked, it will compare high/lows instead of open/close prices for the three line strike pattern.
Use Abandoned Baby Triple Candlestick Pattern?
Detect abandoned baby triple candlestick pattern. If you choose to tolerate opening and closing prices, high and low prices will also be tolerated for abandoned baby.
Use NR4 Candlestick Pattern?
Detect NR4 candlestick pattern.
Use NR7 Candlestick Pattern?
Detect NR7 candlestick pattern.
Confirm Narrow Range Candlestick Patterns with next closing price?
You can confirm NR4 and NR7 candlestick patterns with the next closing price. That way they will be identified as bullish or bearish patterns.
NOTES FROM THE AUTHOR
Please do not hesitate to contact me if you have any questions.
If you are not familiar with a specific candlestick pattern, try to google it. If you still need help, you can always contact me.
If you find a bug, or you think the indicator does not work as intended, please contact me with a screenshot of the chart. Also, please mention how you set up the user inputs.
If you have any ideas to further improve this indicator, please feel free to share it with me :)
LIKE , if you like it. SHARE if you think it would be useful for others too. FOLLOW for future updates and new indicators.

THD Candlestick PatternsThe THD Candlestick Patterns identify the most important candlestick patters for trading support and resistance.
Candlestick Structure [LuxAlgo]The Candlestick Structure indicator detects major market trends and displays various candlestick patterns aligning with the detected trend, filtering out potentially unwanted patterns as a result. Multiple trend detection methods are included and can be selected by the users.
A dashboard showing the alignment percentage of each individual pattern is also provided.
🔶 USAGE
By distinguishing major and minor trend detection, we can still detect patterns based on minor trends, yet filter out the patterns that do not align with the major trend.
By detecting candlestick patterns that align with a major trend, we can effectively detect the ending points of retracements, potentially providing various entry points of interest within a trend.
Users are able to track the alignment of each candlestick pattern in the dashboard to reveal which patterns typically align with the trend and which may not.
Note: Alignment % only checks if the pattern's direction is the same as the current trend direction. These are only raw readings and not any type of confidence score.
🔶 DETAILS
In this indicator, we are identifying and tracking 16 different Candlestick Patterns.
🔹 Bullish Patterns
Hammer: Identified by a small upper wick (or no upper wick) with a small body, and an elongated lower wick whose length is 2X greater than the candle body’s width.
Inverted Hammer: Identified by a small lower wick (or no lower wick) with a small body, and an elongated upper wick whose length is 2X greater than the candle body’s width.
Bullish Engulfing: A 2 bar pattern identified by a large bullish candle body fully encapsulating (opening lower and closing higher) the previous small (bearish) candle body.
Rising 3: A 5 bar pattern identified by an initial full-bodied bullish candle, followed by 3 bearish candles that trade within the high and low of the initial candle, followed by another full-bodied bullish candle closing above the high of the initial candle.
3 White Soldiers: Identified by 3 full-bodied bullish candles, each opening within the body and closing below the high, of the previous candle.
Morning Star: A 3 bar pattern identified by a full-bodied bearish candle, followed by a small-bodied bearish candle, followed by a full-bodied bullish candle that closes above the halfway point of the first candle.
Bullish Harami: A 2 bar pattern, identified by an initial bearish candle, followed by a small bullish candle whose range is entirely contained within the body of the initial candle.
Tweezer Bottom: A 2 bar pattern identified by an initial bearish candle, followed by a bullish candle, both having equal lows.
🔹 Bearish Patterns
Hanging Man: Identified by a small upper wick (or no upper wick) with a small body, and an elongated lower wick whose length is 2X greater than the candle body’s width.
Shooting Star: Identified by a small lower wick (or no lower wick) with a small body, and an elongated upper wick whose length is 2X greater than the candle body’s width.
Bearish Engulfing: A 2 bar pattern identified by a large bearish candle body fully encapsulating (opening higher and closing lower) the previous small (bullish) candle body.
Falling 3: A 5 bar pattern identified by an initial full-bodied bearish candle, followed by 3 bullish candles that trade within the high and low of the initial candle, followed by another full-bodied bearish candle closing below the low of the initial candle.
3 Black Crows: Identified by 3 full-bodied bearish candles, each open within the body and closing below the low, of the previous candle.
Evening Star: A 3 bar pattern identified by a full-bodied bullish candle, followed by a small-bodied bullish candle, followed by a full-bodied bearish candle that closes below the halfway point of the first candle.
Bearish Harami: A 2 bar pattern, identified by an initial bullish candle, followed by a small bearish candle whose range is entirely contained within the body of the initial candle.
Tweezer Top: A 2 bar pattern identified by an initial bullish candle, followed by a bearish candle, both having equal highs.
🔹 Trend Types
Major trend is displayed at all times, the display will change depending on the trend method selected.
The minor trend can also be visualized; to avoid confusion, the minor trend can optionally be displayed through the candle colors.
Supertrend: Displays Upper and Lower SuperTrend, When we break above the upper, it is considered an Uptrend. When we break below the lower, it is considered a Downtrend.
EMAs: Displays Fast and Slow EMAs, When Fast>Slow, it is considered an Uptrend. When Fast

Stop Hunt Candlesticks (Liquidity Wicks)🕯️ Stop Hunt Candlesticks
Wick Highlighter – Spot Extreme Wicks Instantly
This indicator highlights candles where the upper or lower wick exceeds a customizable percentage of the asset’s price — perfect for quickly spotting strong rejections, liquidity grabs, stop hunts or exhaustion moves.
💡 Key Features
Visual Background Highlight: Automatically colors the chart background when a wick surpasses your defined % threshold (default 1%).
Customizable Threshold: Adjust wick sensitivity to suit different assets or timeframes.
Upper & Lower Wick Filters: Choose whether to track upper wicks, lower wicks, or both.
Dynamic Price Basis: Compare wick size relative to Close, Open, HL2, or OC2.
Optional Labels: Display the exact wick percentage directly on the chart.
Alerts Ready: Get notified whenever a candle shows an extreme wick condition.
⚙️ How It Works
The script measures each candle’s wick size relative to your chosen price basis:
Upper wick % = (High − max(Open, Close)) / Basis × 100
Lower wick % = (min(Open, Close) − Low) / Basis × 100
If the result exceeds your chosen threshold, the chart background changes color.
Red for upper wicks, green for lower wicks by default.
🎯 Use Cases
Identify strong rejections or stop hunts near key levels.
Confirm price exhaustion or potential reversals.
Filter fake breakouts or high-volatility events.
🧩 Customization
Tweak colors, transparency, and label visibility to fit seamlessly into your chart setup.

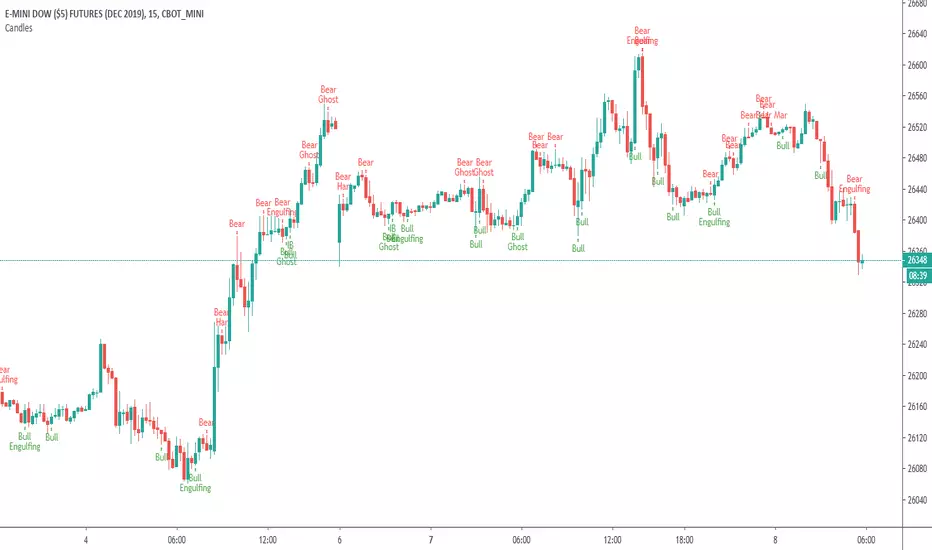
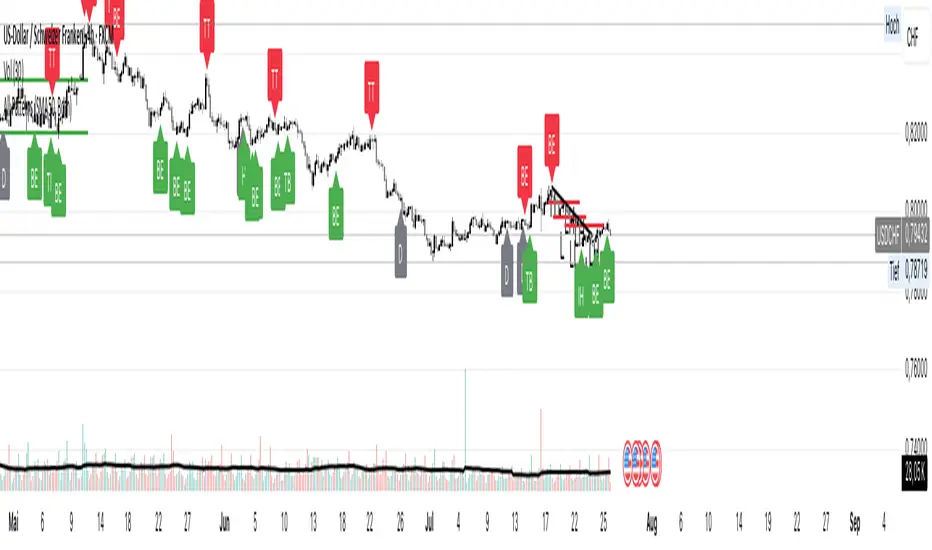
All Candlestick-Patterns - by FibonacciFuel
Overview
The indicator "All Candlestick-Patterns - by FibonacciFuel" is a comprehensive tool for traders and analysts, originally designed in German, that recognizes and visualizes a wide variety of candlestick patterns on a chart. Developed with Pine Script™, this indicator provides a detailed analysis of bullish, bearish, and neutral candlestick patterns, commonly used in technical analysis to identify potential reversal or continuation signals. It is particularly useful for both novice and experienced traders looking to enhance their market assessment through visual pattern recognition.
Functionality
The indicator continuously monitors the price action and detects over 30 different candlestick patterns, including classic patterns like "Doji," "Hammer," "Engulfing," and more complex formations such as "Morning Star" or "Falling Three Methods." Each detection is marked with a label on the chart indicating the pattern type (e.g., "H" for Hammer or "ES" for Evening Star). Additionally, detailed tooltips are provided, which appear when hovering over a label, offering a description of the pattern in German, including its significance and interpretation.
Detection Logic
Trend Detection: The indicator can configure trend detection based on the 50-day SMA (Simple Moving Average), a combination of 50-day and 200-day SMA, or no trend detection.
Criteria: Each pattern is identified using specific criteria such as candlestick body size, shadow length, and position relative to the previous price action.
Customizability: Users can choose to display only bullish, only bearish, or both types of patterns, as well as enable or disable individual patterns.
Visual Representation
Labels: Each detected pattern is marked with a short code (e.g., "TB" for Tweezer Bottom), placed above or below the candlestick depending on its bullish or bearish nature.
Color Coding: Bullish patterns are displayed in blue, bearish in red, and neutral patterns in gray, enabling quick visual differentiation.
Tooltips: Hovering over a label triggers a tooltip with a detailed German description, explaining the context and potential market implication.
Supported Candlestick Patterns
The indicator covers a broad range of patterns, including:
- **Bullish**: Hammer, Inverted Hammer, Morning Star, Piercing, Rising Three Methods, Tweezer Bottom, among others.
- **Bearish**: Hanging Man, Shooting Star, Evening Star, Dark Cloud Cover, Falling Three Methods, Tweezer Top, among others.
- **Neutral**: Doji, Spinning Top, Harami Cross, among others.
Configuration
Trend Rule: Choose between "SMA50," "SMA50, SMA200," or "No detection" to define the trend basis.
Pattern Activation: Enable or disable individual patterns (e.g., Abandoned Baby, Engulfing) via input fields.
Display Options: Select between "Bullish," "Bearish," or "Both" to limit the pattern display.
Colors: Customize the label colors for bullish, bearish, and neutral patterns.
Application
Installation: Add the indicator to your chart.
Customization: Adjust settings to your preferences, such as the trend rule or desired patterns.
Analysis: Use the labels and tooltips to identify potential trading signals. For example, a "Hammer" in a downtrend might indicate a reversal.
Confirmation: Combine the patterns with other indicators (e.g., RSI, MACD) for a well-informed decision.
Advantages
Comprehensiveness: Detects a wide variety of patterns covering the full spectrum of candlestick analysis.
User-Friendliness: Intuitive labels and detailed tooltips simplify interpretation.
Flexibility: Customizable settings allow for tailored usage.
Conclusion
"All Candlestick-Patterns - by FibonacciFuel" is a powerful tool for traders aiming to master the art of candlestick pattern analysis. With its ability to recognize and visually represent a broad range of patterns, it provides valuable support for trading decisions. Whether you are a beginner learning the basics or an experienced trader refining strategies, this indicator is an indispensable asset in your toolkit.
Developed by FibonacciFuel, this indicator is released under the Mozilla Public License 2.0 and is freely usable. Feedback or improvement suggestions are welcome!
# All Candlestick-Patterns - by FibonacciFuel
## Overview
The indicator "All Candlestick-Patterns - by FibonacciFuel" is a comprehensive tool for traders and analysts, originally designed in German, that recognizes and visualizes a wide variety of candlestick patterns on a chart. Developed with Pine Script™, this indicator provides a detailed analysis of bullish, bearish, and neutral candlestick patterns, commonly used in technical analysis to identify potential reversal or continuation signals. It is particularly useful for both novice and experienced traders looking to enhance their market assessment through visual pattern recognition.
## Functionality
The indicator continuously monitors the price action and detects over 30 different candlestick patterns, including classic patterns like "Doji," "Hammer," "Engulfing," and more complex formations such as "Morning Star" or "Falling Three Methods." Each detection is marked with a label on the chart indicating the pattern type (e.g., "H" for Hammer or "ES" for Evening Star). Additionally, detailed tooltips are provided, which appear when hovering over a label, offering a description of the pattern in German, including its significance and interpretation.
## Detection Logic
- **Trend Detection**: The indicator can configure trend detection based on the 50-day SMA (Simple Moving Average), a combination of 50-day and 200-day SMA, or no trend detection.
- **Criteria**: Each pattern is identified using specific criteria such as candlestick body size, shadow length, and position relative to the previous price action.
- **Customizability**: Users can choose to display only bullish, only bearish, or both types of patterns, as well as enable or disable individual patterns.
## Visual Representation
- **Labels**: Each detected pattern is marked with a short code (e.g., "TB" for Tweezer Bottom), placed above or below the candlestick depending on its bullish or bearish nature.
- **Color Coding**: Bullish patterns are displayed in blue, bearish in red, and neutral patterns in gray, enabling quick visual differentiation.
- **Tooltips**: Hovering over a label triggers a tooltip with a detailed German description, explaining the context and potential market implication.
## Supported Candlestick Patterns
The indicator covers a broad range of patterns, including:
- **Bullish**: Hammer, Inverted Hammer, Morning Star, Piercing, Rising Three Methods, Tweezer Bottom, among others.
- **Bearish**: Hanging Man, Shooting Star, Evening Star, Dark Cloud Cover, Falling Three Methods, Tweezer Top, among others.
- **Neutral**: Doji, Spinning Top, Harami Cross, among others.
## Configuration
- **Trend Rule**: Choose between "SMA50," "SMA50, SMA200," or "No detection" to define the trend basis.
- **Pattern Activation**: Enable or disable individual patterns (e.g., Abandoned Baby, Engulfing) via input fields.
- **Display Options**: Select between "Bullish," "Bearish," or "Both" to limit the pattern display.
- **Colors**: Customize the label colors for bullish, bearish, and neutral patterns.
## Application
1. **Installation**: Add the indicator to your chart.
2. **Customization**: Adjust settings to your preferences, such as the trend rule or desired patterns.
3. **Analysis**: Use the labels and tooltips to identify potential trading signals. For example, a "Hammer" in a downtrend might indicate a reversal.
4. **Confirmation**: Combine the patterns with other indicators (e.g., RSI, MACD) for a well-informed decision.
## Advantages
- **Comprehensiveness**: Detects a wide variety of patterns covering the full spectrum of candlestick analysis.
- **User-Friendliness**: Intuitive labels and detailed tooltips simplify interpretation.
- **Flexibility**: Customizable settings allow for tailored usage.
## Conclusion
"All Candlestick-Patterns - by FibonacciFuel" is a powerful tool for traders aiming to master the art of candlestick pattern analysis. With its ability to recognize and visually represent a broad range of patterns, it provides valuable support for trading decisions. Whether you are a beginner learning the basics or an experienced trader refining strategies, this indicator is an indispensable asset in your toolkit.
Developed by FibonacciFuel, this indicator is released under the Mozilla Public License 2.0 and is freely usable. Feedback or improvement suggestions are welcome!
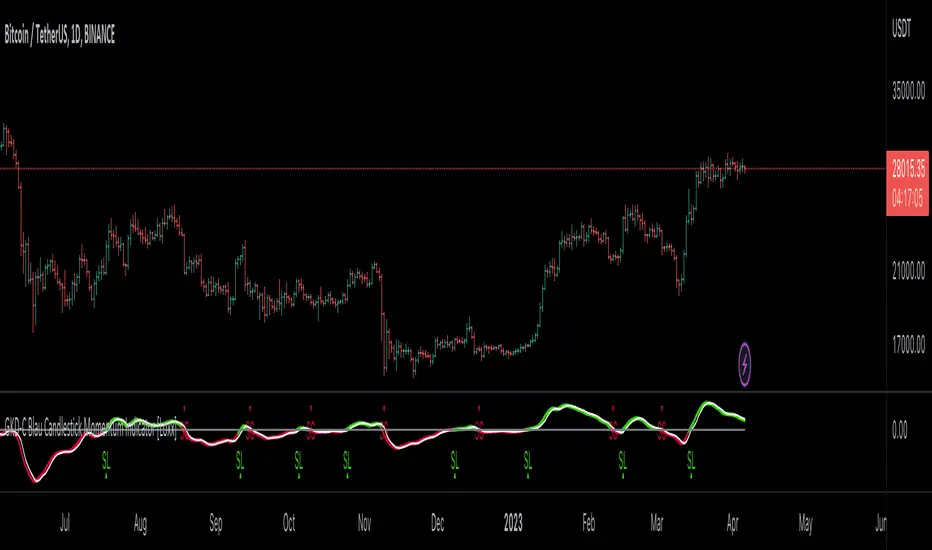
GKD-C Blau Candlestick Momentum Indicator [Loxx]Giga Kaleidoscope GKD-C Blau Candlestick Momentum Indicator is a Confirmation module included in Loxx's "Giga Kaleidoscope Modularized Trading System".
█ Giga Kaleidoscope Modularized Trading System
What is Loxx's "Giga Kaleidoscope Modularized Trading System"?
The Giga Kaleidoscope Modularized Trading System is a trading system built on the philosophy of the NNFX (No Nonsense Forex) algorithmic trading.
What is the NNFX algorithmic trading strategy?
The NNFX (No-Nonsense Forex) trading system is a comprehensive approach to Forex trading that is designed to simplify the process and remove the confusion and complexity that often surrounds trading. The system was developed by a Forex trader who goes by the pseudonym "VP" and has gained a significant following in the Forex community.
The NNFX trading system is based on a set of rules and guidelines that help traders make objective and informed decisions. These rules cover all aspects of trading, including market analysis, trade entry, stop loss placement, and trade management.
Here are the main components of the NNFX trading system:
1. Trading Philosophy: The NNFX trading system is based on the idea that successful trading requires a comprehensive understanding of the market, objective analysis, and strict risk management. The system aims to remove subjective elements from trading and focuses on objective rules and guidelines.
2. Technical Analysis: The NNFX trading system relies heavily on technical analysis and uses a range of indicators to identify high-probability trading opportunities. The system uses a combination of trend-following and mean-reverting strategies to identify trades.
3. Market Structure: The NNFX trading system emphasizes the importance of understanding the market structure, including price action, support and resistance levels, and market cycles. The system uses a range of tools to identify the market structure, including trend lines, channels, and moving averages.
4. Trade Entry: The NNFX trading system has strict rules for trade entry. The system uses a combination of technical indicators to identify high-probability trades, and traders must meet specific criteria to enter a trade.
5. Stop Loss Placement: The NNFX trading system places a significant emphasis on risk management and requires traders to place a stop loss order on every trade. The system uses a combination of technical analysis and market structure to determine the appropriate stop loss level.
6. Trade Management: The NNFX trading system has specific rules for managing open trades. The system aims to minimize risk and maximize profit by using a combination of trailing stops, take profit levels, and position sizing.
Overall, the NNFX trading system is designed to be a straightforward and easy-to-follow approach to Forex trading that can be applied by traders of all skill levels.
Core components of an NNFX algorithmic trading strategy
The NNFX algorithm is built on the principles of trend, momentum, and volatility. There are six core components in the NNFX trading algorithm:
1. Volatility - price volatility; e.g., Average True Range, True Range Double, Close-to-Close, etc.
2. Baseline - a moving average to identify price trend
3. Confirmation 1 - a technical indicator used to identify trends
4. Confirmation 2 - a technical indicator used to identify trends
5. Continuation - a technical indicator used to identify trends
6. Volatility/Volume - a technical indicator used to identify volatility/volume breakouts/breakdown
7. Exit - a technical indicator used to determine when a trend is exhausted
What is Volatility in the NNFX trading system?
In the NNFX (No Nonsense Forex) trading system, ATR (Average True Range) is typically used to measure the volatility of an asset. It is used as a part of the system to help determine the appropriate stop loss and take profit levels for a trade. ATR is calculated by taking the average of the true range values over a specified period.
True range is calculated as the maximum of the following values:
-Current high minus the current low
-Absolute value of the current high minus the previous close
-Absolute value of the current low minus the previous close
ATR is a dynamic indicator that changes with changes in volatility. As volatility increases, the value of ATR increases, and as volatility decreases, the value of ATR decreases. By using ATR in NNFX system, traders can adjust their stop loss and take profit levels according to the volatility of the asset being traded. This helps to ensure that the trade is given enough room to move, while also minimizing potential losses.
Other types of volatility include True Range Double (TRD), Close-to-Close, and Garman-Klass
What is a Baseline indicator?
The baseline is essentially a moving average, and is used to determine the overall direction of the market.
The baseline in the NNFX system is used to filter out trades that are not in line with the long-term trend of the market. The baseline is plotted on the chart along with other indicators, such as the Moving Average (MA), the Relative Strength Index (RSI), and the Average True Range (ATR).
Trades are only taken when the price is in the same direction as the baseline. For example, if the baseline is sloping upwards, only long trades are taken, and if the baseline is sloping downwards, only short trades are taken. This approach helps to ensure that trades are in line with the overall trend of the market, and reduces the risk of entering trades that are likely to fail.
By using a baseline in the NNFX system, traders can have a clear reference point for determining the overall trend of the market, and can make more informed trading decisions. The baseline helps to filter out noise and false signals, and ensures that trades are taken in the direction of the long-term trend.
What is a Confirmation indicator?
Confirmation indicators are technical indicators that are used to confirm the signals generated by primary indicators. Primary indicators are the core indicators used in the NNFX system, such as the Average True Range (ATR), the Moving Average (MA), and the Relative Strength Index (RSI).
The purpose of the confirmation indicators is to reduce false signals and improve the accuracy of the trading system. They are designed to confirm the signals generated by the primary indicators by providing additional information about the strength and direction of the trend.
Some examples of confirmation indicators that may be used in the NNFX system include the Bollinger Bands, the MACD (Moving Average Convergence Divergence), and the MACD Oscillator. These indicators can provide information about the volatility, momentum, and trend strength of the market, and can be used to confirm the signals generated by the primary indicators.
In the NNFX system, confirmation indicators are used in combination with primary indicators and other filters to create a trading system that is robust and reliable. By using multiple indicators to confirm trading signals, the system aims to reduce the risk of false signals and improve the overall profitability of the trades.
What is a Continuation indicator?
In the NNFX (No Nonsense Forex) trading system, a continuation indicator is a technical indicator that is used to confirm a current trend and predict that the trend is likely to continue in the same direction. A continuation indicator is typically used in conjunction with other indicators in the system, such as a baseline indicator, to provide a comprehensive trading strategy.
What is a Volatility/Volume indicator?
Volume indicators, such as the On Balance Volume (OBV), the Chaikin Money Flow (CMF), or the Volume Price Trend (VPT), are used to measure the amount of buying and selling activity in a market. They are based on the trading volume of the market, and can provide information about the strength of the trend. In the NNFX system, volume indicators are used to confirm trading signals generated by the Moving Average and the Relative Strength Index. Volatility indicators include Average Direction Index, Waddah Attar, and Volatility Ratio. In the NNFX trading system, volatility is a proxy for volume and vice versa.
By using volume indicators as confirmation tools, the NNFX trading system aims to reduce the risk of false signals and improve the overall profitability of trades. These indicators can provide additional information about the market that is not captured by the primary indicators, and can help traders to make more informed trading decisions. In addition, volume indicators can be used to identify potential changes in market trends and to confirm the strength of price movements.
What is an Exit indicator?
The exit indicator is used in conjunction with other indicators in the system, such as the Moving Average (MA), the Relative Strength Index (RSI), and the Average True Range (ATR), to provide a comprehensive trading strategy.
The exit indicator in the NNFX system can be any technical indicator that is deemed effective at identifying optimal exit points. Examples of exit indicators that are commonly used include the Parabolic SAR, the Average Directional Index (ADX), and the Chandelier Exit.
The purpose of the exit indicator is to identify when a trend is likely to reverse or when the market conditions have changed, signaling the need to exit a trade. By using an exit indicator, traders can manage their risk and prevent significant losses.
In the NNFX system, the exit indicator is used in conjunction with a stop loss and a take profit order to maximize profits and minimize losses. The stop loss order is used to limit the amount of loss that can be incurred if the trade goes against the trader, while the take profit order is used to lock in profits when the trade is moving in the trader's favor.
Overall, the use of an exit indicator in the NNFX trading system is an important component of a comprehensive trading strategy. It allows traders to manage their risk effectively and improve the profitability of their trades by exiting at the right time.
How does Loxx's GKD (Giga Kaleidoscope Modularized Trading System) implement the NNFX algorithm outlined above?
Loxx's GKD v1.0 system has five types of modules (indicators/strategies). These modules are:
1. GKD-BT - Backtesting module (Volatility, Number 1 in the NNFX algorithm)
2. GKD-B - Baseline module (Baseline and Volatility/Volume, Numbers 1 and 2 in the NNFX algorithm)
3. GKD-C - Confirmation 1/2 and Continuation module (Confirmation 1/2 and Continuation, Numbers 3, 4, and 5 in the NNFX algorithm)
4. GKD-V - Volatility/Volume module (Confirmation 1/2, Number 6 in the NNFX algorithm)
5. GKD-E - Exit module (Exit, Number 7 in the NNFX algorithm)
(additional module types will added in future releases)
Each module interacts with every module by passing data between modules. Data is passed between each module as described below:
GKD-B => GKD-V => GKD-C(1) => GKD-C(2) => GKD-C(Continuation) => GKD-E => GKD-BT
That is, the Baseline indicator passes its data to Volatility/Volume. The Volatility/Volume indicator passes its values to the Confirmation 1 indicator. The Confirmation 1 indicator passes its values to the Confirmation 2 indicator. The Confirmation 2 indicator passes its values to the Continuation indicator. The Continuation indicator passes its values to the Exit indicator, and finally, the Exit indicator passes its values to the Backtest strategy.
This chaining of indicators requires that each module conform to Loxx's GKD protocol, therefore allowing for the testing of every possible combination of technical indicators that make up the six components of the NNFX algorithm.
What does the application of the GKD trading system look like?
Example trading system:
Backtest: Strategy with 1-3 take profits, trailing stop loss, multiple types of PnL volatility, and 2 backtesting styles
Baseline: Hull Moving Average
Volatility/Volume: Hurst Exponent
Confirmation 1: Blau Candlestick Momentum Indicator as shown on the chart above
Confirmation 2: Williams Percent Range
Continuation: Fisher Transform
Exit: Rex Oscillator
Each GKD indicator is denoted with a module identifier of either: GKD-BT, GKD-B, GKD-C, GKD-V, or GKD-E. This allows traders to understand to which module each indicator belongs and where each indicator fits into the GKD protocol chain.
Giga Kaleidoscope Modularized Trading System Signals (based on the NNFX algorithm)
Standard Entry
1. GKD-C Confirmation 1 Signal
2. GKD-B Baseline agrees
3. Price is within a range of 0.2x Volatility and 1.0x Volatility of the Goldie Locks Mean
4. GKD-C Confirmation 2 agrees
5. GKD-V Volatility/Volume agrees
Baseline Entry
1. GKD-B Baseline signal
2. GKD-C Confirmation 1 agrees
3. Price is within a range of 0.2x Volatility and 1.0x Volatility of the Goldie Locks Mean
4. GKD-C Confirmation 2 agrees
5. GKD-V Volatility/Volume agrees
6. GKD-C Confirmation 1 signal was less than 7 candles prior
Continuation Entry
1. Standard Entry, Baseline Entry, or Pullback; entry triggered previously
2. GKD-B Baseline hasn't crossed since entry signal trigger
3. GKD-C Confirmation Continuation Indicator signals
4. GKD-C Confirmation 1 agrees
5. GKD-B Baseline agrees
6. GKD-C Confirmation 2 agrees
1-Candle Rule Standard Entry
1. GKD-C Confirmation 1 signal
2. GKD-B Baseline agrees
3. Price is within a range of 0.2x Volatility and 1.0x Volatility of the Goldie Locks Mean
Next Candle:
1. Price retraced (Long: close < close or Short: close > close )
2. GKD-B Baseline agrees
3. GKD-C Confirmation 1 agrees
4. GKD-C Confirmation 2 agrees
5. GKD-V Volatility/Volume agrees
1-Candle Rule Baseline Entry
1. GKD-B Baseline signal
2. GKD-C Confirmation 1 agrees
3. Price is within a range of 0.2x Volatility and 1.0x Volatility of the Goldie Locks Mean
4. GKD-C Confirmation 1 signal was less than 7 candles prior
Next Candle:
1. Price retraced (Long: close < close or Short: close > close )
2. GKD-B Baseline agrees
3. GKD-C Confirmation 1 agrees
4. GKD-C Confirmation 2 agrees
5. GKD-V Volatility/Volume Agrees
PullBack Entry
1. GKD-B Baseline signal
2. GKD-C Confirmation 1 agrees
3. Price is beyond 1.0x Volatility of Baseline
Next Candle:
1. Price is within a range of 0.2x Volatility and 1.0x Volatility of the Goldie Locks Mean
3. GKD-C Confirmation 1 agrees
4. GKD-C Confirmation 2 agrees
5. GKD-V Volatility/Volume Agrees
█ GKD-C Blau Candlestick Momentum Indicator
What is Blau Candlestick Momentum Indicator?
The Candlestick Momentum Indicator is a technical analysis indicator developed by William Blau and described in his book “Momentum, Direction, and Divergence: Applying the Latest Momentum Indicators for Technical Analysis”. It measures the difference between the current close price and the open price of a certain number of bars ago. The values of the Candlestick Momentum Indicator are normalized by absolute values and mapped into the interval .
The Candlestick Momentum Indicator is calculated using the following formula:
CMtm(price1,price2,q,r,s,u) = 100 * EMA(EMA(EMA(cmtm(price1,price2,q),r),s),u)
where:
- price1: close price
- price2: open price q bars ago
- q: number of bars used in calculation of Candlestick Momentum
- cmtm(price1,price2,q): Candlestick Momentum
- CMtm(price1,price2,q,r,s,u): Triple smoothed Candlestick Momentum
- EMA(...,r): first smoothing - exponentially smoothed moving average with period r, applied to Candlestick Momentum
- EMA(EMA(...,r),s): second smoothing - EMA of period s, applied to result of the first smoothing
- EMA(EMA(EMA(...,r),s),u): third smoothing - EMA of period u, applied to result of the second smoothing .
The input parameters for this indicator are:
- q: number of bars used in calculation of Candlestick Momentum (default value is 1)
- r: period of the first EMA applied to Candlestick Momentum (default value is 20)
- s: period of the second EMA applied to result of the first smoothing (default value is 5)
- u: period of the third EMA applied to result of the second smoothing (default value is 3)
- AppliedPrice1: price type (default value is PRICE_CLOSE)
- AppliedPrice2: price type (default value is PRICE_OPEN) .
Requirements
Inputs
Confirmation 1 and Solo Confirmation: GKD-V Volatility / Volume indicator
Confirmation 2: GKD-C Confirmation indicator
Outputs
Confirmation 2 and Solo Confirmation Complex: GKD-E Exit indicator
Confirmation 1: GKD-C Confirmation indicator
Continuation: GKD-E Exit indicator
Solo Confirmation Simple: GKD-BT Backtest strategy
Additional features will be added in future releases.
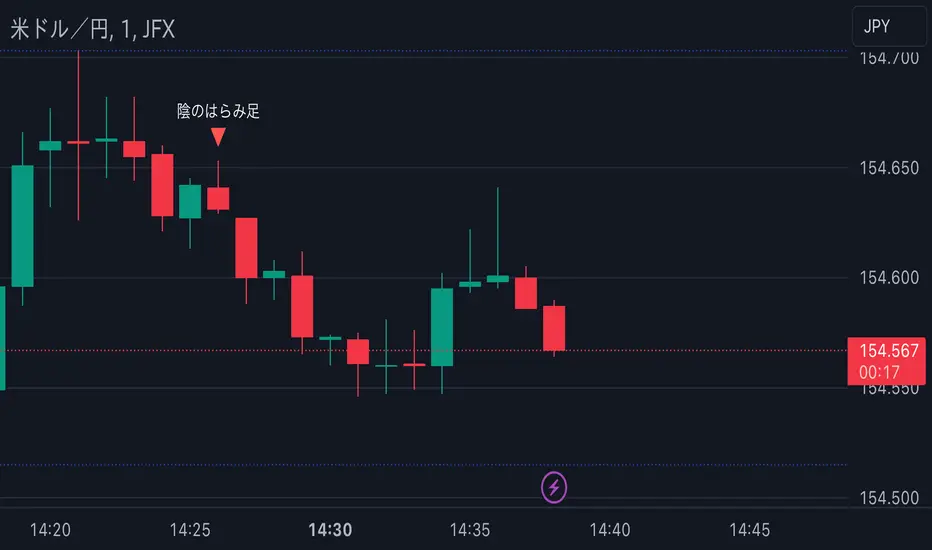
Bullflag Candlestick pattern
A bull flag is essentially a small consolidation near the top of an upthrust. If we picture it as a candlestick pattern, it should have a big green candlestick + a small body red/green candle near the top of the top big green candle.
This script essentially help you identify these.

Candlestick Patterns by Dipak V2I am really excited to publish my work, I know its at the beginning but there is a lot to come in the future. I am writing a script to identify the candlestick patterns. In this version, I have added Hammer and Hanging Man Pattern in the first version, I know its less but its a beginning, I will keep adding the new information in my script in upcoming versions.
This script is for only learning purpose and not for treading realtime. In this script, it only identifies the pattern and does not check for its confirmation or does not provide any stop-loss, Also it does not check the prior trend before the pattern. These things really matter in the live trade. But in future, I am planning to add these things.
If you like my work, please like or comment your ideas I will try to include those in upcoming versions.
Hanging Man:
Hanging man is a bearish reversal candlestick pattern that signals about the uptrend or advancing phase are over and bulls have lost their control. Color of the candle is not important.
Identity:
1) Comes after a significant up rally or uptrend or advancing phase.
2) Small real body at the top.
3) Long lower shadow at least twice the real body.
4) Very small or no upper shadow.
Confirmation:
Immediate next candle’s close should be below the hanging man’s real body.
StopLoss:
There is a potential resistance level above the top of the hanging man. Stoploss should be above the resistance area or at the high of the hanging man.
Hammer:
Hammer is a bullish reversal candlestick pattern that signals about the downtrend or declining phase are over and bears have lost their control. Color of the candle is not important.
Identity:
1) Comes after significant down rally or downtrend or declining phase.
2) Small real body at the top.
3) Long lower shadow at least twice the real body.
4) Very small or no upper shadow.
Confirmation:
Immediate next candle’s close should be above the hammer’s low.
StopLoss:
There is a potential support level below the low of the hammer. Stoploss should be below the support area or at the low of the hammer.
Note: The candle is the same for Hanging Man and Hammer , Difference is where they appear in the uptrend or in the downtrend that makes the real difference.

Engulfing Candlestick StrategyEver wondered whether the Bullish or Bearish Engulfing pattern works or has statistical significance? This script is for you. It works across all markets and timeframes.
The Engulfing Candlestick Pattern is a widely used technical analysis pattern that traders use to predict potential price reversals. It consists of two candles: a small candle followed by a larger one that "engulfs" the previous candle. This pattern is considered bullish when it occurs in a downtrend (bullish engulfing) and bearish when it occurs in an uptrend (bearish engulfing).
Statistical Significance of the Engulfing Pattern:
While many traders rely on candlestick patterns for making decisions, research on the statistical significance of these patterns has produced mixed results. A study by Dimitrios K. Koutoupis and K. M. Koutoupis (2014), titled "Testing the Effectiveness of Candlestick Chart Patterns in Forex Markets," indicates that candlestick patterns, including the engulfing pattern, can provide some predictive power, but their success largely depends on the market conditions and timeframe used. The researchers concluded that while some candlestick patterns can be useful, traders must combine them with other indicators or market knowledge to improve their predictive accuracy.
Another study by Brock, Lakonishok, and LeBaron (1992), "Simple Technical Trading Rules and the Stochastic Properties of Stock Returns," explores the profitability of technical indicators, including candlestick patterns, and finds that simple trading rules, such as those based on moving averages or candlestick patterns, can occasionally outperform a random walk in certain market conditions.
However, Jorion (1997), in his work "The Risk of Speculation: The Case of Technical Analysis," warns that the reliability of candlestick patterns, including the engulfing patterns, can vary significantly across different markets and periods. Therefore, it's important to use these patterns as part of a broader trading strategy that includes other risk management techniques and technical indicators.
Application Across Markets:
This script applies to all markets (e.g., stocks, commodities, forex) and timeframes, making it a versatile tool for traders seeking to explore the statistical effectiveness of the bullish and bearish engulfing patterns in their own trading.
Conclusion:
This script allows you to backtest and visualize the effectiveness of the Bullish and Bearish Engulfing patterns across any market and timeframe. While the statistical significance of these patterns may vary, the script provides a clear framework for evaluating their performance in real-time trading conditions. Always remember to combine such patterns with other risk management strategies and indicators to enhance their predictive power.

Candlestick Strength and Volatility ReadoutDisplays a readout on the top right corner of the screen displaying a two basic calculations (volatility and strength; i.e. candlestick size and how close to the highs or lows it closed) for more convenient candlestick (price action) analysis.
Due to restrictions with Pine Script (or my knowledge thereof) only the current and previous candlestick data is shown, rather than the one currently hovered over.
The data is derived via two simple calculations; volatility being division between the range of the candlestick's high and low by the ATR; 'strength' (what I like to call it) being the range of the body by the range of the open to high or low, depending on the facing direction (positive or negative candlestick). These are expressed as percentages and will turn green depending on the set threshold.
Using this, one can effectively automate calculations you'd have to do by hand otherwise. I personally use these as entry filters in my trading, so it helps to not have to measure, remeasure, and divide before each potential entry.
Settings are implemented to change certain variables to your liking.

Candlestick Reversal SignalsTitle: Candlestick Reversal Signals
This Pine Script indicator is designed to identify and plot signals for two key candlestick reversal patterns: Bullish and Bearish Engulfing patterns, as well as Bullish and Bearish Harami patterns. These patterns are widely recognized for their ability to indicate potential trend reversals in the market, providing traders with valuable insights for making informed trading decisions.
Features:
• Bullish Engulfing Pattern:
• Conditions: This pattern is identified when the current candle’s close is higher than the previous candle’s open, and the current candle’s open is lower than the previous candle’s close. Additionally, the current candle’s close must be higher than the previous candle’s close, and the current candle’s open must be lower than the previous candle’s open.
• Signal: When a Bullish Engulfing pattern is detected, a green label is plotted below the relevant bar, indicating a potential upward reversal.
• Bearish Engulfing Pattern:
• Conditions: This pattern is identified when the current candle’s close is lower than the previous candle’s open, and the current candle’s open is higher than the previous candle’s close. Additionally, the current candle’s close must be lower than the previous candle’s close, and the current candle’s open must be higher than the previous candle’s open.
• Signal: When a Bearish Engulfing pattern is detected, a red label is plotted above the relevant bar, indicating a potential downward reversal.
• Bullish Harami Pattern:
• Conditions: This pattern is identified when the previous candle is a bearish candle (open higher than close), and the current candle is a bullish candle (close higher than open) that is contained within the body of the previous bearish candle.
• Signal: When a Bullish Harami pattern is detected, a green label is plotted below the relevant bar, indicating a potential upward reversal.
• Bearish Harami Pattern:
• Conditions: This pattern is identified when the previous candle is a bullish candle (open lower than close), and the current candle is a bearish candle (close lower than open) that is contained within the body of the previous bullish candle.
• Signal: When a Bearish Harami pattern is detected, a red label is plotted above the relevant bar, indicating a potential downward reversal.
Usage:
To use this script, simply add it to your TradingView chart. The script will automatically highlight the Bullish and Bearish Engulfing patterns, as well as Bullish and Bearish Harami patterns, by plotting green and red labels on the chart. These visual signals make it easy to spot potential reversal points, helping traders to identify and capitalize on trading opportunities.
Example:
• When you see a green “Bullish Engulfing” label below a candlestick, it suggests that the market might reverse upwards, signaling a potential buy opportunity.
• Conversely, a red “Bearish Engulfing” label above a candlestick suggests a potential downward reversal, signaling a potential sell opportunity.
• A green “Bullish Harami” label below a candlestick also indicates a potential upward reversal.
• A red “Bearish Harami” label above a candlestick indicates a potential downward reversal.
This indicator is a valuable addition to any trader’s technical analysis toolkit, providing clear and actionable signals based on well-established candlestick patterns. By incorporating these reversal patterns into your analysis, you can enhance your trading strategy and improve your decision-making process.
GKD-C Blau Ergodic Candlestick Index [Loxx]Giga Kaleidoscope GKD-C Blau Ergodic Candlestick Index is a Confirmation module included in Loxx's "Giga Kaleidoscope Modularized Trading System".
█ Giga Kaleidoscope Modularized Trading System
What is Loxx's "Giga Kaleidoscope Modularized Trading System"?
The Giga Kaleidoscope Modularized Trading System is a trading system built on the philosophy of the NNFX (No Nonsense Forex) algorithmic trading.
What is the NNFX algorithmic trading strategy?
The NNFX (No-Nonsense Forex) trading system is a comprehensive approach to Forex trading that is designed to simplify the process and remove the confusion and complexity that often surrounds trading. The system was developed by a Forex trader who goes by the pseudonym "VP" and has gained a significant following in the Forex community.
The NNFX trading system is based on a set of rules and guidelines that help traders make objective and informed decisions. These rules cover all aspects of trading, including market analysis, trade entry, stop loss placement, and trade management.
Here are the main components of the NNFX trading system:
1. Trading Philosophy: The NNFX trading system is based on the idea that successful trading requires a comprehensive understanding of the market, objective analysis, and strict risk management. The system aims to remove subjective elements from trading and focuses on objective rules and guidelines.
2. Technical Analysis: The NNFX trading system relies heavily on technical analysis and uses a range of indicators to identify high-probability trading opportunities. The system uses a combination of trend-following and mean-reverting strategies to identify trades.
3. Market Structure: The NNFX trading system emphasizes the importance of understanding the market structure, including price action, support and resistance levels, and market cycles. The system uses a range of tools to identify the market structure, including trend lines, channels, and moving averages.
4. Trade Entry: The NNFX trading system has strict rules for trade entry. The system uses a combination of technical indicators to identify high-probability trades, and traders must meet specific criteria to enter a trade.
5. Stop Loss Placement: The NNFX trading system places a significant emphasis on risk management and requires traders to place a stop loss order on every trade. The system uses a combination of technical analysis and market structure to determine the appropriate stop loss level.
6. Trade Management: The NNFX trading system has specific rules for managing open trades. The system aims to minimize risk and maximize profit by using a combination of trailing stops, take profit levels, and position sizing.
Overall, the NNFX trading system is designed to be a straightforward and easy-to-follow approach to Forex trading that can be applied by traders of all skill levels.
Core components of an NNFX algorithmic trading strategy
The NNFX algorithm is built on the principles of trend, momentum, and volatility. There are six core components in the NNFX trading algorithm:
1. Volatility - price volatility; e.g., Average True Range, True Range Double, Close-to-Close, etc.
2. Baseline - a moving average to identify price trend
3. Confirmation 1 - a technical indicator used to identify trends
4. Confirmation 2 - a technical indicator used to identify trends
5. Continuation - a technical indicator used to identify trends
6. Volatility/Volume - a technical indicator used to identify volatility/volume breakouts/breakdown
7. Exit - a technical indicator used to determine when a trend is exhausted
What is Volatility in the NNFX trading system?
In the NNFX (No Nonsense Forex) trading system, ATR (Average True Range) is typically used to measure the volatility of an asset. It is used as a part of the system to help determine the appropriate stop loss and take profit levels for a trade. ATR is calculated by taking the average of the true range values over a specified period.
True range is calculated as the maximum of the following values:
-Current high minus the current low
-Absolute value of the current high minus the previous close
-Absolute value of the current low minus the previous close
ATR is a dynamic indicator that changes with changes in volatility. As volatility increases, the value of ATR increases, and as volatility decreases, the value of ATR decreases. By using ATR in NNFX system, traders can adjust their stop loss and take profit levels according to the volatility of the asset being traded. This helps to ensure that the trade is given enough room to move, while also minimizing potential losses.
Other types of volatility include True Range Double (TRD), Close-to-Close, and Garman-Klass
What is a Baseline indicator?
The baseline is essentially a moving average, and is used to determine the overall direction of the market.
The baseline in the NNFX system is used to filter out trades that are not in line with the long-term trend of the market. The baseline is plotted on the chart along with other indicators, such as the Moving Average (MA), the Relative Strength Index (RSI), and the Average True Range (ATR).
Trades are only taken when the price is in the same direction as the baseline. For example, if the baseline is sloping upwards, only long trades are taken, and if the baseline is sloping downwards, only short trades are taken. This approach helps to ensure that trades are in line with the overall trend of the market, and reduces the risk of entering trades that are likely to fail.
By using a baseline in the NNFX system, traders can have a clear reference point for determining the overall trend of the market, and can make more informed trading decisions. The baseline helps to filter out noise and false signals, and ensures that trades are taken in the direction of the long-term trend.
What is a Confirmation indicator?
Confirmation indicators are technical indicators that are used to confirm the signals generated by primary indicators. Primary indicators are the core indicators used in the NNFX system, such as the Average True Range (ATR), the Moving Average (MA), and the Relative Strength Index (RSI).
The purpose of the confirmation indicators is to reduce false signals and improve the accuracy of the trading system. They are designed to confirm the signals generated by the primary indicators by providing additional information about the strength and direction of the trend.
Some examples of confirmation indicators that may be used in the NNFX system include the Bollinger Bands, the MACD (Moving Average Convergence Divergence), and the MACD Oscillator. These indicators can provide information about the volatility, momentum, and trend strength of the market, and can be used to confirm the signals generated by the primary indicators.
In the NNFX system, confirmation indicators are used in combination with primary indicators and other filters to create a trading system that is robust and reliable. By using multiple indicators to confirm trading signals, the system aims to reduce the risk of false signals and improve the overall profitability of the trades.
What is a Continuation indicator?
In the NNFX (No Nonsense Forex) trading system, a continuation indicator is a technical indicator that is used to confirm a current trend and predict that the trend is likely to continue in the same direction. A continuation indicator is typically used in conjunction with other indicators in the system, such as a baseline indicator, to provide a comprehensive trading strategy.
What is a Volatility/Volume indicator?
Volume indicators, such as the On Balance Volume (OBV), the Chaikin Money Flow (CMF), or the Volume Price Trend (VPT), are used to measure the amount of buying and selling activity in a market. They are based on the trading volume of the market, and can provide information about the strength of the trend. In the NNFX system, volume indicators are used to confirm trading signals generated by the Moving Average and the Relative Strength Index. Volatility indicators include Average Direction Index, Waddah Attar, and Volatility Ratio. In the NNFX trading system, volatility is a proxy for volume and vice versa.
By using volume indicators as confirmation tools, the NNFX trading system aims to reduce the risk of false signals and improve the overall profitability of trades. These indicators can provide additional information about the market that is not captured by the primary indicators, and can help traders to make more informed trading decisions. In addition, volume indicators can be used to identify potential changes in market trends and to confirm the strength of price movements.
What is an Exit indicator?
The exit indicator is used in conjunction with other indicators in the system, such as the Moving Average (MA), the Relative Strength Index (RSI), and the Average True Range (ATR), to provide a comprehensive trading strategy.
The exit indicator in the NNFX system can be any technical indicator that is deemed effective at identifying optimal exit points. Examples of exit indicators that are commonly used include the Parabolic SAR, the Average Directional Index (ADX), and the Chandelier Exit.
The purpose of the exit indicator is to identify when a trend is likely to reverse or when the market conditions have changed, signaling the need to exit a trade. By using an exit indicator, traders can manage their risk and prevent significant losses.
In the NNFX system, the exit indicator is used in conjunction with a stop loss and a take profit order to maximize profits and minimize losses. The stop loss order is used to limit the amount of loss that can be incurred if the trade goes against the trader, while the take profit order is used to lock in profits when the trade is moving in the trader's favor.
Overall, the use of an exit indicator in the NNFX trading system is an important component of a comprehensive trading strategy. It allows traders to manage their risk effectively and improve the profitability of their trades by exiting at the right time.
How does Loxx's GKD (Giga Kaleidoscope Modularized Trading System) implement the NNFX algorithm outlined above?
Loxx's GKD v1.0 system has five types of modules (indicators/strategies). These modules are:
1. GKD-BT - Backtesting module (Volatility, Number 1 in the NNFX algorithm)
2. GKD-B - Baseline module (Baseline and Volatility/Volume, Numbers 1 and 2 in the NNFX algorithm)
3. GKD-C - Confirmation 1/2 and Continuation module (Confirmation 1/2 and Continuation, Numbers 3, 4, and 5 in the NNFX algorithm)
4. GKD-V - Volatility/Volume module (Confirmation 1/2, Number 6 in the NNFX algorithm)
5. GKD-E - Exit module (Exit, Number 7 in the NNFX algorithm)
(additional module types will added in future releases)
Each module interacts with every module by passing data between modules. Data is passed between each module as described below:
GKD-B => GKD-V => GKD-C(1) => GKD-C(2) => GKD-C(Continuation) => GKD-E => GKD-BT
That is, the Baseline indicator passes its data to Volatility/Volume. The Volatility/Volume indicator passes its values to the Confirmation 1 indicator. The Confirmation 1 indicator passes its values to the Confirmation 2 indicator. The Confirmation 2 indicator passes its values to the Continuation indicator. The Continuation indicator passes its values to the Exit indicator, and finally, the Exit indicator passes its values to the Backtest strategy.
This chaining of indicators requires that each module conform to Loxx's GKD protocol, therefore allowing for the testing of every possible combination of technical indicators that make up the six components of the NNFX algorithm.
What does the application of the GKD trading system look like?
Example trading system:
Backtest: Strategy with 1-3 take profits, trailing stop loss, multiple types of PnL volatility, and 2 backtesting styles
Baseline: Hull Moving Average
Volatility/Volume: Hurst Exponent
Confirmation 1: Blau Ergodic Candlestick Index as shown on the chart above
Confirmation 2: Williams Percent Range
Continuation: Fisher Transform
Exit: Rex Oscillator
Each GKD indicator is denoted with a module identifier of either: GKD-BT, GKD-B, GKD-C, GKD-V, or GKD-E. This allows traders to understand to which module each indicator belongs and where each indicator fits into the GKD protocol chain.
Giga Kaleidoscope Modularized Trading System Signals (based on the NNFX algorithm)
Standard Entry
1. GKD-C Confirmation 1 Signal
2. GKD-B Baseline agrees
3. Price is within a range of 0.2x Volatility and 1.0x Volatility of the Goldie Locks Mean
4. GKD-C Confirmation 2 agrees
5. GKD-V Volatility/Volume agrees
Baseline Entry
1. GKD-B Baseline signal
2. GKD-C Confirmation 1 agrees
3. Price is within a range of 0.2x Volatility and 1.0x Volatility of the Goldie Locks Mean
4. GKD-C Confirmation 2 agrees
5. GKD-V Volatility/Volume agrees
6. GKD-C Confirmation 1 signal was less than 7 candles prior
Continuation Entry
1. Standard Entry, Baseline Entry, or Pullback; entry triggered previously
2. GKD-B Baseline hasn't crossed since entry signal trigger
3. GKD-C Confirmation Continuation Indicator signals
4. GKD-C Confirmation 1 agrees
5. GKD-B Baseline agrees
6. GKD-C Confirmation 2 agrees
1-Candle Rule Standard Entry
1. GKD-C Confirmation 1 signal
2. GKD-B Baseline agrees
3. Price is within a range of 0.2x Volatility and 1.0x Volatility of the Goldie Locks Mean
Next Candle:
1. Price retraced (Long: close < close or Short: close > close )
2. GKD-B Baseline agrees
3. GKD-C Confirmation 1 agrees
4. GKD-C Confirmation 2 agrees
5. GKD-V Volatility/Volume agrees
1-Candle Rule Baseline Entry
1. GKD-B Baseline signal
2. GKD-C Confirmation 1 agrees
3. Price is within a range of 0.2x Volatility and 1.0x Volatility of the Goldie Locks Mean
4. GKD-C Confirmation 1 signal was less than 7 candles prior
Next Candle:
1. Price retraced (Long: close < close or Short: close > close )
2. GKD-B Baseline agrees
3. GKD-C Confirmation 1 agrees
4. GKD-C Confirmation 2 agrees
5. GKD-V Volatility/Volume Agrees
PullBack Entry
1. GKD-B Baseline signal
2. GKD-C Confirmation 1 agrees
3. Price is beyond 1.0x Volatility of Baseline
Next Candle:
1. Price is within a range of 0.2x Volatility and 1.0x Volatility of the Goldie Locks Mean
3. GKD-C Confirmation 1 agrees
4. GKD-C Confirmation 2 agrees
5. GKD-V Volatility/Volume Agrees
█ GKD-C Blau Ergodic Candlestick Index
What is Blau Ergodic Candlestick Index?
The Blau Ergodic CSI-Oscillator is a technical analysis indicator developed by William Blau and described in his book “Momentum, Direction, and Divergence: Applying the Latest Momentum Indicators for Technical Analysis”. It is based on the Candlestick Index (CSI), which measures the difference between the current close price and the open price of a certain number of bars ago. The values of the CSI are normalized by the price range and mapped into the interval.
The Ergodic CSI-Oscillator is calculated using the following formula:
Ergodic_CSI(price1,price2,q,r,s,u) = CSI(price1,price2,q,r,s,u)
SignalLine(price1,price2,q,r,s,u,ul) = EMA(Ergodic_CSI(price1,price2,q,r,s,u),ul)
where:
- Ergodic_CSI(): Ergodic - Candlestick Index CSI(price1,price2,q,r,s,u)
- SignalLine(): Signal Line - exponentially smoothed moving average EMA(ul), applied to Ergodic
- ul: period of a signal line ¹.
The input parameters for this indicator are:
- q: number of bars used in calculation of Candlestick Momentum (default value is 1)
- r: period of the first EMA applied to Candlestick Momentum (default value is 20)
- s: period of the second EMA applied to result of the first smoothing (default value is 5)
- u: period of the third EMA applied to result of the second smoothing (default value is 3)
- ul: period of the Signal Line - EMA(ul), applied to Ergodic (default value is 3)
- AppliedPrice1: price type (default value is PRICE_CLOSE)
- AppliedPrice2: price type (default value is PRICE_OPEN) ¹.
I hope this information helps you understand what Blau Ergodic CSI-Oscillator is and how it works.
(2) William Blau's Indicators and Trading Systems in MQL5. Part 1 .... www.mql5.com Accessed 4/6/2023.
(3) Ergodic CSI-Oscillator Blau_Ergodic_CSI – indicator for MetaTrader 5. www.forexmt4indicators.com Accessed 4/6/2023.
(4) Free download of the 'Ergodic CSI-Oscillator Blau_Ergodic_CSI .... www.mql5.com Accessed 4/6/2023.
Requirements
Inputs
Confirmation 1 and Solo Confirmation: GKD-V Volatility / Volume indicator
Confirmation 2: GKD-C Confirmation indicator
Outputs
Confirmation 2 and Solo Confirmation Complex: GKD-E Exit indicator
Confirmation 1: GKD-C Confirmation indicator
Continuation: GKD-E Exit indicator
Solo Confirmation Simple: GKD-BT Backtest strategy
Additional features will be added in future releases.
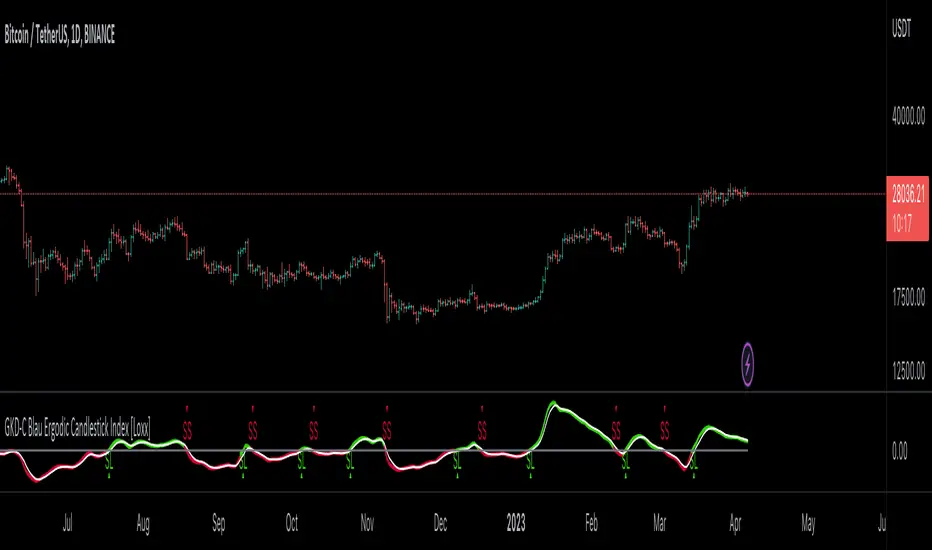
APIBridge Candlestick Reversal SystemStrategy Premise
This strategy uses the Wick Reversal System introduced in Pivot Boss and generates signals based on Candlestick Patterns.
– Wick Reversal System
– Extreme Reversal System
– Outside Reversal System
– Doji Reversal System
Wick Reversal System:
1. For a Bullish reversal wick to exist, the close of the bar should fall within the top 35% of the overall range of the candle.
2. For a bearish reversal wick to exist, the close of the bar should fall within the bottom 35% of the overall range of the candle.
Extreme Reversal System:
1. The first bar of the pattern is about two times larger than the average size of the candles in the look-back period.
2. The body of the first bar of the pattern should encompass more than 50% of the bar’s total range, but usually not more than 85%.
3. The second bar of the pattern opposes the first. If the first bar of the pattern is bullish (C > 0), then the second bar must be bearish (C < 0). If the first bar is bearish (C < 0), then the second bar must be bullish (C > 0).
Outside Reversal System:
1. The Engulfing bar of a bullish outside reversal setup has a low that is below the prior bar’s low (L < L) and a close that is above the prior bar’s high (C > H).
2. The Engulfing bar of a bearish outside reversal setup has a high that is above the prior bar’s high (H > H) and a close that is below the prior bar’s low (C < L).
3. The Engulfing bar is usually 5 to 25 percent larger than the size of the average bar in the look-back period.
Doji Reversal System:
1. The open and close prices of the Doji should fall within 10 percent of each other, as measured by the total range of the Candlestick .
2. For a Bullish Doji , the high of the Doji Candlestick should be below the ten-period Simple Moving Average (H SMA (10)).
4. For a Bearish Doji , one of the two bars following the Doji must close beneath the low of the Doji (C < L or C < L).
5. For a Bullish Doji setup, one of the two bars following the Doji must close above the high of the Doji (C > H) or C > H)
Strategy Logic
Long Entry:
When Low Pivot Point and Wick Reversal System and Bullish Wick Reversal Setup Pattern Send, LE
OR When Low Pivot Point and Extreme Reversal System and Bullish Extreme Reversal setup Send ,LE
OR When Low Pivot Point and Outside Reversal System and Bullish Outside Reversal Setup Send LE
OR When Low Pivot Point and Doji Reversal System and Bullish Doji Reversal Setup Send, LE
Long Exit:
Either when SL or Target is hit. If SL/ TGT is not hit and
When High Pivot Point and Wick Reversal System and Bearish Wick Reversal Setup Pattern Send LXSE
OR When High Pivot Point Extreme Reversal System and Bearish Extreme Reversal setup Send LXSE
OR When High Pivot Point Outside Reversal System and Bearish Outside Reversal Setup Send LXSE
OR When High Pivot Point Doji Reversal System and Bearish Doji Reversal Setup Send, LXSE
Short Entry:
When High Pivot Point and Wick Reversal System and Bearish Wick Reversal Setup Pattern Send SE
OR When High Pivot Point Extreme Reversal System and Bearish Extreme Reversal setup Send SE
OR When High Pivot Point Outside Reversal System and Bearish Outside Reversal Setup Send SE
OR When High Pivot Point Doji Reversal System and Bearish Doji Reversal Setup Send, SE
Short Exit:
Either when SL or Target is hit. If SL/ TGT is not hit and
When Low Pivot Point and Wick Reversal System and Bullish Wick Reversal Setup Pattern Send, SXLE
OR When Low Pivot Point and Extreme Reversal System and Bullish Extreme Reversal setup Send ,SXLE
OR When Low Pivot Point and Outside Reversal System and Bullish Outside Reversal Setup Send SXLE
OR When Low Pivot Point and Doji Reversal System and Bullish Doji Reversal Setup Send, SXLE
Candlestick Reversal System Algo Strategy Parameters for TradingView Charts
1.Length: This is number of bars used to calculated Ex: 14 à previous 14 candles are used
2.Backtesting : Use this to backtest the strategy between Starting and Ending Date and time , it can also be used to set trades in future time
3.Alert_Message : Need to copy while creating alert into Message Box
4.Trade Setup : Intraday / Positional (Selecct accordingly)
5.Start Time Stop Time (Session 1) : Intraday / Positional start time and end time of trade for session 1
6.End Session 1 : Define time to exit any existing position taken in session 1 so that exchange charges will not apply
7.Use Second Session : Check this to use second intraday session
8.Start Time Stop Time (Session 2) : Intraday / Positional start time and end time of trade for session 2
9.End Session 1 : Define time to exit any existing position taken in session 2 so that exchange charges will not apply
10.Use Target : check if you want to set required target if not cheque will not applicable
11.Use StopLoss : Cheque if you want to set stop loss if not cheque will not applicable
12.Trailling Stoploss : Cheque if you want to set trailing stop loss if not cheque will not applicable
13.Point Or Percentage For TG SL : Use Points or Percentage as per your choice
14.Target : Set as per the selection of (Point Or Percentage For TG SL)
15.Stop Loss : Set as per the selection of (Point Or Percentage For TG SL)
16.TSL_Type : Select as per your logic in %/ATR/Points
17.TSL_Input : Set in case you select %/Points in TSL_Type
18.ATR Length : Set as per your logic if you select ATR in the field of TSL_Type
19.ATR_Mult : Set as per your logic if you select ATR in the field of TSL_Type
20.Segment : Select segment of your logic EQ/FUTIDX/FUTSTK/OPTIDX/OPTSTK/FUTCUR/FUTCUM (Used in case of option / Futures )
21.Select Expiry Date : Select the expiry date of your trade as per the segment you selected (Used in case of option / Futures )
22.Select Expiry Month : Select the expiry Month of your trade as per the segment you selected (Used in case of option / Futures )
23.Year : Select the expiry Year of your trade as per the segment you selected (Used in case of option / Futures )
24.Quantity : Enter the quantity in which you want to trade (Used in case of option / Futures )
25.Product Type : Select MIS/Normal/ CNC as per your logic (Used in case of option / Futures )
26.Order Type : Select Market/Limit as per your logic (Used in case of option / Futures )
27.Strategy Tag : Enter the value in case you are using webhook / advance template in APIBridgeTM
28.Lotsize : Enter the lotsize as per your lotic and quentity selection (Used in case of option / Futures )
29.STEP (OTM/ATM/ ITM ) : Select OTM(+1)/ATM(0)/ ITM (-1) as per your logic works in case of options only
30.DIFFERENCE_BETWEEN 2 STRIKE : Select difference of 2 strikes you have used in APIBridge symbol setting list, like for Nifty 50 BankNifty 100
31.APIB Port : Set as per provided to you by Algoji in case of webhook / advance templet
The Segment full form is given below
EQ Equity
FUTIDX Future Index
FUTSTK Future Stock
OPTIDX Index Option
OPTSTK Stock Option
FUTCUR Futcur Currency
FUTCUM Future Commodity
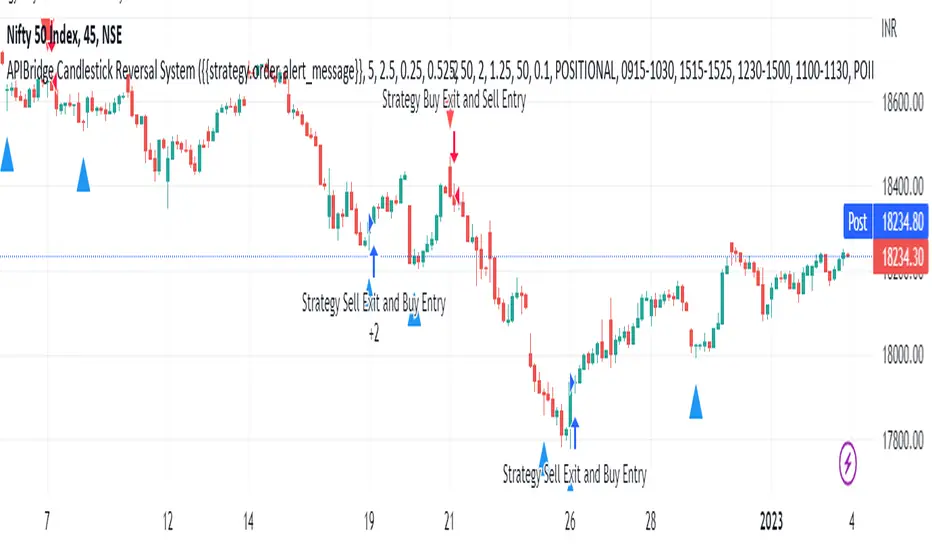
BH - Candlestick Pattern DetectionThis is a script to help the beginners locate the candle patterns. It has a nice code that can be used in other scripts too. Easy to use with separated functions, simple patterns and complex patterns detections.
I have done some updates at the Candlestick Patterns Identified script by @repo32. Was a good start of my ideia. Tks for sharing repo.
It will be always under constant development but I want to share this first version to know what can be done to get better, improve, get more desired patterns, know what are you guys using that could be helpful.
I still need to check if all patterns are correct.
Any comments, help and suggestions will be appreciated.
Marcos Issler @ Isslerman
