No Wick Bull/Bear Candlesticks with Arrow premiumNo Wick Bull/Bear Candlesticks with Arrow premium
This script is for a custom trading indicator called "No Wick Bull/Bear Candlesticks with Arrow premium" developed by ClearTradingMind. It is designed for use with trading platforms that support scripting, such as TradingView. This indicator combines several technical analysis tools to help traders identify potential buy and sell signals in a financial market.
Key Components of the Indicator:
Moving Average (MA): The script allows users to select from various types of moving averages (SMA, EMA, HMA, etc.), which smooth out price data to identify trends. Users can set the length and type of the moving average.
Upper and Lower Bands: These bands are set at a specified deviation percentage above and below the chosen moving average. They help in identifying overbought and oversold conditions.
No Wick Bull/Bear Candlestick Identification:
Bullish Condition: A bullish candlestick is identified when the closing price is higher than the opening price, the low equals the open, and the close is above the moving average.
Bearish Condition: A bearish candlestick is identified when the closing price is lower than the opening price, the high equals the open, and the close is below the moving average.
No Wick: These conditions also imply that the candlesticks have no wicks, suggesting strong buying or selling pressure.
Arrows for Trading Signals:
No lower wick bull bar
No upper wick bear bar
When a bullish condition is met, a green upward-pointing triangle is plotted below the candlestick, indicating a potential buy signal.
When a bearish condition is met, a red downward-pointing triangle is plotted above the candlestick, indicating a potential sell signal.
EMA 20: An additional Exponential Moving Average with a length of 20 periods is plotted for further trend analysis.
Background Color Changes: The script changes the background color to blue if the EMA 20 is above the upper band, and to red if it is below the lower band, providing visual cues about the market trend.
How It Works:
Traders can input their preferences for the moving average type and length, source of the MA (like closing prices), and the deviation percentage for the bands.
The script then calculates the moving average, upper and lower bands, and checks for bullish or bearish candlestick conditions without wicks.
When such conditions are met, it plots arrows to suggest buy or sell signals.
The EMA 20 and background color changes offer additional trend information.
Usage:
This indicator is particularly useful in markets with clear trends. The no wick bull/bear candlesticks indicate strong buying or selling pressure, and the arrows provide clear visual signals for traders to consider entering or exiting positions. As with all trading indicators, it's recommended to use this tool in conjunction with other forms of analysis to confirm trading signals.
Recherche dans les scripts pour "Candlestick"

Oscillator CandlesticksI've always wondered why we don't use candlesticks for oscillators...then I stopped wondering and made an oscillator with candlesticks.
The following oscillators are available as a proof of concept:
* Consumer Channel Index (CCI)
* Rate of Change (ROC)
* Relative Strength Index (RSI)
* Trend Strength Index (TSI)
You can add a moving average to the ohlc4 value of the oscillator and choose the type of the moving average and whether it should be influenced by volume.

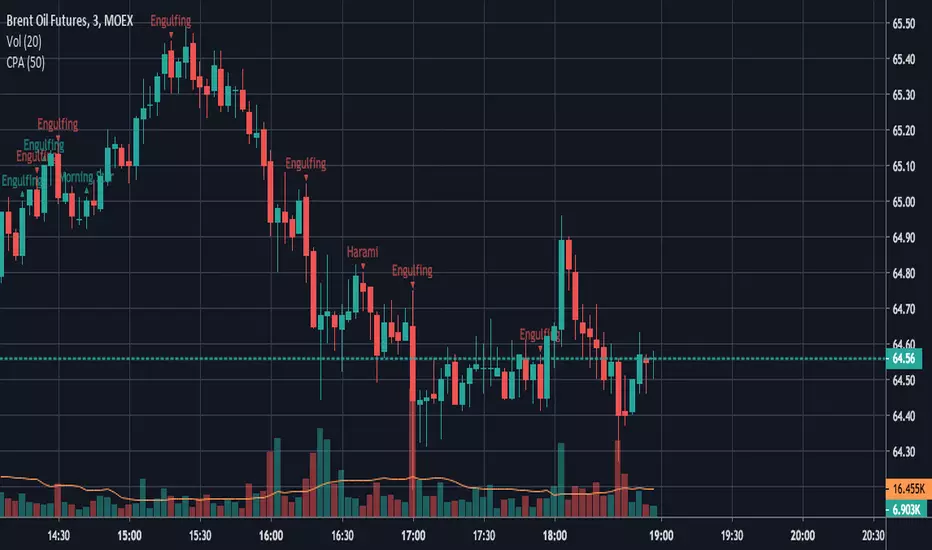
PB Candlestick PatternsUsing PB Candlestick Patterns, you can automatically identify 1 and 2 candlesticks patterns to help determine the current trend
The signals appear in Red and Green to denote for bearish (Red) bullish (Green).
This indicator automatically displays the following patterns on the chart.
Harami
Harami Cross
Morning Star
Engulfing
Hammer
Gravestone
Piercing Line
This is different to the existing open source indicator available on the marketplace for the following reasons:
* Identify's and displays more candlestick patterns
* Automatically displays only a specific set of candlestick patterns relevant to our Elliott Wave Indicator Strategy
* Labels reveal the whole name, not an abbreviation
This will be available soon to lease from us.
This indicator is to be used in conjunction with our Elliott Wave Indicator but to know more information about this indicator or when it will be available to lease, send us a DM

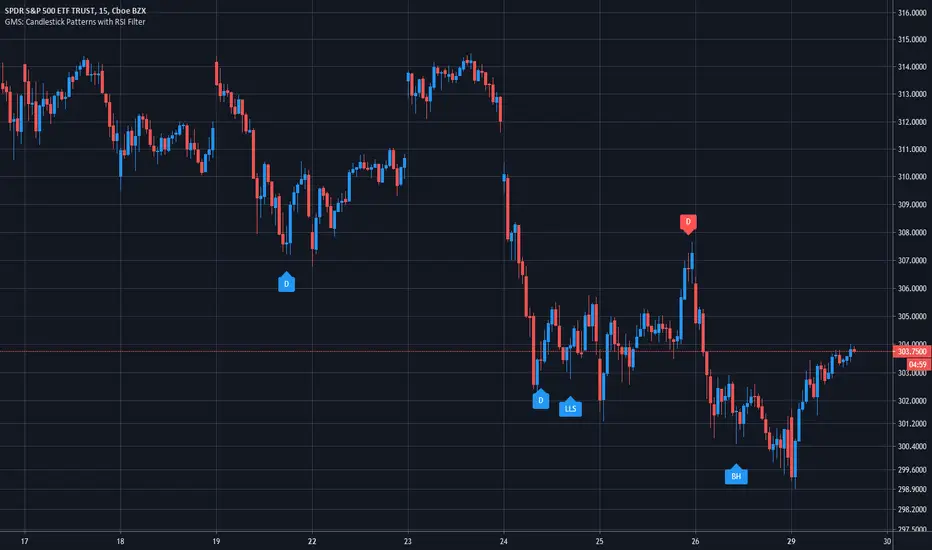
GMS: Candlestick Patterns with RSI FilterI wanted to apply an RSI filter to some of the new Candlestick Patterns (in the indicators tab) since some of them looked to be quite effective for picking reversals. Turns out it's a pretty good pairing.
You can modify the RSI length in addition to the upper and lower thresholds. I also added in check boxes to combine different bullish and bearish patterns.
The candlestick patterns included are:
1. Long Upper Shadow
2. Long Lower Shadow
3. Doji
4. Bullish Harami
5. Bearish Harami
6. Bullish Engulfing
7. Bearish Engulfing
Hope it helps!
Andre
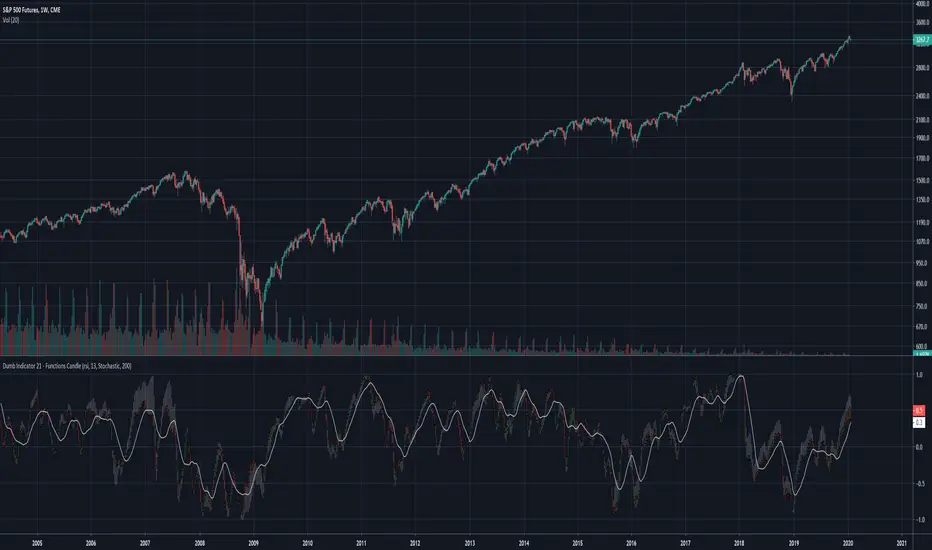
Dumb Indicator 21 - Function's Candlestick Bar's StyleThe idea is help traders to see the patterns and levels from a different point o view.
This script create candlestick using the opening, high, low and close price as source on your favorite function.
It's very simple to use:
Select a function in the drop box list, the number of bars length, check or uncheck the boxes to treat source as logarithm, smooth, and if you want to plot the SMA from the results.
To make a deeper analysis, you can select to plot the candles in Stochastic or in Percent Rank way.
The Stochastic and Percent Rank plot will show how far the price is close to highest or lowest value of the source from the last "Stochastic Length" number of bars.
Some functions with different names can plot the same results.
This indicator works on every kind of market, but you will need to find the best function and length to use.
Please, if you find anything good with this, share to everyone.
GOLDEN BULLETCandlestick Pattern Finder
Bullish Hammer
Bearish Hammer
Bullish Engulfing
Bearish Engulfing
Bullish Harami
Bearish Harami


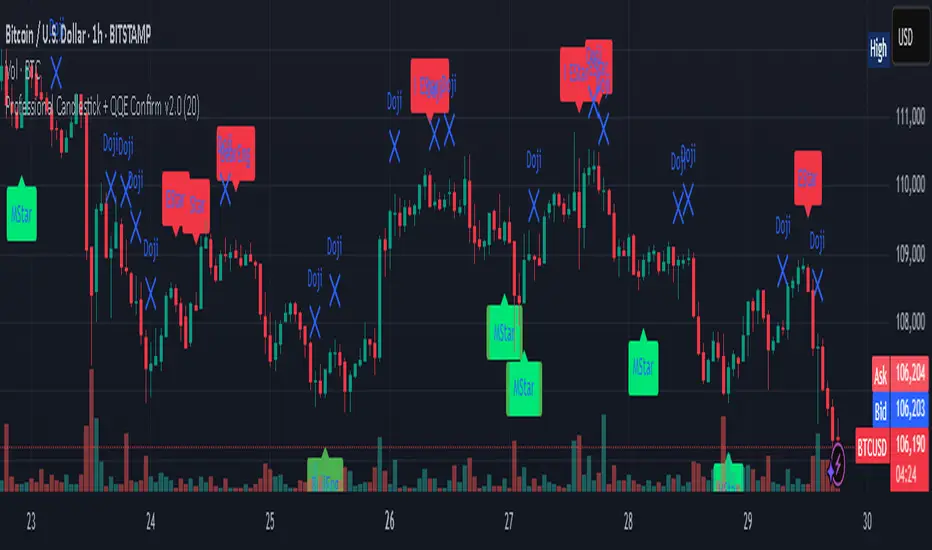
Professional Candlestick + QQE Confirm v2.0 Professional Candlestick + QQE Confirm v1.0
This script combines powerful candlestick pattern detection with QQE momentum confirmation to improve signal reliability for swing trading and trend entries.
🔍 What It Does:
- Detects high-probability candlestick patterns (e.g. Pin Bars, Engulfing, Morning/Evening Stars)
- Confirms signals with the QQE indicator to reduce false entries
- Highlights buy/sell zones using combined logic
⚙️ Key Features:
- Multiple candlestick patterns, each toggleable
- QQE filtering to confirm valid breakouts or reversals
- Signal labels with strength grading
- Optional alert settings
📊 Best Use:
- Works well on 1H, 4H, and Daily charts
- Combine with trendlines or support/resistance for stronger entries
- Avoids signals in sideways/choppy markets
---
This is a tool for traders who want to filter out weak candlestick signals using a trusted momentum indicator (QQE) for more accurate entries.
Bullish and Bearish Candlestick Patterns StrategyThe strategy is a combination of candlestick pattern analysis and Fibonacci retracement levels to identify potential buy and sell signals in the market. Here's how the strategy works and how you can trade accordingly:
Candlestick Pattern Analysis:
The strategy looks for specific bullish and bearish candlestick patterns to identify potential trend reversals or continuations. The bullish patterns include:
Bullish Engulfing: This pattern occurs when a bullish candle fully engulfs the previous bearish candle.
Hammer: It is a single candlestick pattern with a small body and a long lower wick, indicating a potential bullish reversal.
Morning Star: This pattern consists of three candles, with the middle one being a small-bodied candle that gaps down and the other two being bullish candles.
The bearish patterns include:
Bearish Engulfing: Similar to the bullish engulfing, but this time, a bearish candle fully engulfs the previous bullish candle.
Shooting Star: A single candlestick pattern with a small body and a long upper wick, suggesting a potential bearish reversal.
Evening Star: This pattern is the opposite of the morning star, with a small-bodied candle that gaps up between two bearish candles.
Fibonacci Retracement Levels:
The strategy uses Fibonacci retracement levels to determine potential support and resistance levels in the market. The main level considered in this strategy is the Fibonacci 0.5 level, which is the midpoint of the previous swing move.
Trading Accordingly:
To trade using this strategy, follow these steps:
a. Observe the Chart: Apply the indicator to your preferred chart, and observe the candlestick patterns and the plotted support, resistance, and Fibonacci 0.5 levels.
b. Buy Signal: A buy signal is generated when any of the bullish candlestick patterns (Bullish Engulfing, Hammer, Morning Star) occur, and the low price of the current candle is above or equal to the Fibonacci 0.5 level. This suggests a potential bullish reversal or continuation of an existing uptrend.
c. Sell Signal: A sell signal is generated when any of the bearish candlestick patterns (Bearish Engulfing, Shooting Star, Evening Star) occur, and the high price of the current candle is below or equal to the Fibonacci 0.5 level. This indicates a potential bearish reversal or continuation of an existing downtrend.
d. Risk Management: Place stop-loss orders to protect your position in case the market moves against your trade. Consider setting the stop-loss below the recent swing low for buy trades and above the recent swing high for sell trades.
e. Take Profit: Set a target for taking profits based on your risk-reward ratio. You can use the recent swing high for buy trades as a potential target and the recent swing low for sell trades.
f. Filter Signals: Keep in mind that not all signals will result in profitable trades. It's essential to filter signals with other technical analysis tools and consider the overall market context.
Remember that no trading strategy guarantees profits, and trading always carries inherent risks. It's crucial to practice proper risk management, use appropriate position sizing, and test the strategy thoroughly in a demo environment before applying it to live trading. Additionally, consider combining this strategy with other indicators or analysis methods to make more informed .

Trend lines + Pivot Levels + Candlestick PatternsThis is a pure PRICE ACTION indicator that will show you possible trend lines, pivot lines and candlestick patterns at once.
it has been designed to determine upper and lower trend lines in the chart and you can set candlestick patterns on them with alerts!
it means that you add the indicator to the chart and set the alert and done!
whenever a pinbar or engulf or breakout(in both directions) happens, you will be notified by alerts.
you also have pivot lines on the chart by this indicator. you can set the candlesticks on pivots instead of trend lines, so if you are a fan of support and resistance you can have this one, it depends on you.
all of the pivots and trend lines and also the candle sticks are customizable, so you can exactly select the pinbar, engulfing or breakout candle that matches with your mindset. for example you can set a pinbar that long shadow is 4 times or 3 times greater than the body, it's on you.
you can also customize trendlines or pivot lines, if you are scalper you can set it to small trend lines and if you are day trader or long term trader you can set it to the number that fits with your strategy.
trends and pivots will be updated automatically and there is no need to set it every time.
Be PROFITABLE!
$kMagician /*

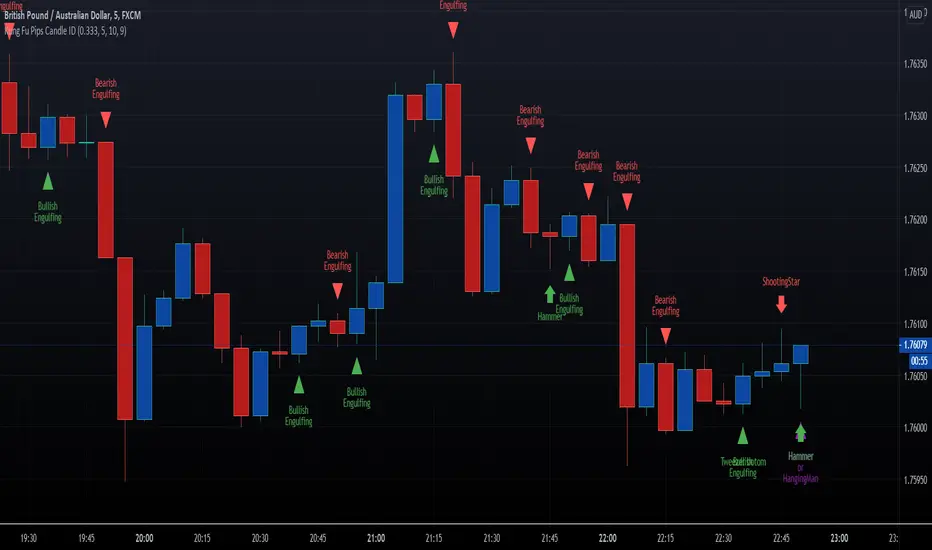
HFX Kung Fu Pips Candlestick Identifier by Trader ZThis indicator identifies the following candle stick patterns:
Bullish and Bearish Engulfing
Hammer/Hanging Man, Shooting Star
Tweezer Tops and Bottoms
Doji Star
Doji Gravestone
Made for trading Forex Binary Options but can be used in any market. When the candlestick pattern emerges the script will label the pattern. A helpful visual tool for your analysis.
Enjoy!!!!
Reversal Candlestick Pattern Detector// Name: Reversal Candlestick Pattern Detector
// Condition:
// 1-up move: last n candles, 3/5 move higher; and/or the last is the highest in past n bars
// 2-down move: last n candles, 3/5 move lower; and/or the last is the lowest in past n bars
//
// Show Bullish reversal pattern in down move; Show Bearish reversal pattern in up move;
//
//Reversal candlestick patterns:
//1. Hammer/Shooting Star,
//2. Engulfing,
//3. Morning/Evening Star,
//4. Harami, --Also Harami could be used in continuation (Rally based Rally/Drop based Drop);
//5. Piercing/Dark Cloud cover,
//6. Hook Reversal
//7. Breakaway Gap, or Gap Crosses SMA8, SMA50. This is for un-filled Gap only. low >high or high

High Performance Candlestick Patterns Colors//Candle Patterns Ranked by Performance THOMAS N. BULKOWSKI
//1. Bearish Three Line Strike +Up 67.38%
//2. Bullish Three Line Strike -Down 65.23%
//3. Bearish Three Black Crows -Down 59.83%
//4. Bearish Evening Star -Down 55.85%
//5. Bullish Upside Tasuki Gap +Up 54.44%
//6. Bullish Inverted Hammer -Down 51.73%
//7. Bullish Matching Low -Down 50.00%
//8. Bullish Abandone Baby +Up 49.73%
//9. Bearish Two Black Gapping -Down 49.64%
//10. Brearish Breakaway -Down 49.24%
//11. Bullish Morning Star +Up 49.05%
//12. Bullish Piercing Line +Up 48.37%
//13. Bullish Stick Sandwich +Up 48.20%
//14. Bearish Thrusting Line During Dowtrend +Up 48.10%
//15. Bearish Meeting Line +Up 48.07%
//Down=Yellow Bar Color and Black Text
//Up=Blue Bar Color and Blue Text
//High Performance Candlestick Patterns Colors Top 15

High Performance Candlestick Patterns//Candle Patterns Ranked by Performance THOMAS N. BULKOWSKI
//1. Bearish Three Line Strike +Up 67.38%
//2. Bullish Three Line Strike -Down 65.23%
//3. Bearish Three Black Crows -Down 59.83%
//4. Bearish Evening Star -Down 55.85%
//5. Bullish Upside Tasuki Gap +Up 54.44%
//6. Bullish Inverted Hammer -Down 51.73%
//7. Bullish Matching Low -Down 50.00%
//8. Bullish Abandone Baby +Up 49.73%
//9. Bearish Two Black Gapping -Down 49.64%
//10. Brearish Breakaway -Down 49.24%
//11. Bullish Morning Star +Up 49.05%
//12. Bullish Piercing Line +Up 48.37%
//13. Bullish Stick Sandwich +Up 48.20%
//14. Bearish Thrusting Line During Dowtrend +Up 48.10%
//15. Bearish Meeting Line +Up 48.07%
//Down=Yellow Bar Color and Black Text
//Up=Blue Bar Color and Blue Text
//High Performance Candlestick Patterns Top 15

Actually Engulfing CandlesticksThis thing attempts to find price reversals with actually engulfing candlesticks with volume spikes and RSI values as confirmation. It works well on mean reverting assets I guess.
Green dots below bars = bullish reversal
Fuchsia dots above bars = bearish reversal
Have fun!

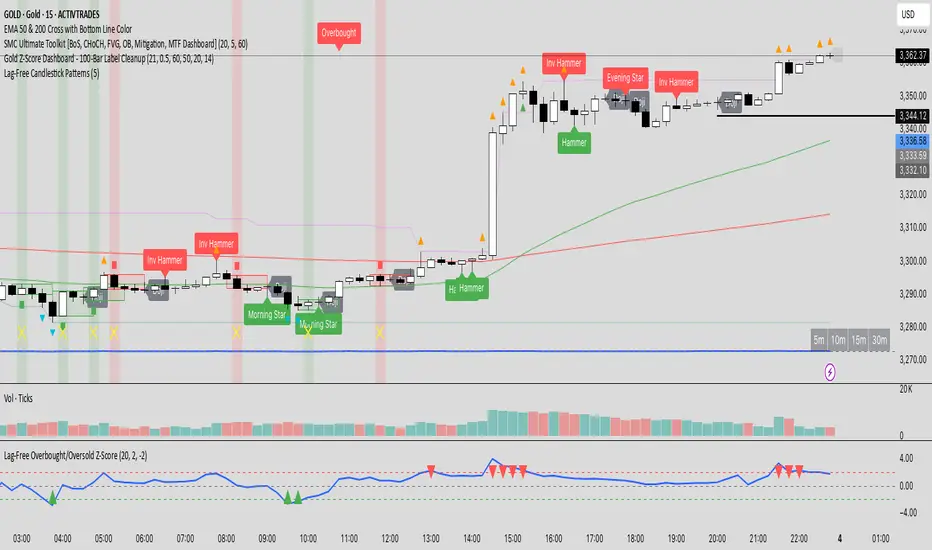
Lag-Free Candlestick Pattern Detector — All-in-One📌 Indicator Name:
Lag-Free Candlestick Pattern Detector — All-in-One
🧾 Description (for Publishing):
This indicator scans the chart for high-probability candlestick reversal patterns using clean, non-repainting logic. It confirms each pattern on bar close and shows signals one bar later to eliminate repainting and improve reliability.
✅ Patterns Detected:
Single-bar patterns:
Hammer / Inverted Hammer
Doji
Shooting Star / Hanging Man
Two-bar patterns:
Bullish & Bearish Engulfing
Bullish & Bearish Harami
Piercing Line / Dark Cloud Cover
Tweezer Top / Bottom
Three-bar patterns:
Morning Star / Evening Star
Three Inside Up / Three Inside Down
🧠 How It Works:
📌 Each pattern is detected using classic candlestick logic derived from open, close, high, and low prices over the past 2–3 bars.
🔁 It uses pivot-based swing detection to locate nearby support and resistance areas.
📈 Bullish signals are only shown near support zones, and bearish signals near resistance, improving signal accuracy.
⚠️ Labels appear on the next candle after confirmation to avoid misleading repainting behavior.
💡 Best Used For:
Spotting key reversal points on any timeframe
Combining with trend or volume filters for strategy development
Training pattern recognition visually on live charts
Volume Impulse & Candlestick Patterns - FontiramisuIndicator showing volume impulse & engulfing candlestick pattern.
You can set up multiple parameter for both events.
Volume Impulse :
Volume Period : Lenght of the average volume calculated.
Volume Multiplier : Factor to compare actual volume with average volume.
Engulfing Pattern :
VS avg body : Let you chose to compare body candle to average body of the last few candles (define with parameter : lenghtSizeAvgBody ), otherwise it will be compared to the last body candle.
Engulfing Multiplier : Factor to compare and validate the pattern.

Fear and Greed Index CandlesticksThis colours the candlesticks based on my 'Fear and Greed Index'.
All calculations are explained in the code.
The index is mainly based upon the components of the popular fear and greed index website. I've annotated the components in the code for you to look at.
If you're interested, you can replace the final variable 'Total' (within the 'barcolor' function at the very end) with any of the final outputs of the subcomponents to see the results of that single part.
Red = Greed
Green = Fear
Enjoy!

Visual Candlestick Blender (Analysis Tool), by @BlueJayBird- This is a analysis tool.
Brief Description
- It generates candlestick containers for current timeframe, using OPEN/HIGH/CLOSE/LOW data from higher time frames.
- Current version supports up to 4 CVB at the same time. Usually using only 2 is enough.
- Vertical extended divisions for 1h, 4h, 1D and 1W using background lines are included too.
* Report any bugs or feedback you have.
NOTE. At current unclosed candlestick , some weird line painting it is expected. It is not a bug, it is a Trading View feature that I haven't been able to solve yet. To solve this, setting the VCB off and then on should be enough.

Candle Patterns AlertCandlestick pattern alerts for strategies "Candle Patterns Strategy" and "Candle Patterns Strategy - 2".
In order not to receive unnecessary signals, in the "Manage alerts" option should be selected "Once per bar close".
IO_CWL IndexCandlestick body and Wick Length Index (CWL)
Shows a trend chart of candle body length and wick length.
Green -> Candle body
Red -> Candle Wick
-- Invsto

Momentum Candlestick TerakhirThis indicator highlights momentum candlesticks based on breakout behavior from previous highs/lows and draws real-time boxes and labels when momentum shifts occur.
It also includes an optional CMP (Current Market Position) table that categorizes price position into Bawah(low), Tengah(mid), Atas(high), or Luar Zone(Outside), with multitimeframe (MTF) logic to assess different timeframes in one view.
Additional features:
• Momentum Box & Label Drawing
• S/R Labeling using Pivot Points
• MTF Momentum & CMP Table Display
• Alerts for Buy/Sell Momentum Candles
Built for traders who rely on visual momentum tracking and want to quickly assess price position in any timeframe.
This script is intended for educational and analytical use only.
for entry, if weekly's current momentum is momentum buy, timeframe h4 also must be momentum buy.
weekly - H4
Daily - H1
H4 - M30
H1 - M15
weekly - 300/500 pips
daily - 100/150 pips
H4 - 70/80 pips
H1 - 20/30 pips

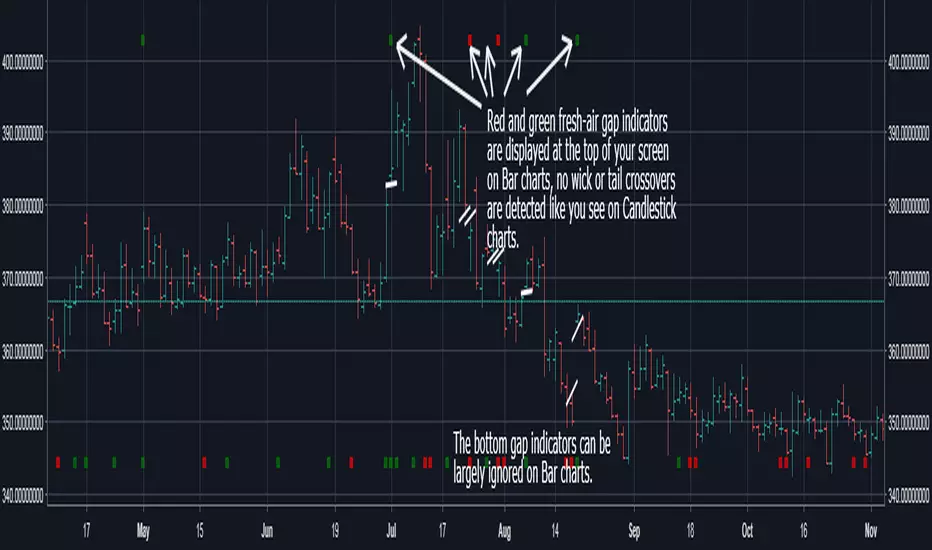
My Simple Gaps with overlay (Bar and Candlestick Charts)Can be used to identify gaps on bar and candlestick charts.
Bar graph gaps shown at top of screen, candlestick gaps shown on bottom of screen.