SP500 retracement imminentLe S&P 500 a probablement besoin de retracer avant de poursuivre plus haut
Une faiblesse progressive commence à apparaître dans la structure. Le marché pourrait aller chercher une zone de liquidité autour de 7007, avant d’engager un retracement plus profond vers le niveau 0.382 de Fibonacci situé

Les meilleures transactions nécessitent de la recherche, puis de l'engagement.
Commencez gratuitement0$ pour toujours, pas besoin de carte de crédit

Scott "Kidd" PoteetL'astronaute de Polaris Dawn

Là où le monde fait vivre les marchés
Rejoignez 100 millions de traders et d'investisseurs qui prennent leur avenir en main.
BRIEFING Semaine #5 : ATTENTION au mois de FevrierVoici votre Update Hebdomadaire ! Délivrée comme chaque semaine et avec un historique de plusieurs années !
N'hésitez pas à "liker / commenter / partager / follower" ;)
Le partage c'est avant tout aider les autres à accéder à ce contenu si vous l'avez aimé vous-même !
Amicalement,
Phil
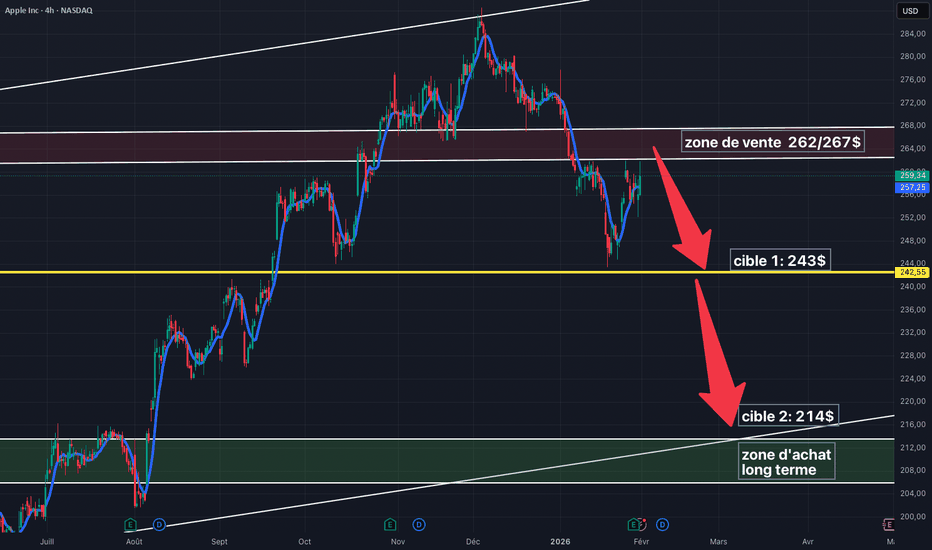
APPLE opportunité de vente zone 262/267$Après avoir corrigé comme anticipé depuis le haut de son canal haussier long terme (voir mon analyse en daily), le titre Apple a rebondi ces derniers jours en direction d'une forte zone de résistance court terme dans la zone 262/267$.
Nous nous sommes replacés à la vente sur le titre pour viser 243
VIX en hausse depuis fin décembre 2025la question que je me pose ressemble à ça : est-ce que cette hausse du VIX correspond à une perspective de baisse sensible des indices US à venir.
A priori il existe une corrélation entre l'évolution du VIX et l'évolution des indices. Le VIX monte, et les prix des actions baissent et inversement.
C
Que s’est passé avec le prix de l’or ?L’or a connu une chute nette récemment, avec des baisses de l’ordre de ~8 %+ dans certains échanges après avoir atteint des sommets records (au-delà de $5 500 l’once dans les jours précédents).
Dans la même séance, les vendeurs se sont intensifiés après des excès haussiers, entraînant une forte vol
BITCOIN sous pression !!!Le canal "bleu" a été cassé à la baisse , la zone des 81 500$/80 000$ reste le dernier support avant un décrochage pour rejoindre le bas du GAP de la semaine du 4 novembre 2024 "élection TRUMP" zone des 73600$ .
La clôture mensuelle sera importante tout autant que la clôture hebdomadaire !
Sensi
GOLD : Quelle suite après une semaine mouvementée ? Bonjour à tous c'est Yan's !
Aujourd'hui je vous partage mon analyse sur le GOLD !
Gros retracement hier ! dans une zone très pertinente ! Le prix est revenu dans un Fair Value Gap H1/H4 et dans la zone des 78.6% pour délivrer un gros mouvement haussier pour revenir dans un Fair Value Gap H1/H4
MSFT USMicrosoft dessine actuellement une superbe figure en « Batman » : après avoir franchi la ligne de tendance baissière, l'action a été retestée, puis de nouveau retestée au niveau de la moyenne mobile simple à 50 périodes (SMA 50).
Cependant, hier, le marché a propulsé le titre au-dessus du niveau de
L'OR CONSERVE STRUCTURE HAussière APRÈS FOMC — VOLATILITÉ EST L'📰 Mise à jour FOMC (29 janv)
La Fed a maintenu les taux inchangés, comme prévu.
Powell est resté dépendant des données, évitant tout changement agressif vers un ton hawkish.
Les marchés ont interprété cela comme l'absence d'urgence à resserrer davantage, maintenant les rendements réels plafonnés.
Revue SP500 du 28/01/2026Journée très intéressante aujourd’hui sur le SP500, analysée avant l’annonce du FOMC à 20h, avec une séance particulièrement pédagogique sur la notion de fractalité du marché et d’enchaînement des timeframes.
🔎 Première position – Début de session New York (avant 15h30)
En début de session New Yor
Voir toutes les idées sélectionnées par la rédaction
Hyperfork Matrix🔱 Hyperfork Matrix 🔱 A manual Andrews Pitchfork tool with action/reaction propagation lines and lattice matrix functionality. This indicator extends Dr. Alan Andrews' and Patrick Mikula's median line methodology by automating the projection of reaction and action lines at equidistant intervals, cr
Arbitrage Matrix [LuxAlgo]The Arbitrage Matrix is a follow-up to our Arbitrage Detector that compares the spreads in price and volume between all the major crypto exchanges and forex brokers for any given asset.
It provides traders with a comprehensive view of the entire marketplace, revealing hidden relationships among d
Wyckoff Schematic by Kingshuk GhoshThe "Wyckoff Schematic" is a Pine Script indicator that automatically detects and visualizes Wyckoff Method accumulation and distribution patterns in real-time. This professional tool helps traders identify smart money movements, phase transitions, and critical market structure points.
Key Features
Volume Cluster Profile [VCP] (Zeiierman)█ Overview
Volume Cluster Profile (Zeiierman) is a volume profile tool that builds cluster-enhanced volume-by-price maps for both the current market window and prior swing segments.
Instead of treating the profile as a raw histogram only, VCP detects the dominant volume peaks (clusters) insid
DeeptestDeeptest: Quantitative Backtesting Library for Pine Script
━━━━━━━━━━━━━━━━━━━━━━━━━━━━━━━━━━
█ OVERVIEW
Deeptest is a Pine Script library that provides quantitative analysis tools for strategy backtesting. It calculates over 100 statistical metrics including risk-adjusted return ratios (Sharpe
Arbitrage Detector [LuxAlgo]The Arbitrage Detector unveils hidden spreads in the crypto and forex markets. It compares the same asset on the main crypto exchanges and forex brokers and displays both prices and volumes on a dashboard, as well as the maximum spread detected on a histogram divided by four user-selected percenti
Multi-Distribution Volume Profile (Zeiierman)█ Overview
Multi-Distribution Volume Profile (Zeiierman) is a flexible, structure-first volume profile tool that lets you reshape how volume is distributed across price, from classic uniform profiles to advanced statistical curves like Gaussian, Lognormal, Student-t, and more.
Instead of forcin
Multi-Ticker Anchored CandlesMulti-Ticker Anchored Candles (MTAC) is a simple tool for overlaying up to 3 tickers onto the same chart. This is achieved by interpreting each symbol's OHLC data as percentages, then plotting their candle points relative to the main chart's open. This allows for a simple comparison of tickers to tr
Vdubus Divergence Wave Pattern Generator V1The Vdubus Divergence Wave Theory
10 years in the making & now finally thanks to AI I have attempted to put my Trading strategy & logic into a visual representation of how I analyse and project market using Core price action & MacD. Enjoy :)
A Proprietary Structural & Momentum Confluence System
Per Bak Self-Organized CriticalityTL;DR: This indicator measures market fragility. It measures the system's vulnerability to cascade failures and phase transitions. I've added four independent stress vectors: tail risk, volatility regime, credit stress, and positioning extremes. This allows us to quantify how susceptible markets are
Voir tous les indicateurs et stratégies
Tendances communautaires
Tendance baissièreSIDETRADE vision hebdo.
A la demande d'un abonné 😉
La tendance est baissière
Un rebond technique est possible avant poursuite baissière.
Pour celles et ceux qui souhaitent analyser la structure plus en détail, tout est détaillé dans mon contenu habituel.
⚠️ Sans conseil, sans filtre, simplement un
Analyse de RenaultMon courtier me propose régulièrement de prendre Renault. J’ai du mal à comprendre la logique, tout du moins au niveau technique. Le marché est en tendance baissière. L’action a de nouveau été stoppée sur les 30.87 mais la clôture n’est pas jolie. Elle est juste sur le précédent bas. Je ne vois aucu
UBISOFT OPPORTUNITÉ??????ALORS que la masse euphorique crie à la fin d’un géant du jeu vidéo, Ubisoft, moi je vois une opportunité sur cet actif.
Comme le montre mon analyse précise, on observe des mouvements importants tous les 8-10 ans, généralement en début d’année (Q1).
J’attendrai une confirmation technique RSR pour
Alstom (ALO) – Reprise solide en weekly – Vers les 28-30 € ?
On voit une belle réaction haussière depuis le gros creux ~13-15 € en 2023/2024.
Le prix est venu casser et tenir au-dessus de plusieurs niveaux clés Fibonacci :0.236 retracement (~18.71 €) déjà largement dépassé
0.382 (~24.09 €) → support testé puis relancé
Zone orange ~22.50-23 € → ancien ra
Voir toutes les idées sur les actions
Demain
DIMSartorius Stedim Biotech SA
Actuel
—
Estimation
1,26
EUR
Demain
PUBPublicis Groupe SA
Actuel
—
Estimation
4,03
EUR
5 févr.
BNPBNP Paribas S.A. Class A
Actuel
—
Estimation
—
5 févr.
XFABX-FAB Silicon Foundries SE
Actuel
—
Estimation
0,08
EUR
5 févr.
DGVINCI SA
Actuel
—
Estimation
5,21
EUR
6 févr.
GLESociete Generale S.A. Class A
Actuel
—
Estimation
—
6 févr.
AYVAyvens
Actuel
—
Estimation
—
10 févr.
KERKering SA
Actuel
—
Estimation
2,42
EUR
Voir plus d'événements
Tendances communautaires
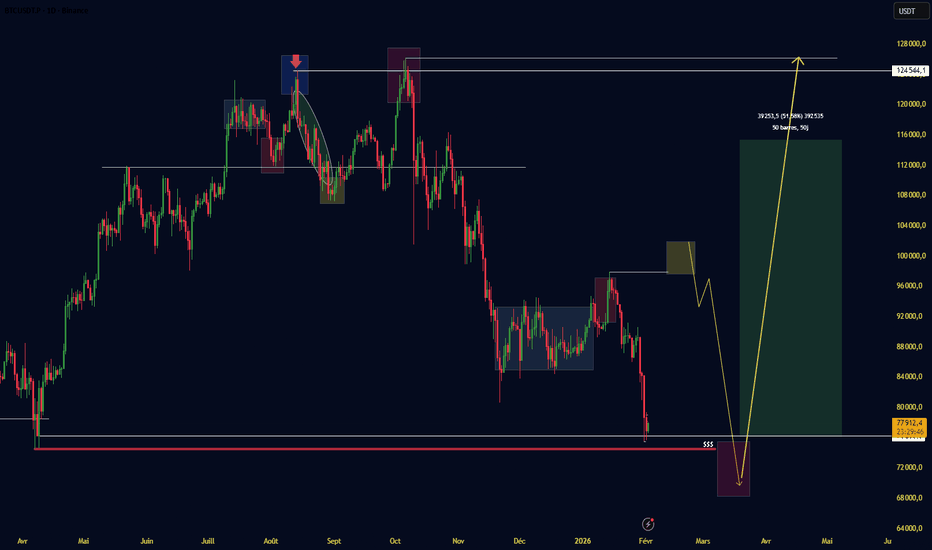
BITCOIN : Le dernier retracement avant l'explosion ? Bonjour à tous c'est Yan's !
Aujourd'hui je vous partage mon analyse sur le BITCOIN !
Au vu des différents contextes géopolitiques et économiques, le BITCOIN revient dans des zones clés.
Je suis en Daily, le prix est revenu dans un Order Block et l'a comblé à plus de 50% au niveau des 77 60
BRIEFING Semaine #5 : ATTENTION au mois de FevrierVoici votre Update Hebdomadaire ! Délivrée comme chaque semaine et avec un historique de plusieurs années !
N'hésitez pas à "liker / commenter / partager / follower" ;)
Le partage c'est avant tout aider les autres à accéder à ce contenu si vous l'avez aimé vous-même !
Amicalement,
Phil
BTC : Fin de la correction ? Opportunités d'achat en vue₿ Après avoir profité de la baisse comme annoncé dans mes précédentes analyses, il est temps d'anticiper le retournement. Ma vision globale reste bullish et je surveille deux scénarios :
Scénario 1 de Zone (Favori) : Une légère correction supplémentaire jusqu'à ma zone de demande (voir chart) suivi
BTCUSD – Le risque persisteLa structure du marché est toujours clairement orientée à la baisse : plus haut plus bas – plus bas plus bas
Les prix se sont continuellement redressés faiblement et ont été rejetés sous le nuage Ichimoku, montrant que la pression à la vente était toujours sous contrôle.
La zone de reprise actuelle
Drapeau baissierBTC/USD – Vision journalière
- De mon point de vue, on observe :
- un drapeau en formation,
- une death cross (croisement de la MM 50 sous la MM 200).
👉 En cas de cassure du drapeau, un retour possible vers la zone 76 200 / 74 565 (à la louche).
Pour celles et ceux qui souhaitent analyser la struc
Le BTC pourrait encore baisser...Le BTC pourrait encore baisser...
J'ai partagé cette perspective baissière concernant le BTC il y a 6 jours.
Le prix a atteint son deuxième objectif et semble prêt à chuter davantage.
Il faut rester prudent, car le BTC pourrait rebondir depuis sa zone actuelle.
De manière générale, la tendance d
Le Bitcoin sort de son canal haussier, la pression s'accentueLe Bitcoin a officiellement cassé son canal haussier et n'a pas réussi à retester la zone d'offre de 83 500 à 84 500 $. Cela indique que les vendeurs reprennent le contrôle à court terme.
Le volume a diminué progressivement lors des rebonds et a fortement augmenté lors des replis, confirmant que la
BTC (1H) – Risques du week-end !Le Bitcoin a cassé l'ancienne ligne de tendance haussière, puis a rebondi vers la zone FVG/offre sans parvenir à s'y maintenir, ce qui indique que la pression vendeuse reste dominante. La structure actuelle, avec un sommet et un creux de plus en plus bas, confirme une tendance baissière à court term
BTC COMMENCE A CONSTRUIRE UNE STRUCTURE DE BOTTOMLe BTC est actuellement sur un gros niveau de support.
Pas de confirmation claire pour un vrai bottom long terme, mais on devrait avoir des rebonds haussiers pour créer de la liquidité.
Les niveaux identifiés en rectangle correspondent aux phases de manipulation à venir.
Attendre de belles conf
Voir toutes les idées sur les cryptos
XAUUSD, GOLD, OR, GCLes légendes,
Le GOLD est haussier en HTF et repassé baissier en MTF.
Comme partagé lors de l'analyse live de lundi dernier, nous avions un TRAP daily en cours ce qui a fait chuter le gold. Jeudi, sa chute avait été annoncée.
Actuellement, l'or a repris des liq majeures H4. Il a d'ailleurs confir
Analyse daily GOLDYo les amis 💛
On est post-FOMC, et le gold digère maintenant l’annonce après une impulsion violente suivie d’un gros rejet des highs.
Le marché est entré dans une phase de redistribution / nettoyage, typique après ce genre d’événement majeur.
👉 Moins d’émotion, plus de lecture de structure.
📍 Mes
XAU/USD : L'or teste le Fibonacci 0.786 — rebond ou cassure ?L'or reste dans une tendance haussière puissante, porté par une trendline ascendante depuis les 4 100 $. Après une impulsion spectaculaire vers un sommet à 5 600 $, le prix corrige et se situe actuellement à 4 894 $, pile sur le retracement Fibonacci 0.786— un niveau clé.
Si ce support tient, un re
OR : Krach historique, -12% en une journée ! Voici les raisonsVendredi 30 janvier 2026 : une journée sombre pour l'or. Après avoir touché un sommet historique à 5 602$ la veille, le métal précieux s'est effondré de 12% en une seule séance, chutant jusqu'à 4 679$ sous l'effet de la nomination surprise de Kevin Warsh à la tête de la Fed. Une hécatombe qui rappel
GOLD : Après l'excès, place au tri des positions !!👑 Analyse & Perspectives GOLD – Semaine du 2 au 6 février 2026 👑
🎙️ Introduction
On sort d’une semaine complètement folle sur le GOLD.
Après avoir enchaîné les ATH jour après jour, le marché a mis un coup de frein brutal vendredi : une mèche qui va chercher les 5 600, puis une correction vertica
XAUUSD — Market Structure & Liquidity | ICT / SMC PerspectiveXAUUSD - Analyse ICT / Smart Money - multi-timeframe
Macro • Fondamental • Structure • Liquidité • Efficience • Temps • Hiérarchisation
👋 Bienvenue,
Cette analyse s’inscrit dans une approche institutionnelle et hiérarchisée du marché de l’or, basée sur les concepts ICT / Smart Money.
Elle vis
RETRACEMENT DU GOLDLa semaine dernière a été une grosse semaine en terme de volatilité....
Surtout Jeudi et Vendredi ou le gold à fait une chute de presque 12%!!!!
🚀 Pour moi le gold reste tout de même haussier, il ne fait que juste faire son retracement pour venir chercher des liquidités pour ensuite repartir a la
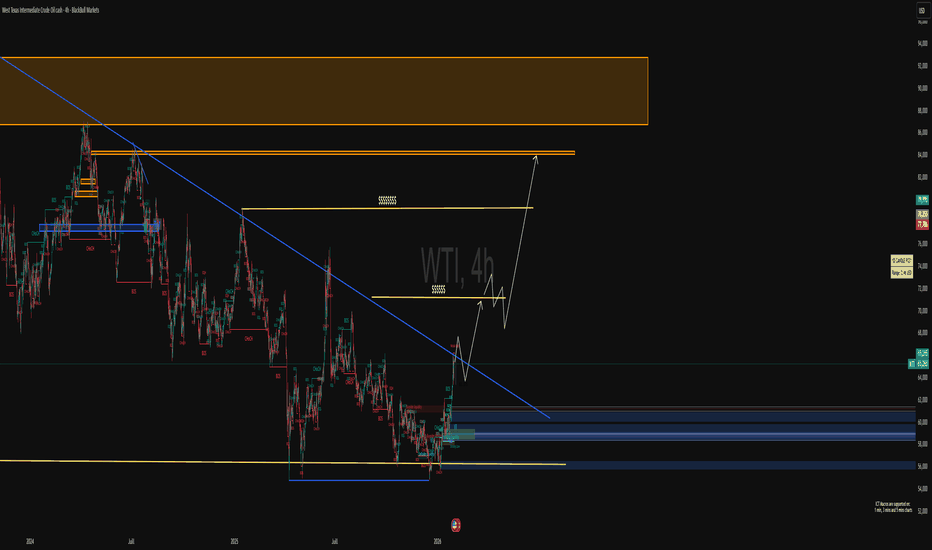
Pétrole : La Structure Haussière se Confirme (Update)Comme anticipé, le pétrole valide son retournement. Après une consolidation nécessaire, le flux acheteur reprend la main.
Points clés à surveiller :
Structure de Marché : On observe une dynamique nette de Higher Highs & Higher Lows. Les acheteurs contrôlent désormais le carnet d'ordres.
Validatio
Les cours de l'or ont poursuivi leur rebond lundi : 5 000-5 100 Les cours de l'or ont poursuivi leur rebond lundi : 5 000-5 100 $
Cette semaine, le marché de l'or a connu sa période la plus volatile depuis près de quarante ans.
Par conséquent, nous avons quasiment suspendu toutes nos transactions de mercredi à vendredi. Ce niveau de volatilité était incontrôl
Voir toutes les idées sur les futures
S06 Analyse Macro & Swing Trading | BTC, Gold, Dollar & ForexAnalyse macroéconomique et swing trading sur les principaux marchés :
Bitcoin (BTC), Gold (XAUUSD), Dollar Américain (USD), Indice du Dollar (DXY) et les principales paires Forex.
Objectif : identifier les zones techniques clés, les structures de marché et les scénarios swing à moyen terme, sans sc
FOREX | L’ANALYSE DU JOUR➡EURUSD
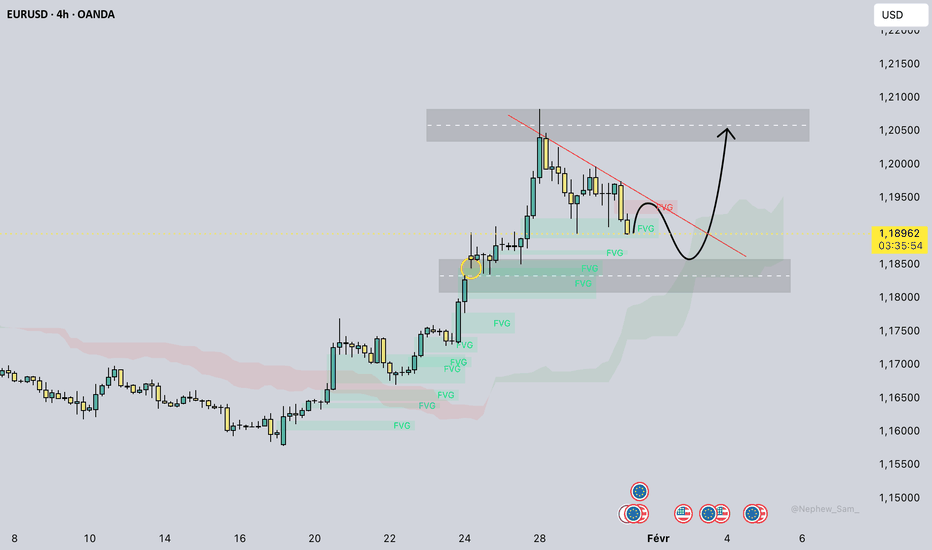
Analyse technique : L'EURUSD accentue son retracement baissier ce lundi, atteignant précisément le niveau des 1.18200. Ce mouvement correctif, bien que rapide depuis le rejet sous les 1.20000, ramène le prix dans une zone de "Discount" extrêmement intéressante pour la suite de la structure
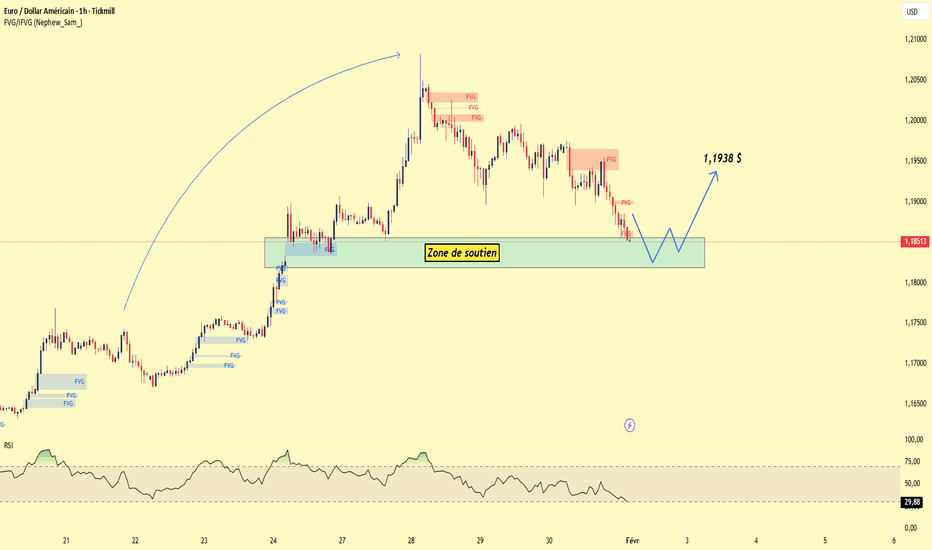
EUR (1H) – Opportunité de hausse la semaine prochaine !Après une correction, l'EUR/USD retourne vers une zone de support importante (zone de demande), où le cours s'était précédemment accumulé avant de la franchir. La structure générale conserve une tendance haussière ; le repli actuel est considéré comme un repli technique.
Le cours a réagi au niveau
Revue SP500 du 29/01 + GBPUSD du 30/01Revue combinée aujourd’hui avec :
une analyse du SP500 suite au FOMC du mercredi 28 janvier,
et un trade en cours sur GBPUSD durant la session de Londres du 30 janvier, dont le TP a été atteint pendant la vidéo.
📊 SP500 – Lecture post-FOMC et travail du FVG H4
Sur le SP500, j’avais identifié en
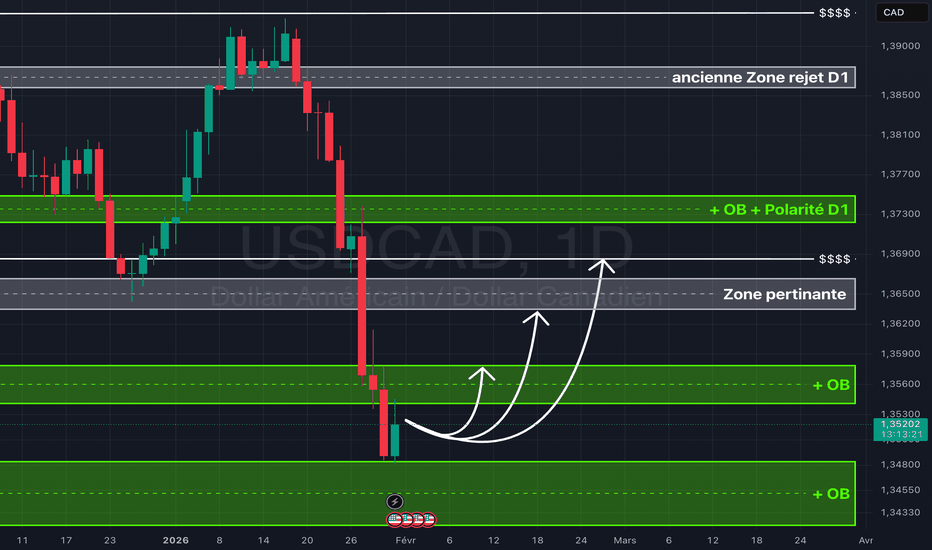
USDCAD un mini retracement à prévoir ? :)
Lors de mon étude des marchés financiers de ce matin, j'ai passé en revue les éléments majeurs. Vous trouverez ci-dessous mon évaluation :
USDCAD :
- récupération d’une liquidité importante D1
- mini retracement du DXY
- bas de canal
Scénario :
• accumulation, break haussier, d
L'euro montre des signes de reprise !Signal le plus probable : Retracement vers le support → rebond
Sur l'unité de temps H1, la paire EUR/USD évolue à l'intérieur d'un triangle de consolidation après une correction baissière. Le cours touche actuellement une zone de support importante, où une forte pression acheteuse s'était précédemm
EURUSD conserve sa hausse, mais le rythme ralentitLa paire avait progressé fermement depuis 1,16 en enchaînant sommets et creux ascendants, s’extrayant nettement du nuage et confirmant l’initiative des acheteurs. À l’approche de 1,20 toutefois, l’élan s’est affaibli : chandeliers plus courts, mèches supérieures fréquentes et retours vers les FVG in
EUR/USD – Dans un OB vendeur, bientôt un CSD haussier ?Hello l’équipe, j’espère que vous allez bien 😎
Nouvelle analyse sur l’EUR/USD 📉📈
Cette semaine, l’EUR/USD reste globalement orienté à la hausse sur le plan structurel, même si le marché marque une pause à court terme.
Ces derniers temps , l’euro a montré une vraie force face au dollar, souten
GBPCAD : Le pétrole pousse le CAD, opportunité de vente en vue ?Analyse Technique du GBPCAD
Sur l'unité de temps 1H, la paire GBPCAD montre des signes clairs de retournement baissier après une phase ascendante prolongée. La tendance haussière, précédemment soutenue par une ligne de tendance oblique (marquée par les flèches vertes), a été officiellement rompue s
Analyse de l'euro – Forte continuation de la tendance haussièreSignal haussier confirmé
Le prix franchit clairement le canal descendant → changement structurel
Les moyennes mobiles exponentielles à 20 et 50 jours sont orientées à la hausse → la dynamique haussière se maintient
La zone de demande (encadré jaune) fait office de support efficace
Scénario privilég
Voir toutes les idées sur le forex
| - | - | - | - | - | - | - | ||
| - | - | - | - | - | - | - | ||
| - | - | - | - | - | - | - | ||
| - | - | - | - | - | - | - | ||
| - | - | - | - | - | - | - | ||
| - | - | - | - | - | - | - | ||
| - | - | - | - | - | - | - | ||
| - | - | - | - | - | - | - |
Tradez directement sur les supercharts via nos courtiers agréés, entièrement vérifiés et évalués par les utilisateurs.


