SMCI — Cassure technique en attente de confirmationL’action Super Micro Computer (SMCI) a récemment cassé sa ligne de tendance, signalant un possible changement de dynamique. Toutefois, le marché reste en phase d’attente d’une cassure claire de la résistance, accompagnée d’un fort volume, avant toute confirmation d’achat.
🔎 Scénario probable :
1️⃣

Les meilleures transactions nécessitent de la recherche, puis de l'engagement.
Commencez gratuitement0$ pour toujours, pas besoin de carte de crédit

Scott "Kidd" PoteetL'astronaute de Polaris Dawn

Là où le monde fait vivre les marchés
Rejoignez 100 millions de traders et d'investisseurs qui prennent leur avenir en main.
AT BTC — Lecture logarithmique WeeklyAnalyse technique BTC — Lecture logarithmique Weekly
En observant Bitcoin en échelle logarithmique sur le timeframe hebdomadaire, une structure majeure attire particulièrement l’attention : la courbe de support exponentielle long terme qui accompagne la croissance naturelle du marché depuis plusieur
ACCENTURE (ACN) : RR de 1.2 pour +10% potentielLe détachement de la grande oblique baissière dans un mouvement de consolidation (contenu dans un triangle) et la belle impulsion du 21/11 nous permettent de parier sur un retour dans la zone de polarité supérieure, avec en target, le S1 annuel d'ici la fin de l'année.
Du fait d'une tendance toujo
MSTR -70% : L'EUPHORIE DE SAYLOR VA TOUT DÉTRUIRE !Une action cyclique sans fondement durable
Depuis mon analyse précédente sur la chute de MSTR, l'action a déjà perdu environ 70 % de sa valeur par rapport à son pic récent.
Cette correction, bien que significative, reste principalement soutenue par l'euphorie persistante portée par Michael Saylor,
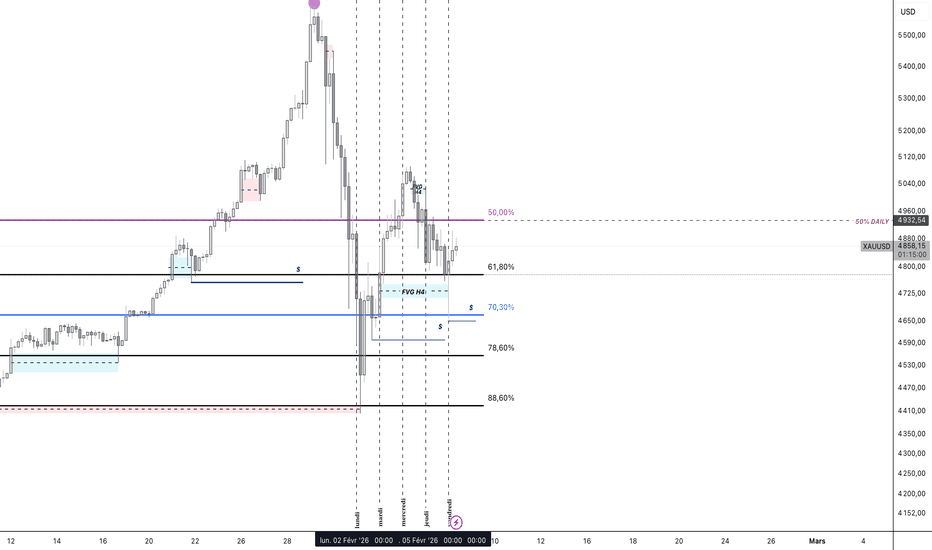
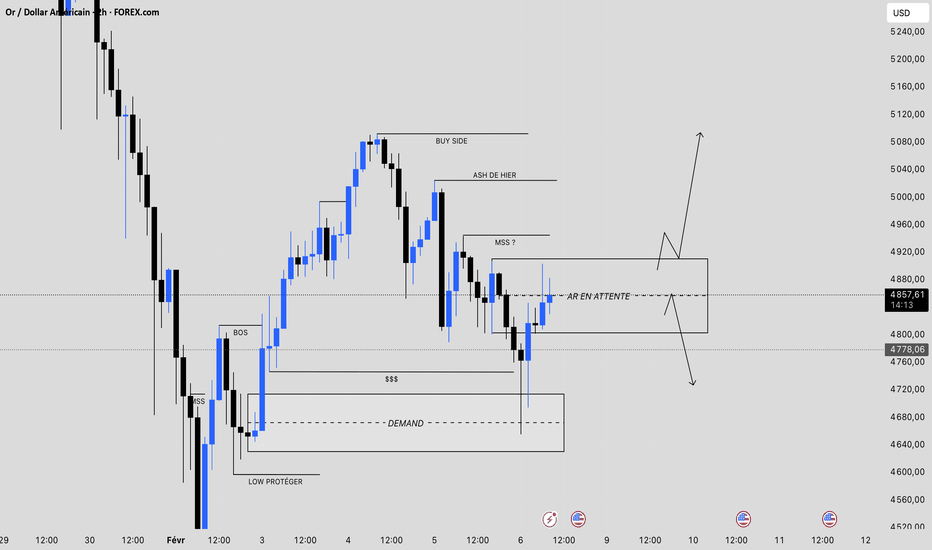
GOLD / OR : acheteur ou vendeur, où décide d'aller l'or ?Aujourd'hui sur l'or, nous avons eu une ouverture des marchés très en faveur des acheteurs avec une poussée vers les 5 000 $ pour ensuite être violemment rejeté vers les 4 800 $.
Les nouvelles économiques du jour sont largement en faveur des acheteurs et pourtant, l'or décide de partir violemment à
GOLD BAISSIER SUR CETTE FIN DE SEMAINE Hello l’équipe, j’espère que vous allez bien 😌
Nouvelle journée, bientôt la fin de semaine !
Sur le Gold, on est actuellement dans un contexte clairement baissier.
Depuis hier matin, on a eu un gros mouvement vendeur, avec un flux qui reste orienté à la baisse.
Hier, le marché est venu casser
Analyse du prix de l'or le 5 février📊 Aperçu de la structure des prix
La tendance à moyen terme reste haussière, mais à court terme, le marché se trouve dans une phase de correction technique/rebond latéral après une forte baisse.
Le prix actuel se situe autour de 4,97xx, coincé entre la résistance supérieure et le support inférieur
META ACHATContexte de tendance – Théorie de Dow
L’action META évolue actuellement dans une tendance haussière bien établie, conformément à la théorie de Dow.
La structure de marché reste saine avec :
des creux ascendants,
des sommets de plus en plus élevés,
confirmant la domination des acheteurs sur l’unité
XAU/USD – Poursuite haussière au-dessus du POI clé, objectif : ?🔍 Analyse technique (45M)
🟢 Structure du marché
Après une forte impulsion baissière, l’or a formé une base solide et a basculé vers une structure haussière.
Une séquence de plus hauts et plus bas ascendants est respectée le long de la ligne de tendance haussière ✔️
Plusieurs points pivot confirm
Renversement en arrondi vers une résistance cléStructure du marché
Le prix a formé une structure de retournement en arrondi (rounded bottom) après une forte phase de baisse, indiquant un épuisement des vendeurs et une prise de contrôle progressive par les acheteurs.
Le point bas encerclé montre une forte absorption de la demande, suivie de cre
Voir toutes les idées sélectionnées par la rédaction
Smart Trader, Episode 03, by Ata Sabanci, Candles and TradelinesA volume-based multi-block analysis system designed for educational purposes. This indicator helps traders understand their current market situation through aggregated block analysis, volumetric calculations, trend detection, and an AI-style narrative engine.
━━━━━━━━━━━━━━━━━━━━━━━━━━━━━━━━━━━━━━━
Asset Drift ModelThis Asset Drift Model is a statistical tool designed to detect whether an asset exhibits a systematic directional tendency in its historical returns. Unlike traditional momentum indicators that react to price movements, this indicator performs a formal hypothesis test to determine if the observed d
Hyperfork Matrix🔱 Hyperfork Matrix 🔱 A manual Andrews Pitchfork tool with action/reaction propagation lines and lattice matrix functionality. This indicator extends Dr. Alan Andrews' and Patrick Mikula's median line methodology by automating the projection of reaction and action lines at equidistant intervals, cr
Arbitrage Matrix [LuxAlgo]The Arbitrage Matrix is a follow-up to our Arbitrage Detector that compares the spreads in price and volume between all the major crypto exchanges and forex brokers for any given asset.
It provides traders with a comprehensive view of the entire marketplace, revealing hidden relationships among d
Wyckoff Schematic by Kingshuk GhoshThe "Wyckoff Schematic" is a Pine Script indicator that automatically detects and visualizes Wyckoff Method accumulation and distribution patterns in real-time. This professional tool helps traders identify smart money movements, phase transitions, and critical market structure points.
Key Features
Volume Cluster Profile [VCP] (Zeiierman)█ Overview
Volume Cluster Profile (Zeiierman) is a volume profile tool that builds cluster-enhanced volume-by-price maps for both the current market window and prior swing segments.
Instead of treating the profile as a raw histogram only, VCP detects the dominant volume peaks (clusters) insid
DeeptestDeeptest: Quantitative Backtesting Library for Pine Script
━━━━━━━━━━━━━━━━━━━━━━━━━━━━━━━━━━
█ OVERVIEW
Deeptest is a Pine Script library that provides quantitative analysis tools for strategy backtesting. It calculates over 100 statistical metrics including risk-adjusted return ratios (Sharpe
Arbitrage Detector [LuxAlgo]The Arbitrage Detector unveils hidden spreads in the crypto and forex markets. It compares the same asset on the main crypto exchanges and forex brokers and displays both prices and volumes on a dashboard, as well as the maximum spread detected on a histogram divided by four user-selected percenti
Multi-Distribution Volume Profile (Zeiierman)█ Overview
Multi-Distribution Volume Profile (Zeiierman) is a flexible, structure-first volume profile tool that lets you reshape how volume is distributed across price, from classic uniform profiles to advanced statistical curves like Gaussian, Lognormal, Student-t, and more.
Instead of forcin
Multi-Ticker Anchored CandlesMulti-Ticker Anchored Candles (MTAC) is a simple tool for overlaying up to 3 tickers onto the same chart. This is achieved by interpreting each symbol's OHLC data as percentages, then plotting their candle points relative to the main chart's open. This allows for a simple comparison of tickers to tr
Voir tous les indicateurs et stratégies
Tendances communautaires
Récap Orange.
Récap du trade du 03 novembre / MAJ le 18/ janvier
Analyse jointe ou a retrouvé sur ma page, (cette action m'interesse)
Pour celles et ceux qui souhaitent analyser la structure plus en détail, tout est détaillé dans mon contenu habituel. (short)
⚠️ Sans conseil, sans filtre, simplement u
TotalEnergies (TTE) – Weekly – Toujours dans la zone d'intérêt ? TotalEnergies SE (Euronext Paris) reste calé autour des 60-61 € en ce début février 2026, après une belle jambe de hausse depuis les lows 2025 (~47-53 € zone).
Sur le weekly :Le prix vient de taguer et respecter la zone 0.236 Fib (~58,55 €)
Rebond clair depuis le support hebdo majeur ~50-52 € (co
EssilorLuxottica : quand le flou donne de la vision ?🕶️ EssilorLuxottica NYSE:EL
💡 Retour sur une première zone clé entre 255€ et 260€. Une première opportunité potentielle à surveiller.
🔵 La seconde zone d’intérêt se situe autour de la MM200 hebdo, vers 220€–230€, l’action n’étant toujours pas en survente avec un RSI hebdo proche de 40.
🔔 De quo
MSTR vise la ligne de gravitéL’action MicroStrategy (MSTR) vient de réagir sur la borne haute de son couloir, montrant un rejet clair à ce niveau stratégique. Ce mouvement suggère que le marché pourrait entrer dans une phase de correction technique et se diriger vers la ligne de gravité du canal.
🔎 Pourquoi ce mouvement est-il
UBISOFT OPPORTUNITÉ??????ALORS que la masse euphorique crie à la fin d’un géant du jeu vidéo, Ubisoft, moi je vois une opportunité sur cet actif.
Comme le montre mon analyse précise, on observe des mouvements importants tous les 8-10 ans, généralement en début d’année (Q1).
J’attendrai une confirmation technique RSR pour
Voir toutes les idées sur les actions
10 févr.
KERKering SA
Actuel
—
Estimation
2,42
EUR
10 févr.
GFCGecina SA
Actuel
—
Estimation
3,32
EUR
11 févr.
DSYDassault Systemes SE
Actuel
—
Estimation
0,41
EUR
11 févr.
TTETotalEnergies SE
Actuel
—
Estimation
1,46
EUR
11 févr.
LSSLectra SA
Actuel
—
Estimation
0,29
EUR
11 févr.
RXLRexel SA
Actuel
—
Estimation
1,18
EUR
11 févr.
MLCie Generale des Etablissements Michelin SA
Actuel
—
Estimation
1,10
EUR
11 févr.
ELEssilorLuxottica SA
Actuel
—
Estimation
2,64
EUR
Voir plus d'événements
Tendances communautaires
AT BTC — Lecture logarithmique WeeklyAnalyse technique BTC — Lecture logarithmique Weekly
En observant Bitcoin en échelle logarithmique sur le timeframe hebdomadaire, une structure majeure attire particulièrement l’attention : la courbe de support exponentielle long terme qui accompagne la croissance naturelle du marché depuis plusieur
BITCOIN : Enfin une réaction haussière ? Bonjour à tous c'est Yan's !
Aujourd'hui je vous partage mon analyse sur BITCOIN !
Le prix est revenu dans un Order Block daily dans la zone OTE PATTERN entre les 78.6 - 88.6% au niveau des 60 000$ .
Le prix peut repartir à la hausse jusqu'au 69 000 - 71 000$ qui correspond à un Fair Value G
Bitcoin en phase corrective après l’euphorieSur ce graphique hebdomadaire du BTC/USD, on observe une structure de retournement après une forte tendance haussière en 2024–2025, matérialisée par la cassure du canal ascendant et un rejet clair sous la zone des anciens sommets proches des 110 000–120 000 $.
Le prix est désormais revenu tester u
Chute prévue depuis des annéesDepuis le 25 Novembre 2025 , J'ai eu la certitude que le BTC chuterait. La barre des 75000$ est la première phase. Le second niveau plus bas de chute est à 45000$.
A ce stade du prix il y aura quelque manipulations comme d'habitude.
Si le BTC est la monnaie du peuple et de la liberté, il faut bi
Bitcoin (BTC) – Tendance baissière, objectif 50.000$📉 Contexte de marché
Le Bitcoin a clairement cassé la zone des 74 000, puis est venu chercher la zone des 60 000, avec un plus bas marqué à 60 195.
Le marché continue de se diriger progressivement vers l’objectif des 50 000, ce qui valide parfaitement le scénario baissier en cours.
Cependant, un p
FOCUS PROJET : AKASH NETWORK ($AKT)L'UTILITÉ : Akash est le "Airbnb du Cloud". C'est un marché décentralisé de puissance de calcul (GPU/CPU). En 2026, avec l'explosion des besoins en IA générative, Akash permet aux entreprises de louer de la puissance de calcul à des prix 50 % à 80 % moins chers que chez Amazon ou Google. C'est l'inf
Tendance matinale du BTC - Rebond techniqueAprès une forte baisse, le prix forme un support arrondi/une base à court terme avec une dynamique de rebond claire. La moyenne mobile exponentielle à 20 périodes (EMA20) commence à s'incurver à la hausse et la pression vendeuse s'affaiblit, signe d'un retournement de tendance à court terme.
Scénar
Bitcoin atteint un support majeur, suscitant l'intérêt des achetLe Bitcoin atteint un support majeur, suscitant l'intérêt des acheteurs.
La tendance générale du marché reste baissière ; toutefois, le Bitcoin a atteint un niveau de support important, ce qui a commencé à attirer les acheteurs. À ce stade, un retournement de marché est attendu, suggérant la possib
BTC/USD : La Vague 3 est en marche – Phase 2 de Accumulation Salut à tous LES SNIPERS En ce début février 2026, ma lecture du marché est claire : le Bitcoin n'est pas en train de faiblir, il prépare son décollage le plus puissant de ce cycle.
D'après mon analyse des Vagues d'Elliott, nous sommes actuellement dans la Phase 2 (Correction/Accumulation) au se
BTC/USD en direction de la zone de résistance court terme Comme prévu le BTC rebondit ces dernières semaines en direction de sa zone de résistance court/moyen terme vers 103000$.
Cette zone pourra être mise à profit pour guetter une réaction et initier des positions vendeuses en direction du support oblique moyen terme vers 80000$.
Une cassure haussière
Voir toutes les idées sur les cryptos
NOTRE SETUP XAUUSD TODAY : Supply/Demand ZONE
👀 Aujourd'hui, je surveille cette zone de Supply/Demand sur XAUUSD avec un potentiel setup. J'attends des confirmations en LTF une fois dans la zone avant de me positionner dans cette zone.
Ce que j'ai identifié pour cette zone :
📈 Market Structure: Identification du sens de la tendance e
XAUUSD, GOLD, GC, ORLes légendes,
Le GOLD est haussier en HTF (>Daily) et est haussier en M15.
Le gold avait confirmé un TRAP MTF H1 et M15 en revenant sur la zone 50-60 fibo de la nouvelle leg baissière HTF.
Il a repris le premier niveau de LIQ H4 interne en confirmant un TRAP15 pour ensuite reprendre une liq 1H + b
GOLD : Une direction claire ? Bonjour à tous c'est Yan's !
Aujourd'hui je vous partage mon analyse sur le GOLD !
Le prix est revenu recoller la zone annoncée hier ! Pour ensuite faire un mouvement haussier.
Je m'attends donc à une réaction haussière.
Je reste tout de même vigilant aux zones qui sont en dessous, il peut
GOLD | PLAN DU JOUR⚡️PLAN GOLD DU JOUR⚡️
Le gold a bien retracé hier, jusqu’au gap d’ouverture de mardi et jusqu’à notre zone d’achat de la semaine ! Depuis, magnifique rebond de +2500pips !
Premier objectif : le choch de la structure interne de 4944.
En LTF le biais est « baissier » avec le dernier plus haut de
GOLD / OR : acheteur ou vendeur, où décide d'aller l'or ?Aujourd'hui sur l'or, nous avons eu une ouverture des marchés très en faveur des acheteurs avec une poussée vers les 5 000 $ pour ensuite être violemment rejeté vers les 4 800 $.
Les nouvelles économiques du jour sont largement en faveur des acheteurs et pourtant, l'or décide de partir violemment à
Gold (XAUUSD) – Marché en range, attente d’une cassure décisive📊 Contexte de marché
Le Gold évolue actuellement dans une phase d’indécision totale.
Le marché manque de direction claire, ce qui rend les prises de position délicates à court terme.
Pourquoi cette indécision ?
• Le RSI évolue autour des 50 %, en pleine zone de neutralité
• La moyenne mobile 50
Le cours de l'argent rebondit, mais la tendance baissière reste Sur l'unité de temps H1, l'argent reste structurellement baissier après la récente vague de ventes impulsives. Le cours se négocie toujours sous la ligne de tendance baissière et sous la moyenne mobile exponentielle (EMA), confirmant que la structure à court terme n'est pas encore devenue haussière.
BUY / SELL GOLD ? Hello l’équipe, j’espère que vous allez bien 👍
Nouvelle journée, nous sommes vendredi, dernier jour de la semaine 😎
Sur le Gold , on est actuellement dans un contexte plutôt baissier sur cette fin de semaine.
Depuis mercredi, le marché développe un mouvement vendeur assez propre.
Cela di
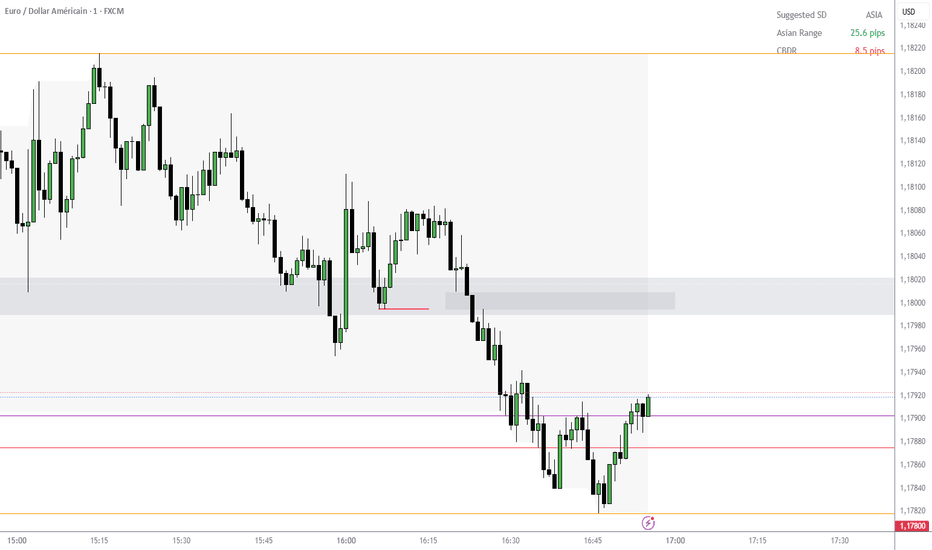
Mon attente sur XAUUSD M15 le 06/02/2026bonjour à tous !
Pour cette dernière de la semaine l'analyse de la session asian m'indique une journée baissière mais l'on peut voir qu'hier nous avons eu une cassure à la hausse donc prudence sur la zone de vente !!
On met bien sont SL audessus de l'englobante si sl 1x et qu'il y a de nouveau une e
Voir toutes les idées sur les futures
FOREX | L’ANALYSE DU JOUR➡EURUSD
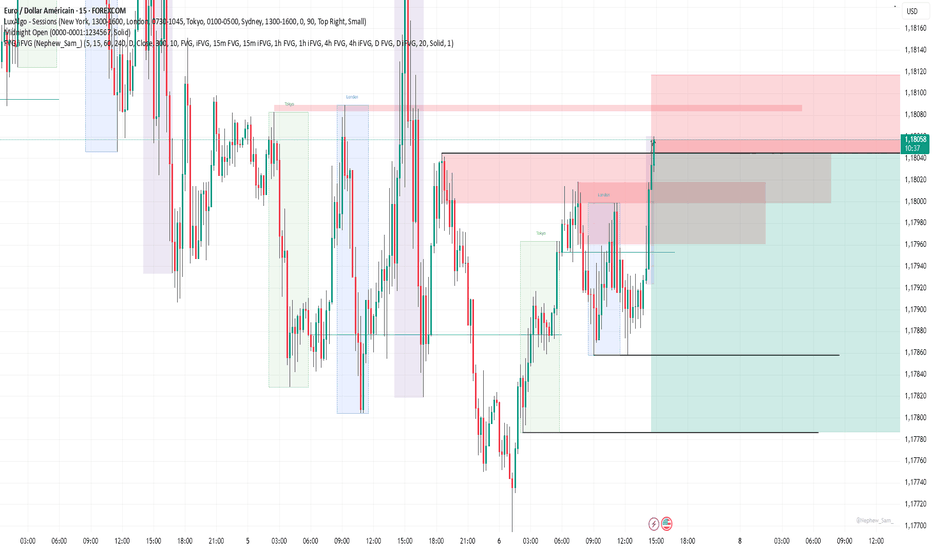
Analyse technique : Le EURUSD confirme sa faiblesse ce vendredi matin, s'inclinant sous la barre symbolique des 1.18000. Comme vous l'avez noté, ce rejet est brutal et intervient dans un climat de "blackout" statistique aux États-Unis. Le passage sous 1.18000 transforme cet ancien support e
EUR/USD – Analyse Intraday (Structure & Liquidité)EUR/USD – Analyse Intraday (Structure & Liquidité)
📊 Description:
Cette analyse propose une lecture factuelle du contexte intraday sur EUR/USD, basée sur la structure du prix, les zones clés et la logique de liquidité.
L’objectif est d’expliquer comment le marché se positionne, et non de fourni
Revue du 05/02/2026 : EURUSD/SP500EURUSD & SP500
Session de Londres intéressante aujourd’hui, avec des setups très similaires sur EURUSD et sur le SP500, mais surtout une séance riche en enseignements sur la gestion du risque, la corrélation inter-marchés et le mindset.
💱 EURUSD – Gestion active via le DXY
Sur EURUSD, le contexte
GBPUSD M30- TRADE ACHEVÉ : CE QU'IL FAUT SAVOIR1. Logique du Setup et Confluence Structurelle
Le trade s'est inscrit dans une dynamique de baisse corrective sur une "tendance haussière normale". L'opportunité a été identifiée lors du retracement du prix en intraday vers le pivot majeur des 1.37306. Ce niveau ne représentait pas seulement une ré
#053: Opportunités d'investissement LONG sur GBP/USD
L'étoile montante est protagoniste du marché de la valeur et montre une résilience qui ne passe pas inaperçue auprès des opérateurs professionnels. Après une phase de restructuration, le changement contre le dollar a traversé une correspondance ordonnée, plus semblable à une pause physique qu'à un
Idée de tradeAUD/NZD – Vision journalière
La tendance est haussière.
Il est donc plus prudent de privilégier les achats.
👉 Vous voulez en savoir plus ?!
Pour celles et ceux qui souhaitent analyser la structure plus en détail, tout est présenté dans mon contenu habituel.
⚠️ Sans conseil, sans filtre, simpleme
L'EUR/USD montre des signes d'inversion.Le cours rebondit à la hausse depuis une zone de forte demande, approchant un point de sortie du canal descendant.
Si le support tient, l'EUR/USD pourrait atteindre 1,18825 lors du prochain repli.
Les anticipations d'un assouplissement de la politique monétaire de la Fed suite aux récentes données
GBPNZD support HarmoniqueLe prix atteint un support à 61.8 de la dernière consolidation et sur le point D d'un Butterfly Harmonique, approche la survente sur le RSI à 35, cependant il est dans le "vide" du canal haussier, alors peut-être un énième rebond hors des niveaux chartistes, mais les niveaux de Fibo pourraient pouss
Voir toutes les idées sur le forex
Tradez directement sur les supercharts via nos courtiers agréés, entièrement vérifiés et évalués par les utilisateurs.


