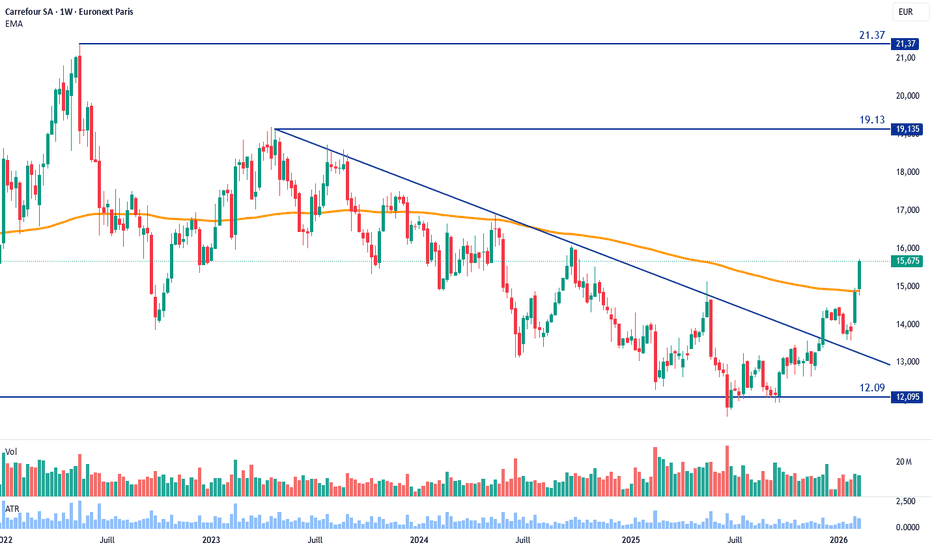
Analyse de CarrefourAprès un rebond sur le support à 12.09 puis le passage au-dessus de la ligne de tendance, Carrefour est maintenant techniquement en tendance haussière en hebdomadaire. C'est un signal fort. Autre signal positif, la clôture probable cette semaine au-dessus de la moyenne mobile à 200.
Est-ce le mome

Les meilleures transactions nécessitent de la recherche, puis de l'engagement.
Commencez gratuitement0$ pour toujours, pas besoin de carte de crédit

Scott "Kidd" PoteetL'astronaute de Polaris Dawn

Là où le monde fait vivre les marchés
Rejoignez 100 millions de traders et d'investisseurs qui prennent leur avenir en main.
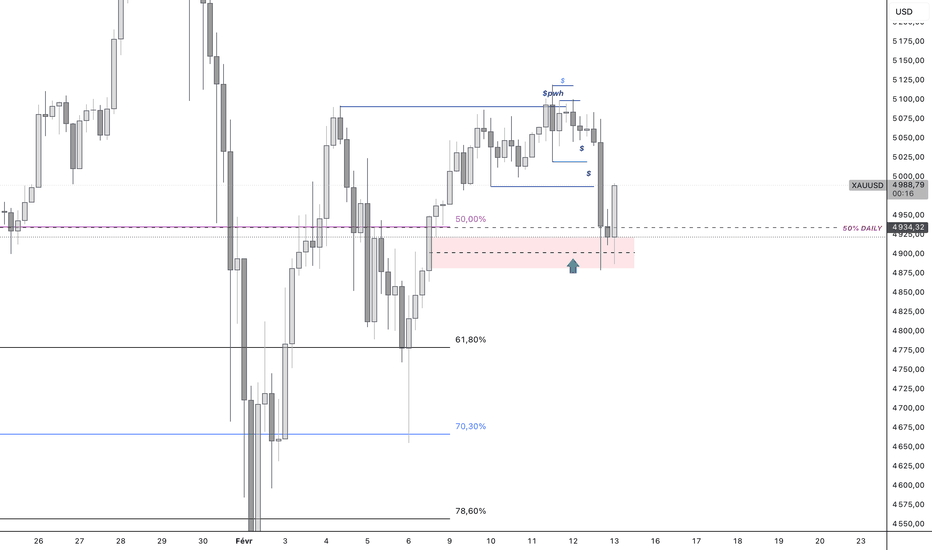
L’Or Pourrait Corriger Sous Le Niveau 5000📊 Aperçu du marché :
Le prix de l’or subit une pression corrective après avoir cassé le niveau psychologique de 5000 USD/oz, alors que le dollar reste fort et que les rendements obligataires américains demeurent élevés. Le marché attend les données économiques américaines et les décisions de la Fed
Analyse GOLDOn voit sur GOLD une phase de ralentissement après une impulsion, avec des bougies qui compressent sous une zone de liquidité haute. Dans une lecture SMC-ICT, le prix semble travailler un dealing range court plutôt que chercher une expansion immédiate. Les mèches indiquent des prises de liquidité in
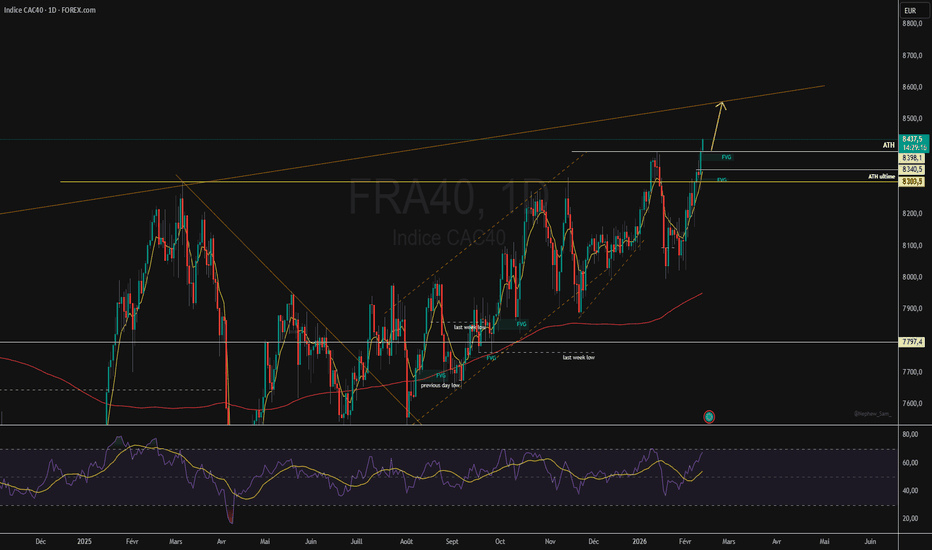
Le CAC 40 explose ses records !!!Nouvel ATH pour notre CAC 40 avec un GAP haussier à l'ouverture , alors direction le haut de l'oblique au alentour des 8540 points.
La clôture hebdomadaire sera très importante et donnera le sens pour les semaines à venir .
Il ne sera pas a exclure un Pull-Back vers les 8400 pts, avant d'atteindre
Bitcoin teste actuellement une zone décisive.📊 Bitcoin teste actuellement une zone décisive. Le BTC évolue dans une correction ABC avec une vague C qui atteint la zone des 161.8% Fibonacci autour des 68 000$, un niveau historiquement associé aux excès de marché et aux zones potentielles de retournement.
Cette zone regroupe plusieurs éléments
XAUUSD: Commencer à vendre à découvert📢 Nous avons acheté de l’or consécutivement cette semaine, et toutes les transactions ont atteint les niveaux cibles. Cependant, l’or teste actuellement la zone de résistance autour de 5100–5120. Bien qu’une cassure puisse se produire à tout moment, il y a un potentiel de profit sur des positions co
Tendance baissière **DSY — Vision journalière**
Je suis actuellement à l’achat.
La tendance reste baissière, rien à redire sur la structure à ce stade.
La chute du jour représente, selon moi, une opportunité de renforcement à l’achat — vous connaissez la zone et la logique derrière ce scénario.
Pour celles et ceux q
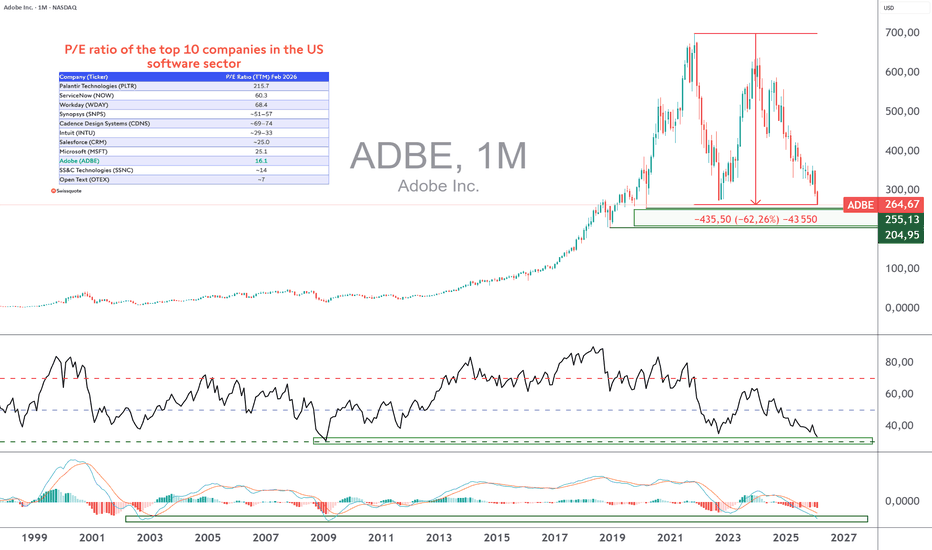
ADOBE : faut-il bientôt revenir à l’achat ?Adobe développe des logiciels emblématiques comme Photoshop, Illustrator, Acrobat ou encore Premiere Pro, majoritairement commercialisés via des abonnements cloud. Alors que le secteur de la technologie américaine évolue dans une puissante tendance haussière ces derniers mois, l’action Adobe a la pa
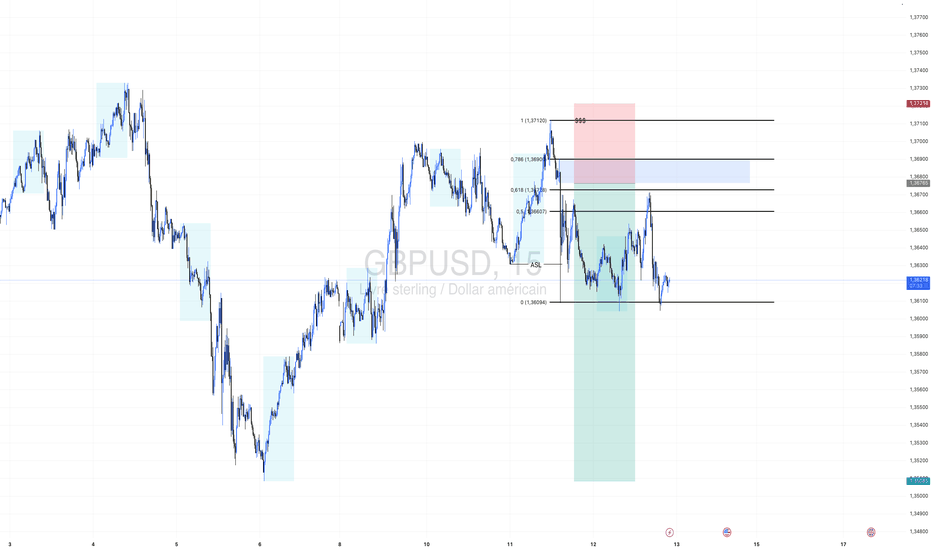
Impact d'Epstein sur la paire GBPUSD La publication de nouveaux dossiers Epstein la semaine dernière a mis le Premier ministre britannique Keir Starmer dans une situation politique délicate et pourrait entraîner une volatilité accrue des paires de devises impliquant la livre sterling.
La controverse porte sur Peter Mandelson et ses re
Le Yen sort enfin de l'ombreLe Yen est historiquement sous-évalué et profite du rapatriement des capitaux japonais.Avec la victoire de Sanae Takaichi au Japon, les espoirs de relance industrielle et de sortie définitive des taux bas redonnent de la vigueur à la monnaie nippone face à un Dollar affaibli.
Le Dollar subit des pr
Voir toutes les idées sélectionnées par la rédaction
Peak Trading Activity Graphs [LuxAlgo]The Peak Trading Activity Graphs displays four graphs that allow traders to see at a glance the times of the highest and lowest volume and volatility for any month, day of the month, day of the week, or hour of the day. By default, it plots the median values of the selected data for each period. T
Smart Trader, Episode 03, by Ata Sabanci, Candles and TradelinesA volume-based multi-block analysis system designed for educational purposes. This indicator helps traders understand their current market situation through aggregated block analysis, volumetric calculations, trend detection, and an AI-style narrative engine.
━━━━━━━━━━━━━━━━━━━━━━━━━━━━━━━━━━━━━━━
Asset Drift ModelThis Asset Drift Model is a statistical tool designed to detect whether an asset exhibits a systematic directional tendency in its historical returns. Unlike traditional momentum indicators that react to price movements, this indicator performs a formal hypothesis test to determine if the observed d
Hyperfork Matrix🔱 Hyperfork Matrix 🔱 A manual Andrews Pitchfork tool with action/reaction propagation lines and lattice matrix functionality. This indicator extends Dr. Alan Andrews' and Patrick Mikula's median line methodology by automating the projection of reaction and action lines at equidistant intervals, cr
Arbitrage Matrix [LuxAlgo]The Arbitrage Matrix is a follow-up to our Arbitrage Detector that compares the spreads in price and volume between all the major crypto exchanges and forex brokers for any given asset.
It provides traders with a comprehensive view of the entire marketplace, revealing hidden relationships among d
Wyckoff Schematic by Kingshuk GhoshThe "Wyckoff Schematic" is a Pine Script indicator that automatically detects and visualizes Wyckoff Method accumulation and distribution patterns in real-time. This professional tool helps traders identify smart money movements, phase transitions, and critical market structure points.
Key Features
Volume Cluster Profile [VCP] (Zeiierman)█ Overview
Volume Cluster Profile (Zeiierman) is a volume profile tool that builds cluster-enhanced volume-by-price maps for both the current market window and prior swing segments.
Instead of treating the profile as a raw histogram only, VCP detects the dominant volume peaks (clusters) insid
DeeptestDeeptest: Quantitative Backtesting Library for Pine Script
━━━━━━━━━━━━━━━━━━━━━━━━━━━━━━━━━━
█ OVERVIEW
Deeptest is a Pine Script library that provides quantitative analysis tools for strategy backtesting. It calculates over 100 statistical metrics including risk-adjusted return ratios (Sharpe
Arbitrage Detector [LuxAlgo]The Arbitrage Detector unveils hidden spreads in the crypto and forex markets. It compares the same asset on the main crypto exchanges and forex brokers and displays both prices and volumes on a dashboard, as well as the maximum spread detected on a histogram divided by four user-selected percenti
Multi-Distribution Volume Profile (Zeiierman)█ Overview
Multi-Distribution Volume Profile (Zeiierman) is a flexible, structure-first volume profile tool that lets you reshape how volume is distributed across price, from classic uniform profiles to advanced statistical curves like Gaussian, Lognormal, Student-t, and more.
Instead of forcin
Voir tous les indicateurs et stratégies
Tendances communautaires
Plan en attenteMichelin vision journalière.
Le prix passe au dessus des M/M 7 / 20 / 50
Résistance : 29.10
1er TP 32.55 / 33.00
2em TP 34.80 / 35.70
Pour celles et ceux qui souhaitent analyser la structure plus en détail, tout est détaillé dans mon contenu habituel.
⚠️ Sans conseil, sans filtre, simplement un par
Analyse de CarrefourAprès un rebond sur le support à 12.09 puis le passage au-dessus de la ligne de tendance, Carrefour est maintenant techniquement en tendance haussière en hebdomadaire. C'est un signal fort. Autre signal positif, la clôture probable cette semaine au-dessus de la moyenne mobile à 200.
Est-ce le mome
La patience payera 3/3J'ai tracé un trait en bleue pour matérialiser la zone de pivot du marcher. En mensuel cela est très net.
c'est en ce moment que se joue la confirmation de mon analyse ou pas.
Regarder la tension du marché lors des dernières semaines. C'est incroyable.
On sent que la tenkan et kijun sont entrain de
TotalEnergies (TTE) – Weekly – Toujours dans la zone d'intérêt ? TotalEnergies SE (Euronext Paris) reste calé autour des 60-61 € en ce début février 2026, après une belle jambe de hausse depuis les lows 2025 (~47-53 € zone).
Sur le weekly :Le prix vient de taguer et respecter la zone 0.236 Fib (~58,55 €)
Rebond clair depuis le support hebdo majeur ~50-52 € (co
EssilorLuxottica : quand le flou donne de la vision ?🕶️ EssilorLuxottica NYSE:EL
💡 Retour sur une première zone clé entre 255€ et 260€. Une première opportunité potentielle à surveiller.
🔵 La seconde zone d’intérêt se situe autour de la MM200 hebdo, vers 220€–230€, l’action n’étant toujours pas en survente avec un RSI hebdo proche de 40.
🔔 De quo
MSTR vise la ligne de gravitéL’action MicroStrategy (MSTR) vient de réagir sur la borne haute de son couloir, montrant un rejet clair à ce niveau stratégique. Ce mouvement suggère que le marché pourrait entrer dans une phase de correction technique et se diriger vers la ligne de gravité du canal.
🔎 Pourquoi ce mouvement est-il
Voir toutes les idées sur les actions
Aujourd'hui
CAPCapgemini SE
Actuel
6,08
EUR
Estimation
6,21
EUR
Aujourd'hui
ETLEutelsat Communications SA
Actuel
—
Estimation
—
Aujourd'hui
SAFSafran SA
Actuel
4,41
EUR
Estimation
4,34
EUR
16 févr.
VCTVicat SA
Actuel
—
Estimation
—
17 févr.
ICADIcade SA
Actuel
—
Estimation
1,32
EUR
17 févr.
MMTMetropole Television SA
Actuel
—
Estimation
—
18 févr.
MERYMercialys SA
Actuel
—
Estimation
—
18 févr.
CACarrefour SA
Actuel
—
Estimation
1,24
EUR
Voir plus d'événements
Tendances communautaires
Bitcoin teste actuellement une zone décisive.📊 Bitcoin teste actuellement une zone décisive. Le BTC évolue dans une correction ABC avec une vague C qui atteint la zone des 161.8% Fibonacci autour des 68 000$, un niveau historiquement associé aux excès de marché et aux zones potentielles de retournement.
Cette zone regroupe plusieurs éléments
Bitcoin – Cassure du support, pression sur la MM200📊 Contexte de marché
Le Bitcoin a cassé le support des 68 308, mais la baisse reste limitée pour le moment.
Pourquoi ?
La moyenne mobile 200 agit actuellement comme un support majeur, freinant l’accélération baissière.
En H1 :
• Supertrend toujours baissière
• Prix sous la moyenne mobile 50
•
BITCOIN : Vers où il se dirige ? Bonjour à tous c'est Yan's !
Aujourd'hui je vous partage mon analyse sur BITCOIN !
Le prix est revenu sur les 50% de son Order Block DAILY et a pris le Previous Daily Low$.
J'aimerais une réaction haussière pour aller chercher au moins les 72 000$ qui correspond à pas mal de liquidité.
J
BTC : Le biseau casse, cap sur les 64K ?Le Bitcoin évolue actuellement autour de 65 990 $ après avoir subi un rejet clair sous la résistance majeure des 68 400 $. La structure montre un biseau ascendant (rising wedge) qui vient de casser par le bas, un signal typiquement baissier.
Le prix a échoué à reprendre la zone de supply entre 66 8
BTC | L’ANALYSE DU JOURAnalyse technique : Le Bitcoin capitule sous les 67 000 en ce vendredi matin, confirmant que le rebond de la veille n'était qu'une simple respiration technique. La perte de ce pivot fragilise grandement la structure de court terme et ouvre la voie à un "nettoyage" de la liquidité située sous les 65
Une dinguerie de précision dans le temps en image.Si il y en a que ça interessent bien entendu. Il faut le lire ainsi:
la première date au 12 Janvier 2015 avec un prix à 152 usdt
puis:
deuxième date au 10 Décembre 2018 avec un prix à 3122 usdt
puis:
troisième date au 21 Novembre 2022 avec un prix à 15480 usdt
puis:
Quatrième date au 19 Octobre 2
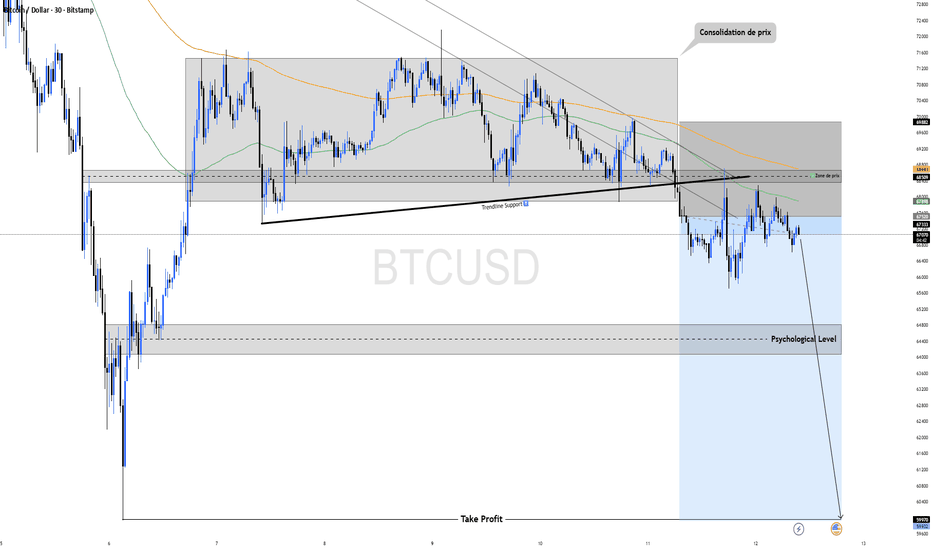
BTC/USD : Pourquoi je shorte la zone des 70k (Analyse M30)Salut à tous!
On regarde le Bitcoin aujourd'hui en 30 minutes. Après le rallye qu'on a connu, la structure est en train de sérieusement s'effriter. Je prépare une position vendeuse car les signaux fondamentaux et techniques s'alignent pour une correction plus profonde. Voici mon raisonnement.
🏛️
Analyse BTCUSDAnalyse BTCUSD
Sur ce graphique BTCUSD en M30, on voit surtout une prise de liquidité sous les derniers plus bas (SSL) suivie d’un rebond impulsif. Le marché semble avoir effectué un sweep avant de revenir dans une zone d’équilibre, ce qui correspond souvent à une phase de manipulation plutôt qu’à
Voir toutes les idées sur les cryptos
[Analyse H1 XAUUSD] - Plan du jour (liquidation à venir ?)Bonjour à tous !
Nouvelle analyse en H1 sur le XAUUSD.
Je vous partage ma vision sur cette fin de semaine.
Je pensais que l'on allait venir avec les NFP d'hier liquider tout le marché, mais non.
Pour moi, clairement, toute la liquidité est au sud.
Depuis 1 semaine, le gold accumule.
Il laisse
Analyse daily GOLDYo les amis 💛
Après la volatilité du NFP, le gold entre dans une phase de stabilisation sous résistance.
Le marché a déjà nettoyé une partie de la liquidité et semble maintenant construire une structure avant le prochain mouvement.
👉 On surveille si on a distribution… ou préparation d’un nouveau pu
L’Or Pourrait Corriger Sous Le Niveau 5000📊 Aperçu du marché :
Le prix de l’or subit une pression corrective après avoir cassé le niveau psychologique de 5000 USD/oz, alors que le dollar reste fort et que les rendements obligataires américains demeurent élevés. Le marché attend les données économiques américaines et les décisions de la Fed
GOLD / OR : Trump fait chuter l'or et l'argentLe contexte : l’impact de l’accord Trump-Iran :
La chute brutale de l’or (-3,13% à 4 925 $) et de l’argent (-10,40%) est directement liée à l’annonce de Donald Trump, hier, de privilégier un accord diplomatique avec l’Iran plutôt qu’une escalade militaire. Cette nouvelle a fait disparaître la "pri
Analyse GOLDOn voit sur GOLD une phase de ralentissement après une impulsion, avec des bougies qui compressent sous une zone de liquidité haute. Dans une lecture SMC-ICT, le prix semble travailler un dealing range court plutôt que chercher une expansion immédiate. Les mèches indiquent des prises de liquidité in
NOTRE SETUP XAUUSD TODAY : Demand ZONE
👀 Aujourd'hui, je surveille cette zone de Demand sur XAUUSD avec un potentiel setup. J'attends des confirmations en LTF une fois dans la zone avant de me positionner dans cette zone.
Ce que j'ai identifié pour cette zone :
📈 Market Structure: Identification du sens de la tendance et de la
Gold (XAUUSD) – Compression sous résistance, explosion imminente📊 Contexte de marché
En H4, le Gold reste totalement bloqué sous la zone de résistance 5086–5091.
Le marché consolide sous cette zone clé sans réelle impulsion.
La structure reste haussière, mais la cassure est indispensable pour relancer un mouvement directionnel fort.
⸻
🔑 Niveaux clés
• 5086–
GOLD : Enfin une direction claire ? Bonjour à tous c'est Yan's !
Aujourd'hui je vous partage mon analyse sur le GOLD !
Le prix hier après avoir pris le Previous Weekly High, a retracé pour revenir dans les 50% de ma structure HTF pour venir combler le Fair Value Gap H4 en plus.
Je suis donc acheteur jusqu'au 5038$ , ce qui co
Voir toutes les idées sur les futures
FOREX | L’ANALYSE DU JOUR➡EURUSD
Analyse technique : L'EURUSD confirme sa résilience en ce vendredi matin. Le maintien au-dessus des 1.18500 valide la force du flux acheteur initié en début de semaine. Malgré le sursaut du Dollar après le NFP de mercredi, l'Euro n'a pas rompu sa structure, prouvant que la demande instituti
Analyse GBPUSDGBPUSD a balayé la liquidité au-dessus des récents sommets avant de montrer un rejet propre dans une zone sensible. Le prix reste pour l’instant bloqué dans une compression courte, signe d’hésitation du marché. Tant que les acheteurs ne reprennent pas clairement la main, la pression reste fragile. J
EurUSd en résistance MensuelleEurusd est dans une zone de résistance mensuelle sur le RSI et le graphique avec divergence, la Trend baissière a subi une fausse cassure et un fort rejet, il est dans la résistance de consolidation mensuelle, le Fibonacci correspond bien aux étendues de support et résistances, (38.2-50%). Sur le RS
EURUSD📊 Vue d’ensemble de la structure du marché
EURUSD évolue actuellement dans une zone majeure de supply / résistance weekly tout en respectant une trendline descendante HTF reliant plusieurs sommets. Historiquement, cette zone a généré de fortes réactions baissières — zone de réaction à haute probabi
EURGBP un nouveau plus haut ? :)Lors de mon étude des marchés financiers de ce matin, j'ai passé en revue les éléments majeurs. Vous trouverez ci-dessous mon évaluation :
EURGPB :
- Flag haussier en cours
- liquidité interne
- Structure haussière D1
Scénario :
• Reteste de la zone polarité + rejection
#057: Opportunité d'investissement à long terme sur USD/JPY
Le taux de change USD/JPY traverse une phase délicate. La structure sous-jacente reste baissière, mais des signes d'une possible réaction technique commencent à apparaître. Après une baisse impulsive et bien structurée, le marché a atteint une zone de liquidité importante, où la pression vendeuse
EUR/NZD : Double signal baissier sous les 0.786Analyse EUR/NZD
L'EUR/NZD évolue actuellement autour de 1.9704 après un rejet clair au niveau Fibonacci 0.786 (zone des 1.9750). Le prix a formé un double sommet dans la zone de résistance, accompagné d'une divergence baissière visible sur le RSI : le prix fait des sommets égaux tandis que le RSI m
BUY AUDCADLe dollar australien TVC:AXY a atteint mercredi un sommet de trois ans après des commentaires restrictifs du vice-gouverneur de la Banque de réserve d’Australie, Andrew Hauser, qui ont renforcé les attentes d’une nouvelle hausse des taux d’intérêt plus tard cette année.
Les marchés ont interprété
Achat sur replisEUR/USD – Vision journalière
Bandes de Bollinger étirées / RSI en surchauffe.
Clôture extérieure des BB.
Un repli serait bienvenu pour affiner une entrée,
mais il reste aussi possible que le prix continue de pumper.
Pour celles et ceux qui souhaitent analyser la structure plus en détail, tout est d
Impact d'Epstein sur la paire GBPUSD La publication de nouveaux dossiers Epstein la semaine dernière a mis le Premier ministre britannique Keir Starmer dans une situation politique délicate et pourrait entraîner une volatilité accrue des paires de devises impliquant la livre sterling.
La controverse porte sur Peter Mandelson et ses re
Voir toutes les idées sur le forex
Tradez directement sur les supercharts via nos courtiers agréés, entièrement vérifiés et évalués par les utilisateurs.
